AltCoin & MemeCoin Index Correlation [Eddie_Bitcoin]🧠 Philosophy of the Strategy
The AltCoin & MemeCoin Index Correlation Strategy by Eddie_Bitcoin is a carefully engineered trend-following system built specifically for the highly volatile and sentiment-driven world of altcoins and memecoins.
This strategy recognizes that crypto markets—especially niche sectors like memecoins—are not only influenced by individual price action but also by the relative strength or weakness of their broader sector. Hence, it attempts to improve the reliability of trading signals by requiring alignment between a specific coin’s trend and its sector-wide index trend.
Rather than treating each crypto asset in isolation, this strategy dynamically incorporates real-time dominance metrics from custom indices (OTHERS.D and MEME.D) and combines them with local price action through dual exponential moving average (EMA) crossovers. Only when both the asset and its sector are moving in the same direction does it allow for trade entries—making it a confluence-based system rather than a single-signal strategy.
It supports risk-aware capital allocation, partial exits, configurable stop loss and take profit levels, and a scalable equity-compounding model.
✅ Why did I choose OTHERS.D and MEME.D as reference indices?
I selected OTHERS.D and MEME.D because they offer a sector-focused view of crypto market dynamics, especially relevant when trading altcoins and memecoins.
🔹 OTHERS.D tracks the market dominance of all cryptocurrencies outside the top 10 by market cap.
This excludes not only BTC and ETH, but also major stablecoins like USDT and USDC, making it a cleaner indicator of risk appetite across true altcoins.
🔹 This is particularly useful for detecting "Altcoin Season"—periods where capital rotates away from Bitcoin and flows into smaller-cap coins.
A rising OTHERS.D often signals the start of broader altcoin rallies.
🔹 MEME.D, on the other hand, captures the speculative behavior of memecoin segments, which are often driven by retail hype and social media activity.
It's perfect for timing momentum shifts in high-risk, high-reward tokens.
By using these indices, the strategy aligns entries with broader sector trends, filtering out noise and increasing the probability of catching true directional moves, especially in phases of capital rotation and altcoin risk-on behavior.
📐 How It Works — Core Logic and Execution Model
At its heart, this strategy employs dual EMA crossover detection—one pair for the asset being traded and one pair for the selected market index.
A trade is only executed when both EMA crossovers agree on the direction. For example:
Long Entry: Coin's fast EMA > slow EMA and Index's fast EMA > slow EMA
Short Entry: Coin's fast EMA < slow EMA and Index's fast EMA < slow EMA
You can disable the index filter and trade solely based on the asset’s trend just to make a comparison and see if improves a classic EMA crossover strategy.
Additionally, the strategy includes:
- Adaptive position sizing, based on fixed capital or current equity (compound mode)
- Take Profit and Stop Loss in percentage terms
- Smart partial exits when trend momentum fades
- Date filtering for precise backtesting over specific timeframes
- Real-time performance stats, equity tracking, and visual cues on chart
⚙️ Parameters & Customization
🔁 EMA Settings
Each EMA pair is customizable:
Coin Fast EMA: Default = 47
Coin Slow EMA: Default = 50
Index Fast EMA: Default = 47
Index Slow EMA: Default = 50
These control the sensitivity of the trend detection. A wider spread gives smoother, slower entries; a narrower spread makes it more responsive.
🧭 Index Reference
The correlation mechanism uses CryptoCap sector dominance indexes:
OTHERS.D: Dominance of all coins EXCLUDING Top 10 ones
MEME.D: Dominance of all Meme coins
These are dynamically calculated using:
OTHERS_D = OTHERS_cap / TOTAL_cap * 100
MEME_D = MEME_cap / TOTAL_cap * 100
You can select:
Reference Index: OTHERS.D or MEME.D
Or disable the index reference completely (Don't Use Index Reference)
💰 Position Sizing & Risk Management
Two capital allocation models are supported:
- Fixed % of initial capital (default)
- Compound profits, which scales positions as equity grows
Settings:
- Compound profits?: true/false
- % of equity: Between 1% and 200% (default = 10%)
This is critical for users who want to balance growth with risk.
🎯 Take Profit / Stop Loss
Customizable thresholds determine automatic exits:
- TakeProfit: Default = 99999 (disabled)
- StopLoss: Default = 5 (%)
These exits are percentage-based and operate off the entry price vs. current close.
📉 Trend Weakening Exit (Scale Out)
If the position is in profit but the trend weakens (e.g., EMA color signals trend loss), the strategy can partially close a configurable portion of the position:
- Scale Position on Weak Trend?: true/false
- Scaled Percentage: % to close (default = 65%)
This feature is useful for preserving profits without exiting completely.
📆 Date Filter
Useful for segmenting performance over specific timeframes (e.g., bull vs bear markets):
- Filter Date Range of Backtest: ON/OFF
- Start Date and End Date: Custom time range
OTHER PARAMETERS EXPLANATION (Strategy "Properties" Tab):
- Initial Capital is set to 100 USD
- Commission is set to 0.055% (The ones I have on Bybit)
- Slippage is set to 3 ticks
- Margin (short and long) are set to 0.001% to avoid "overspending" your initial capital allocation
📊 Visual Feedback and Debug Tools
📈 EMA Trend Visualization
The slow EMA line is dynamically color-coded to visually display the alignment between the asset trend and the index trend:
Lime: Coin and index both bullish
Teal: Only coin bullish
Maroon: Only index bullish
Red: Both bearish
This allows for immediate visual confirmation of current trend strength.
💬 Real-Time PnL Labels
When a trade closes, a label shows:
Previous trade return in % (first value is the effective PL)
Green background for profit, Red for losses.
📑 Summary Table Overlay
This table appears in a corner of the chart (user-defined) and shows live performance data including:
Trade direction (yellow long, purple short)
Emojis: 💚 for current profit, 😡 for current loss
Total number of trades
Win rate
Max drawdown
Duration in days
Current trade profit/loss (absolute and %)
Cumulative PnL (absolute and %)
APR (Annualized Percentage Return)
Each metric is color-coded:
Green for strong results
Yellow/orange for average
Red/maroon for poor performance
You can select where this appears:
Top Left
Top Right
Bottom Left
Bottom Right (default)
📚 Interpretation of Key Metrics
Equity Multiplier: How many times initial capital has grown (e.g., “1.75x”)
Net Profit: Total gains including open positions
Max Drawdown: Largest peak-to-valley drop in strategy equity
APR: Annualized return calculated based on equity growth and days elapsed
Win Rate: % of profitable trades
PnL %: Percentage profit on the most recent trade
🧠 Advanced Logic & Safety Features
🛑 “Don’t Re-Enter” Filter
If a trade is closed due to StopLoss without a confirmed reversal, the strategy avoids re-entering in that same direction until conditions improve. This prevents false reversals and repetitive losses in sideways markets.
🧷 Equity Protection
No new trades are initiated if equity falls below initial_capital / 30. This avoids overleveraging or continuing to trade when capital preservation is critical.
Keep in mind that past results in no way guarantee future performance.
Eddie Bitcoin
Memecoin

Meme Coin Buy Signal Indicator by asharThis custom TradingView indicator is specifically designed for meme coins, using technical analysis indicators to identify optimal buy signals. It combines short-term moving averages, volume spikes, and Bitcoin trend alignment to pinpoint potential entry points during high-momentum periods.
Indicator Components:
Moving Averages (MA): A 5-period fast MA and a 13-period slow MA highlight short-term price momentum. Buy signals are generated when the fast MA crosses above the slow MA, indicating potential upward momentum.
Volume Spike Detection: The indicator detects high-volume periods using a multiplier. If the current volume exceeds the 10-period average volume by the set multiplier (default: 2.0), it indicates increased buying interest, which is crucial for meme coins.
Bitcoin Trend Alignment: The trend of Bitcoin, a market-wide sentiment indicator, is gauged with a 20-day moving average. Buy signals are validated only when Bitcoin is also in an uptrend, providing additional bullish confirmation for meme coins.
Buy Signal Criteria: A buy signal is triggered when:
The fast MA crosses above the slow MA.
Volume is above the average by the set multiplier.
The price is above the slow MA.
Bitcoin is trending up based on the 20-day moving average.
This indicator is ideal for meme coin traders looking to time entries with momentum-driven trends, aligning volume and trend indicators for a more comprehensive approach to high-risk assets.

Memecoin TrackerMemecoin Z-Score Tracker with Buy/Sell Table - Technical Explanation
How it Works:
This indicator calculates the Z-scores of various memecoins based on their price movements, using historical funding rates across multiple exchanges. A Z-score measures the deviation of the current price from its moving average, expressed in standard deviations. This provides insight into whether a coin is overbought (positive Z-score) or oversold (negative Z-score) relative to its recent history.
Key Components:
- Z-Score Calculation
- The lookback period is dynamically adjusted based on the chart’s timeframe to ensure consistency across different time intervals:
- For lower timeframes (e.g., minutes), the base lookback period is scaled to match approximately 240 minutes.
- For daily and higher timeframes, the base lookback period is fixed (e.g., 14 bars).
Memecoin Selection:
The indicator tracks several popular memecoins, including DOGE, SHIB, PEPE, FLOKI, and others.
Funding rates are fetched from exchanges like Binance, Bybit, and MEXC using the request.security() function, ensuring accurate real-time price data.
Thresholds for Buy/Sell Signals:
Users can set custom Z-score thresholds for buy (oversold) and sell (overbought) signals:
Default upper threshold: 2.5 (indicates overbought condition).
Default lower threshold: -2.5 (indicates oversold condition).
When a memecoin’s Z-score crosses above or below these thresholds, it signals potential buy or sell conditions.
Buy/Sell Table:
A table with two columns (BUY and SELL) is dynamically populated with memecoins that are currently oversold (buy signal) or overbought (sell signal).
Each column can hold up to 20 entries, providing a clear overview of current market opportunities.
Visual Feedback:
The Z-scores of each memecoin are plotted as a line on the chart, with color-coded feedback:
Red for overbought (Z-score > upper threshold),
Green for oversold (Z-score < lower threshold),
Other colors indicate neutral conditions.
Horizontal lines representing the upper and lower thresholds are plotted for reference.
How to Use It:
Adjust Thresholds:
You can modify the upper and lower Z-score thresholds in the settings to customize sensitivity. Lower thresholds will increase the likelihood of triggering buy/sell signals for smaller price deviations, while higher thresholds will focus on more extreme conditions.
View Real-Time Signals:
The table shows which memecoins are currently oversold (buy column) or overbought (sell column), updating dynamically as price data changes. Traders can monitor this table to identify trading opportunities quickly.
Use with Different Timeframes:
The Z-score lookback period adjusts automatically based on the chart's timeframe, making this indicator suitable for intraday and long-term traders.
Use shorter timeframes (e.g., 1-minute, 5-minute charts) for faster signals, while longer timeframes (e.g., daily, weekly) may yield more stable, trend-based signals.
Who It Is For:
Short-Term Traders: Those looking to capitalize on short-term price imbalances (e.g., day traders, scalpers) can use this indicator to identify quick buy/sell opportunities as memecoins oscillate around their moving averages.
Swing Traders: Swing traders can use the Z-score tracker to identify overbought or oversold conditions across multiple memecoins and ride the reversals back toward equilibrium.
Crypto Enthusiasts and Memecoin Investors: Anyone involved in the volatile memecoin market can use this tool to better time entries and exits based on market extremes.
This indicator is for traders seeking quantitative analysis of price extremes in memecoins. By tracking the Z-scores across multiple coins and dynamically updating buy/sell opportunities in a table, it provides a systematic approach to identifying trade setups.

Lockin Strength Indicator (LSI)How It Works:
RSI Calculation: The standard RSI is calculated using a 14-period by default.
Volume Weighting: If enabled, the LSI modifies the RSI by weighting it based on the volume relative to its moving average. This emphasizes periods of high or low volume, which can be particularly useful for Solana-based assets that might have unique volume profiles.
Plotting: The LSI is plotted with standard overbought and oversold levels, and background highlighting makes these areas visually distinct.
Customization:
RSI Length: You can adjust the length of the RSI period.
Overbought/Oversold Levels: You can modify the levels for overbought and oversold signals.
Volume Weighting: You can toggle volume weighting on or off.
This indicator is designed to give you a more nuanced view of Solana cryptocurrencies by combining RSI with volume dynamics.

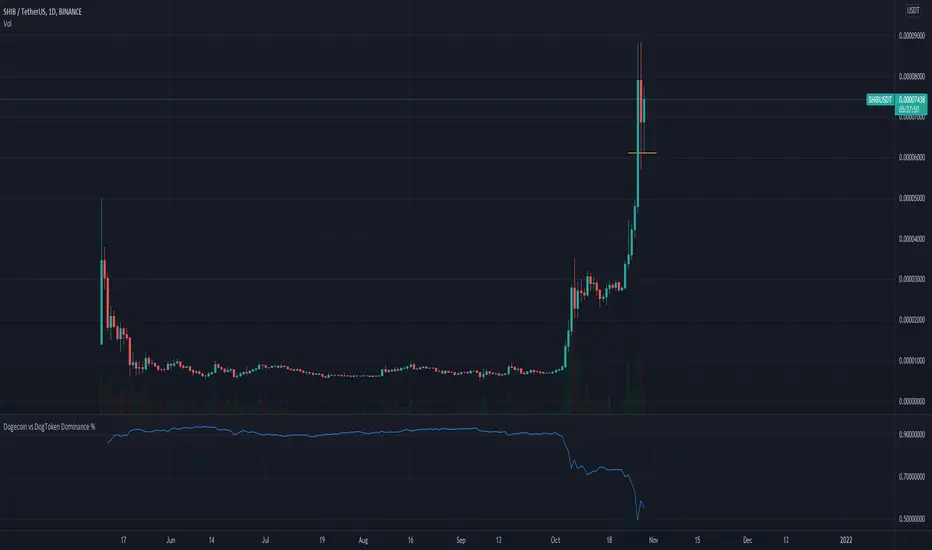
Dogecoin vs DogToken Dominance %This script plots the Dogecoin dominance against other meme dog tokens like Shiba Inu , Akita Inu and Dogelon .
The current circulating supply of Akita and Dogelon are hardcoded for now.