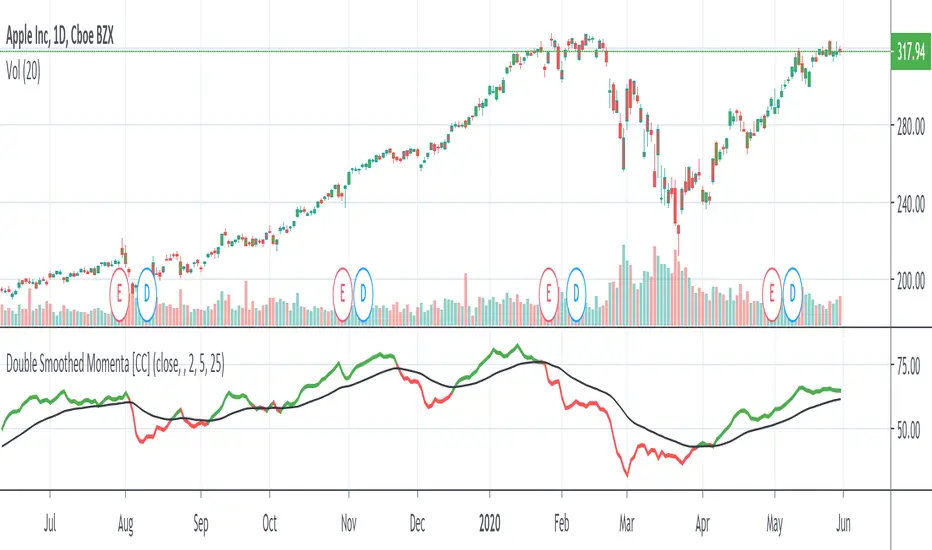
Double Smoothed MomentaDouble Smoothed Momenta was created by William Blau (Stocks & Commodities V. 9:5 (202-205)). His original indicator didn't use a signal period so I added one to notify you when to buy or sell. Buy when the indicator goes over the signal line and sell when it is falls below the signal line.
Let me know what other indicators you would like me to write scripts for!
Oscillatori Momentum
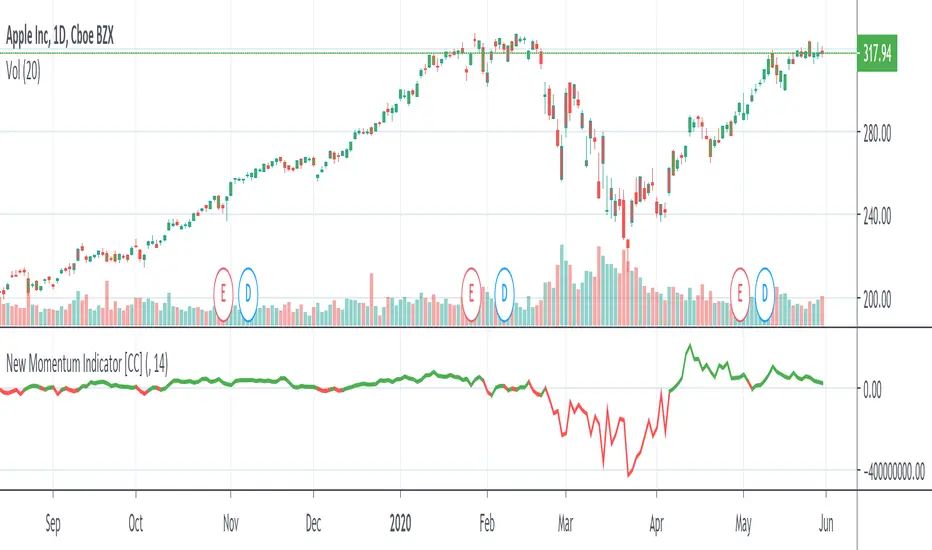
New Momentum IndicatorThe Momentum Indicator was created by Darryl W Maddox (Stocks & Commodities V. 9:4 (158-159)) and it is one of the simplest and most powerful indicators out there. Buy when the indicator goes over 0 and sell when it falls below 0
Let me know what other indicators you would like to see me write a script for!
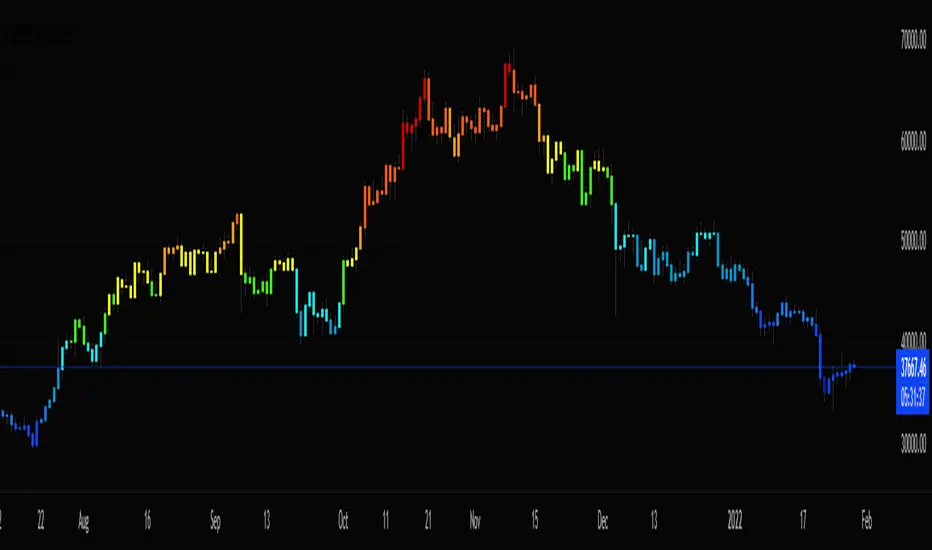
Stochastic CandlesA series of up to 28 stochastics oscillators used to form an average stochastic value, which is then used to colour the candles based on the momentum.
Each candle can be coloured one of ten colours and each one represents a position on the stochastic oscillator.
The indicator helps traders to visualise the momentum and helps trend following.
Inputs:
MA: multiple smoothing methods
Theme: multiple colours
Increment: stochastic length start and increments
End: stochastic length end
Smooth: smooth stochastic
Stochastic Heat MapA series of 28 stochastic oscillators plotted horizontally and stacked vertically from bottom to top as the oscillator background.
Each oscillator has been interpreted and the value has been used to colour the lines in.
Lower lines are shorter term stochastics and higher lines are longer term stochastics.
The average of the 28 stochastics has been taken and then used to plot the fast oscillator line, which also has a slow oscillator line to follow.
The oscillator line can be used to colour in the candles.
Inputs:
MA: multiple smoothing methods
Theme: multiple colours
Increment: stochastic length start and increments
Smooth Fast: smooth fast length
Smooth Slow: smooth slow length
Paint Bars: colour candles
Waves: toggle method to weight/increment stochastics
Heat map shows momentum extremes:

TS - Momentum OscillatorWhat is it?
RMI & EMA based momentum oscillator to act as a supporting indicator to the rest of the Tradespot indicator suite. Combined trading is made intuitive and accessible to traders of all levels.
Momentum can help you confirm an existing trade, whether to hold position and avoid fakeouts. or it may let you know when the market is losing steam for example and could be a good point to take profit.
Access
This is one of the indicators in our greater trading suite that we offer. Just PM me for access!

Force IndexWhat is the force index ?
The force index is an oscillator used to confirm price breakout strengths and identify potential trends.
It was popularized by A. Elder.
How the force index is computed ?
Knowing that volume is the fuel of a price movement, reliable breakouts and trend continuation are more likely to occur on high volume breakouts. This is why the force index is computed with the intensity of the price movement, and it's volume , using the formula ema13((close(n) - close(n-1)) * volume ) .
How to use the force index
An important change in the force index indicate a strong momentum in the price action.
You can read more about the force index interpretation on Investopedia
Customization
You can display the indicator as an histogram, or as a line chart.
You can change EMA length, although it's recommended to keep it at default value.

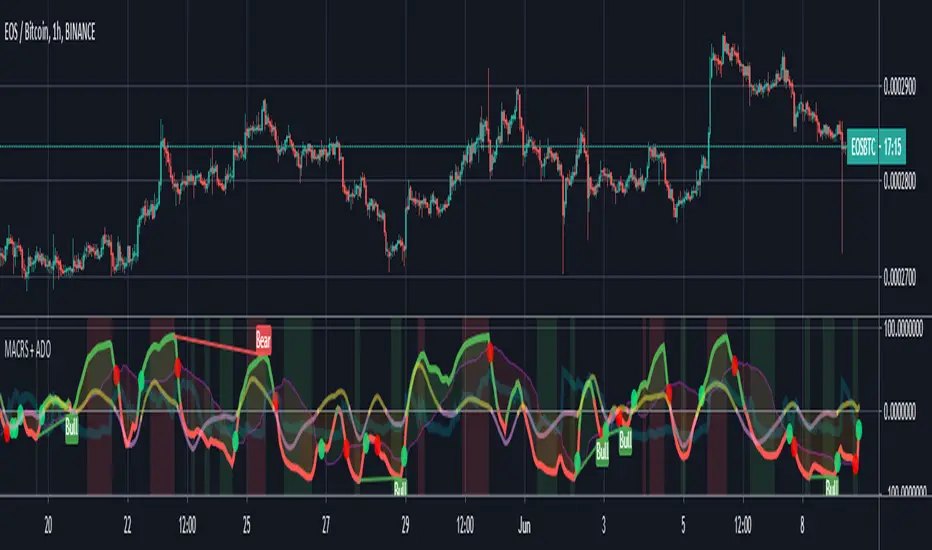
MACD modulated RSIThe main oscillator is the RSI modulated by the MACD (default). The RSI mode can be disabled to revert to a normal MACD oscillator for the main oscillator.
When the main oscillator (thicker line) is > 0, it is green; and if it is < 0, it is red.
The MACD can be re-scaled and whenever its value > 100, a background fill between the oscillator and the zeroline appear to indicates overbought condition; and < -100 indicates oversold condition. The user can tweak the scaling factor to optimize this for a given chart and timeframe.
A proprietary asymmetric differential oscillator (ADO) is also implemented, which is modulated by the main oscillator. When this (thinner line) secondary oscillator is > 0, it is yellow; and when it is < 0, it is lavender. The user can select the order of the differential (i.e. Order 1 = Momentum, Order 2 = Acceleration, Order 3 = Jerk, Order 4 = Snap, Order 5 = Crackle, Order 6 = Pop). This oscillator provides details of the more subtle underlying/hidden trends that is emerging or brewing, and may hint of an incoming move ahead of time. Divergence in the sign and slope of this secondary oscillator with respect to the main oscillator may provide a useful edge for trade setup.
A (thick transparent light blue) volume oscillator is also provided. An increase in volume trend provides confirmation of (or solidifies) the movements in the main oscillator over that period. A falling volume oscillator trend raises doubts on the main oscillator trend, and hints of the possibility of a counter-trend (also look at the secondary ADO oscillator for clues).
The novel aspects and principles of this indicator and this source code are the property of © cybernetwork.
This indicator and script is free for the TV community to use.
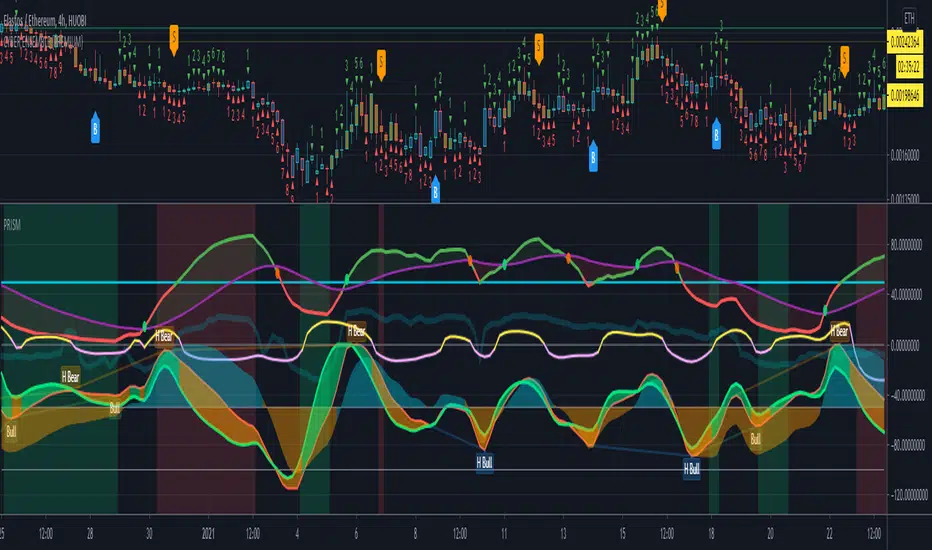
PRISM Oscillators Set {PREMIUM}The PRISM Oscillator Set consists of:
(1) A modified-pSAR derived main driving oscillator (P-Oscillator).
(2) With MAJeStic (Momentum, Acceleration, Jerk, Snap) Oscillators Set (M-, A-, J-, S-Oscillators respectively).
User can switch the main oscillator to RSI-mode (default), as well as reverting to configurable EMA/SMA MACD mode as well.
The P-Oscillator
The P-Oscillator (centered at 50 in the y-axis) indicates the instantaneous bullish/bearish cycle of the market, and the degree of which.
A MA-line is provided as well (VWMA-mode is set as the default, but user can choose to switch to SMA-mode).
The crossing of the P-Oscillator into its MA-line signals a significant turn in the P-Oscillator , similar to how the cross between MAs are being used to signal a golden/death-cross (example: P-Oscillator crossing down its MA-line indicates a probable shift into the bearish phase).
The MAJeStic-Oscillators
The MAJeStic-Oscillators are derived from the main P-Oscillator .
The M-Oscillator is the momentum oscillator, to more clearly visually indicate the current momentum phase of the main P-Oscillator -- i.e. when the oscillator is above the zeroline at -50, the P-oscillator is in an uptrend; and the magnitude of which indicates the velocity (or to be more precise, the speed) of the current momentum trend.
The AJ-Ribbon consists of the acceleration and jerk oscillators, to indicate the hidden underlying trends in the momentum. They can be thought of as the hidden force/hand that pushes and pulls the momentum oscillator upwards or downwards.
Both the M-Oscillator and the AJ-Ribbon are y-shifted down with its zeroline set at -50, simply for the purpose of clarity of presentation for this multiple-oscillator script.
The S-Oscillator is centered about the 0 as its zeroline. It is a highest-order indicator, derived from the AJ-Ribbon , and is an extremely sensitive indicator -- which is able to dig up even the more subtle market trends that may later cascade into a more macro trend. For example: when it crosses from the negative into the positive (especially with a steeply positive slope) and holds above the zeroline, it is then likely that price will see some upside movement ahead (depending on the magnitude of the oscillator as well), even if it may presently be simply moving sideways or even downwards (i.e. a divergence in the S-oscillator wrt the current price movement).
The alignment of the various indicators gives the clearest signal of the market trend, however, that naturally isn't always the case. Hence, when signals from the oscillators looks conflicted, the higher order oscillators (i.e. the AJ-Ribbon, and the S-Oscillator) will be helpful indicators of possible movement incoming; alternatively looking for divergence and hidden divergence of the P-Oscillator (set to RSI-mode) is also an effective strategy.
This oscillator set is suitable to be applied on any timeframes and on any charts.
This oscillator does not give precise price targets, but only offers a qualitative view of the present as well as the probable incoming price action.
To (attempt to) predict price targets, I personally use the PRISM Oscillator Set in conjunction a combination of various support & resistance analytical strategies: e.g. VPVR-levels, moving averages, trend-lines, Ichimoku Cloud, etc. and looking/waiting for sufficient candle closing and break-outs for confirmation, etc.
The PRISM Oscillator Set provide a momentum-focused perspective of the current market.
While my other script, Cyber Ensemble ( which generates buy/sell signals base on the scoring of a large ensemble of technical indicators + and modified by a series of filters ), provides a technical perspective of the current market; and which I frequently use conjunction with the PRISM Oscillator Set .
~ * ~ * ~ * ~ * ~ * ~ * ~ * ~ * ~ * ~ * ~ * ~ * ~ * ~ * ~ * ~ * ~ * ~ * ~ * ~ * ~
Note:
In no way is this intended as a financial/investment/trading advice. You are responsible for your own investment/trade decisions.
Please exercise your own judgement for your own trades base on your own risk-aversion level and goals as an investor or a trader. The use of OTHER indicators and analysis in conjunction (tailored to your own style of investing/trading) will help improve confidence of your analysis, for you to determine your own trade decisions.
~ * ~ * ~ * ~ * ~ * ~ * ~ * ~ * ~ * ~ * ~ * ~ * ~ * ~ * ~ * ~ * ~ * ~ * ~ * ~ * ~
Please PM me for access information.
© cybernetwork
Correlation Coefficient {Cybernetwork}Correlation Coefficient (CC): with CC momentum and acceleration oscillators, and momentum-divergence indicator.

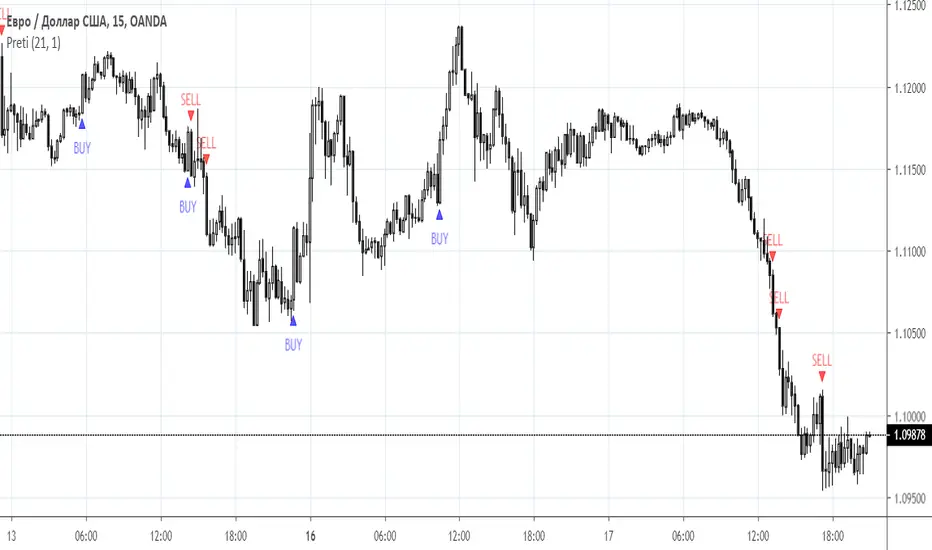
Momentum indicator PretiPreti Momentum Indicator
Class : volatility
Trading type : intraday trading
Time frame : 5 min -1 day
Purpose : momentum trading
Level of aggressiveness : standard
“Preti Momentum Indicator” is based on price patterns detection after abnormal price changes. One of the patterns based on abnormal returns is as follows: after an abnormally strong rise / fall in price short-term momentum movement appears.
This indicator, using a specialized statistical technics, identifies moments of abnormal returns and generates trading signals based on momentum effect.
“Preti Momentum Indicator” displays buy / sell signals directly on the chart, which makes it very easy to understand and used even for beginners in trading and technical analysis.
Parameters of the indicator
To configure the indicator, the following parameters are provided:
- Period (default value is 21) - period of indicator. It is used to define normal returns.
- Dev (default value - 1) – Is used to detect abnormal returns. It defines levels of aggressiveness in trading signals. The bigger the value is the more conservative signals are generated
Rules of trading
The rules of trading are extremely easy. The appearance of a “sell” (sell signal) and “buy” (buy signal) on the chart is a signal to open appropriate position.
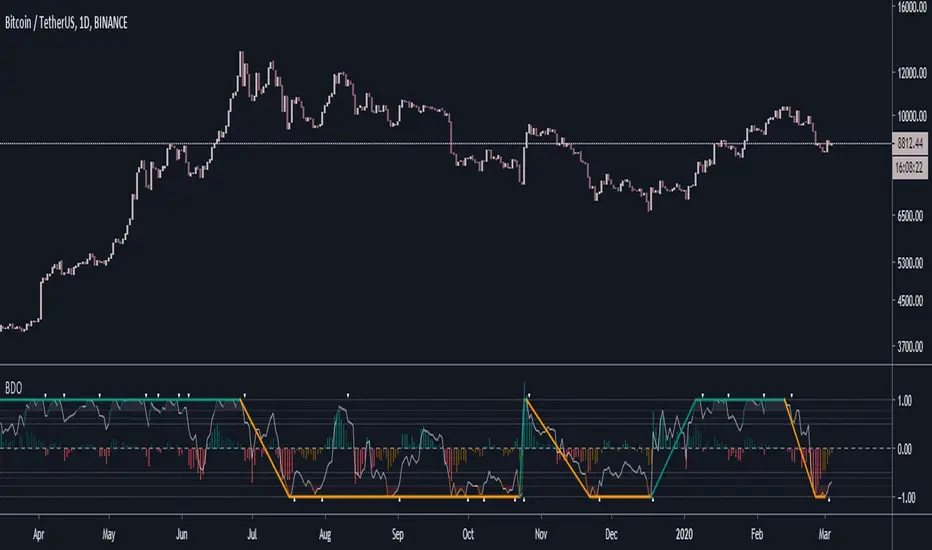
Better Donchian OscillatorWhat is BDO?
- BDO is the Better Donchian Oscillator. This is a proprietary indicator which I derived from the donchian formula.
BDO usage
1. BDO is mainly used to determine overbought and oversold levels. I think it is more accurate in determing these levels than RSI or MACD.
2. It can also be used to follow major trends with a very high accuracy, although it is lagging. However, its main oscillator in the middle is still a leading indicator.
Access and Documentation:
Message or PM to know how to get access.
Uber M-Oscillator (M. Fawzy, 2018) [UTS]General Usage
The M-Oscillator analyses the price change rather than the price level. It draws the difference between prices at two time intervals.
It is a leading indicator of price direction. It can identify when the current trend is no longer maintaining its same level of strength or is losing
momentum. The importance of the momentum is when its value reaches to extreme levels either up or down.
Interpretation
M-Oscillator reading for default period of 14.
M-Oscillator is plotted along the bottom of the price chart; it
fluctuates between positive and negative 14.
Movement above 10 is considered overbought, and movement
below -10 is oversold.
In sharp moves to the upside, the M-Oscillator fluctuates
between 5 and 14, while in down side it fluctuates between -5
and -14.
In an uptrend, the M-Oscillator fluctuates between zero and
14 and vice versa.
The advantage
The momentum line leads the price action (it leads the
advance or decline in prices).
The crossing of the zero line is considered as a trading signal.
The disadvantage
The need for an upper and lower boundary.
If recent price gains are the same as older price gains, the
momentum line will be fl at even though the market is still
going up.
If recent price gains are less than those of before, even if
prices are still rising, the rate of change will have slowed
further, and the momentum line will actually drop.
Using price differences in the erratic movements often caused
by sharp changes in the value.
The "Uber" M-Oscillator
The Uber version of M-Oscillator provides the following improvements:
Period is not fixed to 14 anymore, can be determined freely
Overbought and oversold conditions are automatically adjusted to the chosen period
Ability to draw oscillator crosses on the signal line
For both oscillator and signal line smoothing 16 moving averages are available
Available Moving Averages
16 different moving averages are available for oscillator and signal line:
ALMA (Arnaud Legoux Moving Average)
DEMA (Double Exponential Moving Average)
EMA (Exponential Moving Average)
FRAMA (Fractal Adaptive Moving Average)
HMA (Hull Moving Average)
JURIK (Jurik Moving Average)
KAMA (Kaufman Adaptive Moving Average)
Kijun (Kijun-sen / Tenkan-sen of Ichimoku)
LSMA (Least Square Moving Average)
RMA (Running Moving Average)
SMA (Simple Moving Average)
SuperSmoothed (Super Smoothed Moving Average)
TEMA (Triple Exponential Moving Average)
VWMA (Volume Weighted Moving Average)
WMA (Weighted Moving Average)
ZLEMA (Zero Lag Moving Average)
Alerts
Traders can easily use the trend change signals to trigger alerts from:
Cross Up
Cross Down
Those values are > zero if a condition is triggered.
Alert condition example: "Cross Up" - "GreaterThan" - "0"
Trading tactics
Overbought/Oversold:
We define the overbought area as anywhere above the 10
level. The oversold area is below -10. When the M-Oscillator goes
above 10 (overbought) and then re-crosses it to the downside,
a sell signal is triggered. When the M-Oscillator surpasses -10
to the downside and then re-crosses back above this level, a
buy signal is triggered. This tactic is only successful during
sideways markets; during an uptrend, the oscillator will remain
in its overbought territory for long period of times. During a
downtrend, it will remain in oversold for a long time.
Overbought/Oversold rule:
Buy when the M-Oscillator violates the (-10) level to the
downside and crosses back to the upside
Sell when the M-Oscillator crosses above the (+10) level and
crosses back to the downside
Divergence:
Divergence is one of the most striking features of the
M-Oscillator. It is a very important aspect of technical analysis
that enhances trading tactics enormously; it shows hidden
weakness or strength in the market, which is not apparent in
the price action. A positive divergence occurs when the price is
declining and makes a lower low, while M-Oscillator witnesses
a higher low. A negative divergence occurs when the price is
rising and makes a higher High, while the M-Oscillator makes
a lower high, which indicates hidden weakness in the market.
Divergences are very important as they give us early hints of
trend reversal.
Divergence rule:
Buy when the M-Oscillator witnesses a positive divergence
with prices followed by a rise above (-10)
Sell when the M-Oscillator witnesses a negative divergence
with prices followed by a decline below (+10)
Support and Resistance
During an uptrend, the M-Oscillator moves between (0) and
(+10). During a downtrend, most of the time the M-Oscillator
will move between (0) and (-10). Sometimes the (0) level acts
as support (in the case of uptrends) and resistance (during
downtrends). We can buy during an uptrend when the
M-Oscillator reaches its midrange (0) and begins to move to the
upside from there. During downtrends, an upward move to (0)
might be a selling opportunity.
It is also used as exit signal (when the M-Oscillator acts as a
resistance) as well as indication of a re-entry level (when the
M-Oscillator acts as a support)
Exit signal:
When the M-Oscillator crosses above the (-10), giving
a buy signal, but it doesn’t retrace further than the zero
line, the M-Oscillator drops towards the lower boundary.
This is considered as weakness and an exit signal when the
M-Oscillator drops from the zero line toward the (-10). (To avoid
whipsaws, filters can be used.)
Re-entry:
When the M-Oscillator breaks the (+10), giving a sell signal,
but it doesn’t retrace further than the zero line, the M-Oscillator
rebounds toward the upper boundary. This is considered as
strength and a re-entry point when the M-Oscillator rebounds
from zero line to upside. (To avoid whipsaws, filters can be used.)
Using M-Oscillator as a Trend Identifier on LongTerm Scale
During downtrends, the M-Oscillator does not reach
overbought zone. A move toward the overbought area is a sign of
strength when it occurs for the first time in a while. On the other
hand, during uptrend, the M-Oscillator does not reach oversold
areas easily. Going into oversold and staying there after a long
time is a signal that the uptrend is reversing. (As Constance
Brown explained in her book Technical Analysis for the Trading
Professional, chapter 1, “oscillators do not travel between 0 and
100”.)
Crossover on Extreme Levels
Sell signals are triggered when the M-Oscillator crosses
its signal line above (13), which indicates an extreme market
condition, and buy signals are triggered when the M-Oscillator
crosses its signal line below (- 13).

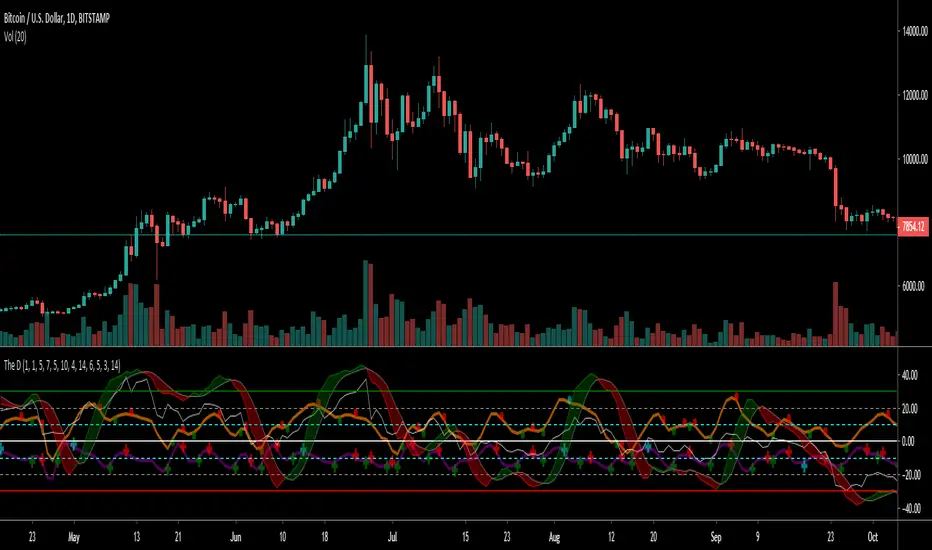
ZFelds Stoch Cubed³Three Stochastic Lengths combined into one unit based on the Stochastacult Strategy.
Thanks to Krown and The Caretaker for the inspiration for this indicator.
Pink = Fast Plot
Red/Orange = Medium Plot
Blue/Green = Slow Plot
Purple Zone = Bearish Control Zone
Blue Zone = Bullish Control Zone
The indicator is used in the following fashion for optimal scalping entries/exits especially.
Long Entries: Look for the fast (Pink) Plot to cross upwards through the Medium AND Slow Plots in the Bearish Control Zone (Purple Zone)
Short Entries: Look for the fast (Pink) Plot to cross DOWNWARDS through the Medium AND Slow Plots in the Bullish Control Zone (Blue Zone)
~~~~
Pink Crossing Red/Orange plots = earlier signal
Pink Crossing Blue/Green plots = later signal (often continuation signal)
~~~~
These postures can hold even more weight when aligned with divergence, horizontal levels, moving averages, Bollinger bands, etc.
~~~~

Elder's Force Index with bollinger bandsThis scripts is usefull to identify possible top or bottoms of the markets.
Red BB : Sell
Green BB : Buy

RVGI Space Value- Momentum Oscillator
- Calculates Distance Between RVGI Lines
- Can be used as a substitute and/or complement to RSI

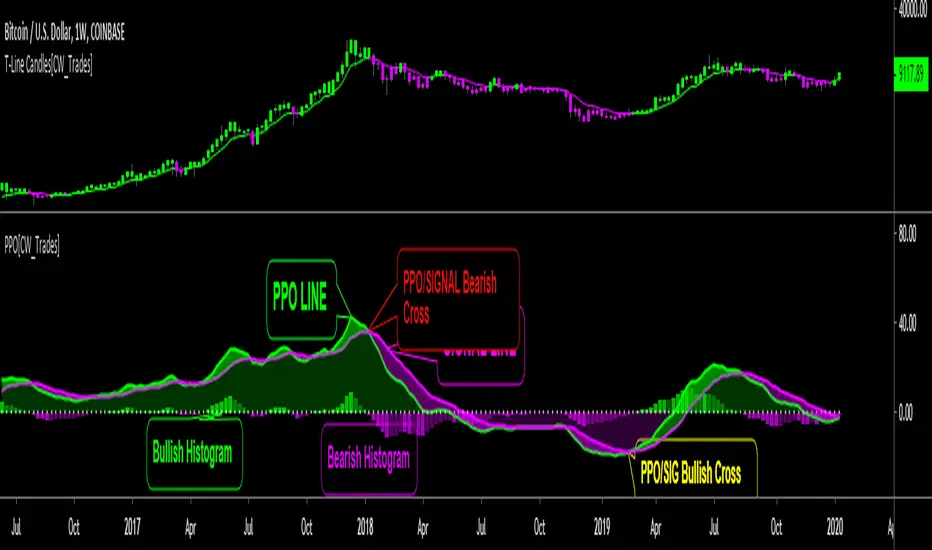
Price Percent OscillatorThe Percentage Price Oscillator(PPO) is a momentum oscillator that measures the difference between two moving averages as a percentage of the larger moving average. Similar to the Moving Average Convergence/Divergence(MACD), the PPO is comprised of a signal line, a histogram and a centerline. Signals are generated with signal line crossovers, centerline crossovers, and divergences. Because these signals are no different than those associated with MACD, this indicator can be read exactly as the MACD is read. The main differences between the PPO and MACD are: 1) PPO readings are not subject to the price level of the security. 2) PPO readings for different securities can be compared, even when there are large differences in the price. MACD readings for different securities cannot be compared when there are large differences in price.
Calculations:
Percentage Price Oscillator (PPO): {(12-day EMA - 26-day EMA)/26-day EMA} x 100
Signal Line: 9-day EMA of PPO
PPO Histogram: PPO - Signal Line
This PPO indicator retains standard PPO settings. Additions to this indicator are: 1) filling the space between the PPO LINE and SIGNAL LINE. Space is green when PPO is above SIGNAL, purple when PPO is below SIGNAL. The color of the space between PPO and SIGNAL is used to define short-term momentum for price(green is positive momentum, pink is negative momentum). 2) filling the space between the PPO LINE and CENTER LINE(0 LEVEL). This space is filled green when the PPO is above the CENTER LINE and pink when the PPO is below the CENTER LINE. Green in this area indicates positive momentum in the intermediate-term while pink indicates negative momentum in the intermediate-term.
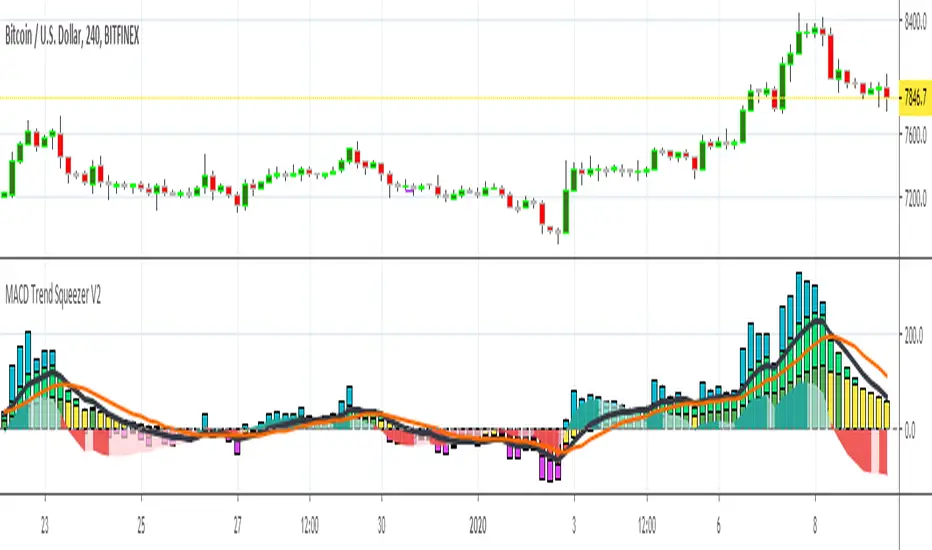
MACD Trend Squeezer V2This is a combination of a slightly sped up MACD overlay on top of a modified Bar Trend Squeeze or highly modified Momentum indicator. Helps to see the trend/momentum matched with the characteristics of the MACD and it's historiography. Very user friendly for adjusting color, transparency, depth, lines, size, etc.
MACD is the dark gray line.
Its signal slower line is orange.
Its historiography is the area fill blues and reds
Trend Squeezer / momentum are the Bars in the background.
// Changes from original version \\
Visual depth mostly. Most of the items are adjustable in the settings.
Increased user friendly inputs to adjust colors, lines, data, etc.
(darken / lighten and change background bar colors, increase/decrease line strengths and colors, adjust field data inputs)
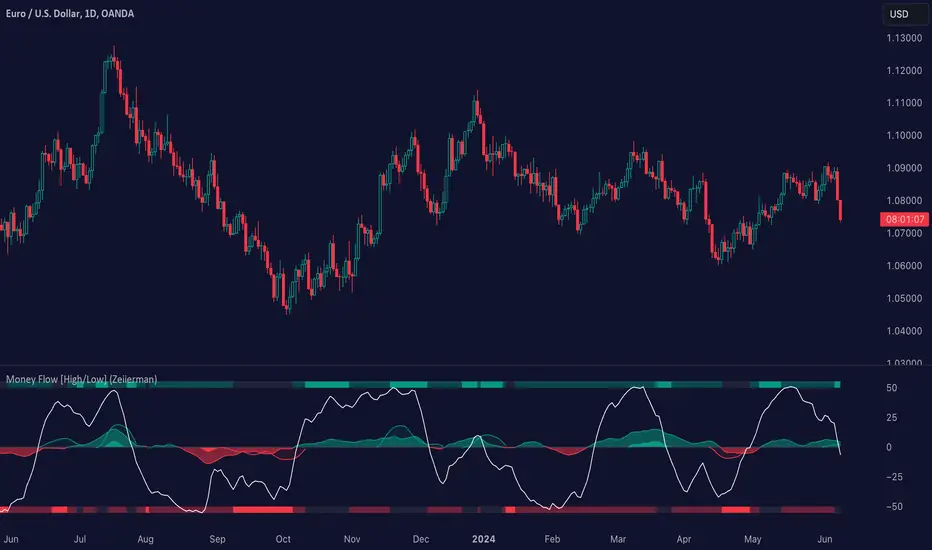
High – Low Trend Indicator Signal (Expo)High - Low Trend Indicator Signal - (Expo)
DESCRIPTION
This indicator is derived from my previous one called High – Low Trend Indicator (Expo) , but the difference is that this one generates Long signals and detects market changes. These two indicators are intended to be used in the same chart for better accuracy and validation of signals. The indicator is perfectly used to identify pullbacks in positive trends!
HOW TO USE
When a signal appears, consider enter long, or look for confirmation patterns. Such confirmation could be seen in the High – Low Trend Indicator (Expo) when the red cloud disappears or when the black price line crosses out from the red cloud, or when the black price line crosses up over the blue midline.
So,
1. Use the indicator to identify Long signals.
2. Use the indicator to find Entry points in positive trends.
3. Use the indicator to detect market changes.
4. Combine it with High – Low Trend Indicator (Expo).
INDICATOR IN ACTION
The indicator is best presented live, the graphs below are a good guide.
EURUSD
DAX
WALL STREET
GOLD
I hope you find this indicator useful , and please comment or contact me if you like the script or have any questions/suggestions for future improvements. Thanks!
I will continue to work on this indicator, so please share your experience and feedback with me so that I can continuously improve it. Thanks to everyone that have contacted me regarding my scripts. Your feedback is valuable for future developments!
ACCESS THE INDICATOR
• Contact me on TradingView or use the links below
-----------------
Disclaimer
Copyright by Zeiierman.
The information contained in my scripts/indicators/ideas does not constitute financial advice or a solicitation to buy or sell any securities of any type. I will not accept liability for any loss or damage, including without limitation any loss of profit, which may arise directly or indirectly from use of or reliance on such information.
All investments involve risk, and the past performance of a security, industry, sector, market, financial product, trading strategy, or individual’s trading does not guarantee future results or returns. Investors are fully responsible for any investment decisions they make. Such decisions should be based solely on an evaluation of their financial circumstances, investment objectives, risk tolerance, and liquidity needs.
My scripts/indicators/ideas are only for educational purposes!
The DiamondThe Diamond is a collection of 3 custom oscillators and the RSI. It tries to visualizing how the momentum is increasing and decreasing and gives some buy and sell signals.
Every Line explained:
Orange line: The SMI(Swing Momentum Indicator) it is alternating oscillator between the value -10 and 40 and has its baseline at 10. It showing accumulation and increase of momentum and is used as a trend confirmation
Purple line: The BTD(Buy the Dip) is a modified Version of the SMI. It should be used in Bull or Bearflags to time entries. Also the Horizontal lines can be used as Support or Resistance
Green/Red Band: This one is a custom made stochastic. In its calculation it smoothing Tops/Lows to reduce noise. Also the look is better.
White line: Just a 14-lenght RSI. I use it together with the SMI and BTD to get confirmation
The Indicator is doing best in the crypto market. High market cap Coins/USDT Pairs do better than low market cap and btc pairs. Also it should be only used on timeframes greater than 4h. 6h and daily preferred. On higher time frames you need to adjust the values of the BTD and SMI.
Bearish divergence on both Indicators in a down trending market do give a good short entry.
Bullish divergence on the daily gives good swing entries in a downtrend
Elder's force index impulseForce Index is an oscillator. It combines volume with prices
to discover the force of bulls or bears behind every rally or decline.
It brings together three essential pieces of information the direction of price
change, its extent, and the volume during that change. It provides a practical way of
using volume for making trading decisions.
Force Index can be used in its raw form, but its signals stand out much more
clearly if we smooth it with a moving average. Using a short EMA of Force Index
helps pinpoint entry and exit points. Using a longer EMA helps confirm trends.
Efi long > 0 (bullish trend) and efi short < 0 = buy signal (green bar)
Efi long < 0 (bear trend) and efi short>0 = sell signal (red bar)

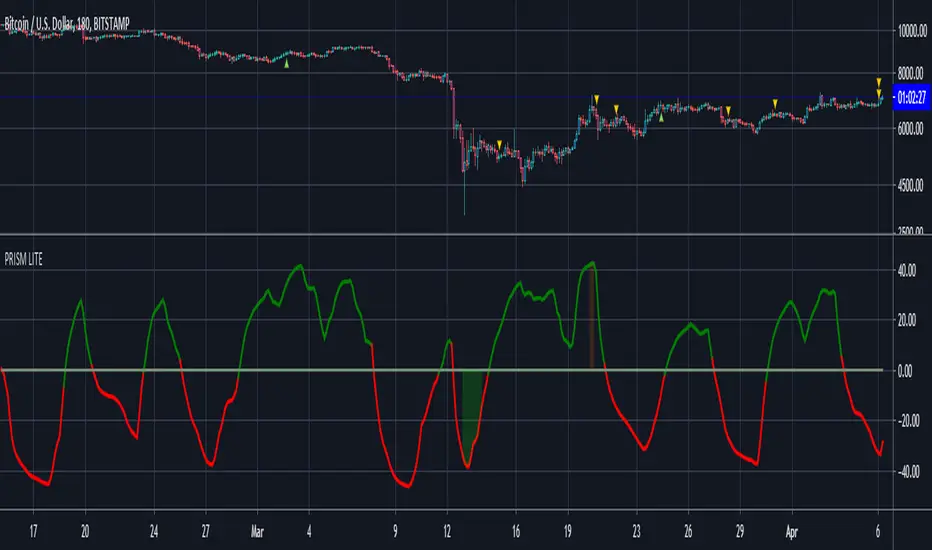
PRISMpSAR derived oscillator with its set of RSI & StochRSI and MAJestic (Momentum, Acceleration, Jerk) Oscillators Set
pSAR and MAJ oscillators can be disabled and hidden.
~ * ~ * ~ * ~ * ~ * ~ * ~ * ~ * ~ * ~ * ~ * ~ * ~ * ~ * ~ * ~ * ~ * ~ * ~ * ~ * ~
Note:
In no way is this intended as a financial/investment/trading advice. You are responsible for your own investment decisions and trades.
Please exercise your own judgement for your own trades base on your own risk-aversion level and goals as an investor or a trader. The use of OTHER indicators and analysis in conjunction (tailored to your own style of investing/trading) will help improve confidence of your analysis, for you to determine your own trade decisions.
~ * ~ * ~ * ~ * ~ * ~ * ~ * ~ * ~ * ~ * ~ * ~ * ~ * ~ * ~ * ~ * ~ * ~ * ~ * ~ * ~
Please check out my other indicators sets and series, e.g.
LIVIDITIUM (dynamic levels),
AEONDRIFT (multi-levels standard deviation bands),
FUSIONGAPS (MA based oscillators),
MAJESTIC (Momentum/Acceleration/Jerk Oscillators),
PRISM (pSAR based oscillator, with RSI/StochRSI as well as Momentum/Acceleration/Jerk indicators),
PDF (parabolic SAR /w HighLow Trends Indicator/Bar-color-marking + Dynamic Fib Retrace and Extension Level)
and more to come.
Constructive feedback and suggestions are welcome.
If you like any of my set of indicators, and it has benefited you in some ways, please consider tipping a little to my HRT fund. =D
cybernetwork @ EOS
37DzRVwodp5UZBYjCKvVoZ5bDdDqhr7798 @ BTC
MPr8Zhmpsx2uh3F5R4WD98MRJJpwuLBhA3 @ LTC
1Je6c1vvSCW7V2vA6RYDt6CEvqGYgT44F4 @ BCH
AS259bXGthuj4VZ1QPzD39W3ut4fQV5giC @ NEO
rDonew8fRDkZFv7dZYe5w3L1vJSE51zFAx @ Ripple XRP
0xc0161d27201914FC0bAe5e350a193c8658fc4742 @ ETH
GAX6UDAJ52OGZW4FVVG3WLGIOJLGG2C7CTO5ZDUK2P6M6QMYBJMSJTDL @ Stellar XLM
xrb_16s8cj8eoangfa96shsnkir3wctdzy76ajui4zexek6xmqssweu85rdjxrt4 @ Nano
~ JuniAiko
(=^~^=)v~
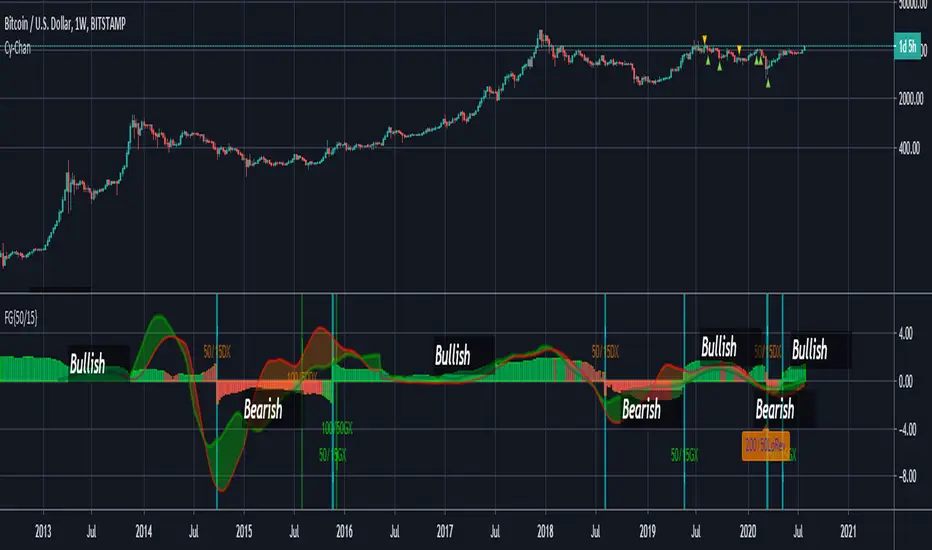
FUSIONGAPS V4 {50/15-Series}Base on the FUSIONGAPS oscillator series, but Only the 50/15 oscillator is plotted, and with Momentum and Acceleration oscillators added.
The thickest line is the FG oscillator: Red/Green coloring indicates if the market is in a Bearish/Bullish period.
The green colored line is the DFG oscillator (DIFFERENTIAL FUSIONGAPS: Price Momentum)
The red colored line is the D2FG oscillator (DOUBLE-DIFFERENTIAL FUSIONGAPS: Price Acceleration)
Indicators:
DeathCrosses ( DX ) and GoldenCrosses ( GX )
Momentum Reversal indicators (D2FG based filter applied to reduce false-positives, but can be manually disabled.)
~ * ~ * ~ * ~ * ~ * ~ * ~ * ~ * ~ * ~ * ~ * ~ * ~ * ~ * ~ * ~ * ~ * ~ * ~ * ~ * ~
Note:
In no way is this intended as a financial/investment/trading advice. You are responsible for your own investment decisions and trades.
Please exercise your own judgement for your own trades base on your own risk-aversion level and goals as an investor or a trader. The use of OTHER indicators and analysis in conjunction (tailored to your own style of investing/trading) will help improve confidence of your analysis, for you to determine your own trade decisions.
~ * ~ * ~ * ~ * ~ * ~ * ~ * ~ * ~ * ~ * ~ * ~ * ~ * ~ * ~ * ~ * ~ * ~ * ~ * ~ * ~
Please check out my other indicators sets and series, e.g.
LIVIDITIUM (dynamic levels),
AEONDRIFT (multi-levels standard deviation bands),
FUSIONGAPS (MA based oscillators),
MAJESTIC (Momentum/Acceleration/Jerk Oscillators),
PRISM (pSAR based oscillator, with RSI/StochRSI as well as Momentum/Acceleration/Jerk indicators),
PDF (parabolic SAR /w HighLow Trends Indicator/Bar-color-marking + Dynamic Fib Retrace and Extension Level)
and more to come.
Constructive feedback and suggestions are welcome.
~ JuniAiko
(=^~^=)v~