Pi Cycle BTC Top + Pre-Alert BandsPi Cycle BTC Top + Pre-Alert Bands is an advanced implementation of the classic Pi Cycle Top model, designed for Bitcoin cycle analysis on higher timeframes (especially 1D BTCUSD/BTCUSD·INDEX).
The original Pi Cycle Top uses two moving averages:
• 111-day SMA (short MA)
• 350-day SMA ×2 (long MA)
A Pi Top is signaled when the 111 SMA crosses above the 350×2 SMA. Historically, this has occurred near major BTC cycle highs.
This script extends that idea with a 3-step early-warning sequence:
• Pi Green – early compression: short/long MA ratio crosses upward into the green band (convergence from below is required).
• Pi Yellow – mid-cycle warning: only fires if a valid Green has already occurred in the same cycle.
• Pi Cycle Top – final top: the classic Pi Cycle cross, limited to one top signal per cycle. After a top, no new Yellow or Top signals can appear until a new Green event starts the next cycle.
Background shading shows the active phase (Green / Yellow / late-cycle zone), so you can see at a glance where BTC is within its Pi-based macro structure.
All logic is non-repainting: request.security() uses lookahead_off and no future data is accessed.
Typical use
This indicator is intended as a macro-cycle timing and risk-awareness tool, not a stand-alone entry system. Many traders use it to:
• Watch for Pi Green as the start of a potential late-cycle advance.
• Treat Pi Yellow as a rising-risk environment and tighten risk management.
• Use the Pi Cycle Top as a historical high-risk zone where large profit-taking or hedging may be considered.
Always combine this with your own analysis (trend, volume, on-chain, macro) before making decisions.
How to set alerts
Add the indicator to your chart (1D BTCUSD or BTCUSD·INDEX recommended).
Click Alerts → Condition → Pi Cycle BTC Top + Pre-Alert Bands.
Choose one of:
• Pi Cycle – Green Pre-Alert (early convergence)
• Pi Cycle – Yellow Pre-Alert (after Green only)
• Pi Cycle – TOP (Single per Cycle, after Green)
Use “Once per bar close” for higher-timeframe reliability.
Disclaimer
This tool is for educational and analytical purposes only. The Pi Cycle concept is based on historical behavior and does not guarantee future results. This is not financial advice; always do your own research and manage risk appropriately.
Movingaveragestrategy

5 EMA STRATEGY by Power of Stocks(StockYogi)5 EMA STRATEGY by Power of Stocks(StockYogi)
This is a 5 EMA Breakout Strategy inspired by the trading principles taught by Shubhashi Pani, founder of the Power of Stocks (POS) community.
The strategy is designed to:
• Detect breakout setups when price breaks the high/low of a signal candle (based on EMA conditions)
• Enter trades only if the breakout occurs within the next 3 candles
• Allow multiple trades in the same direction without closing the earlier one
• Use independent stop-loss (SL) and take-profit (TP) targets for each trade based on a user-defined risk-reward ratio
• Optionally enter trades only at candle close
• Optionally avoid trades during a custom time window (e.g., 3:00 PM to 3:30 PM IST)
• Optionally close all open positions at a defined time (e.g., 3:30 PM IST)
The goal of this strategy is to provide greater flexibility and realism for intraday or short-term traders following structured breakout systems.
Disclaimer: This script is an implementation of technical ideas for educational purposes only. It is not financial advice. All trading involves risk, and past performance does not guarantee future results.
Strategy Credits:
This strategy is based on publicly known breakout rules taught by Shubhashi Pani (Power of Stocks). This is not an official POS script, and I am not affiliated with the Power of Stocks team. This implementation was developed independently to follow the logic shared for educational use.
Feel free to use, backtest, and modify according to your needs. Constructive feedback is welcome!

Kaufman Trend Strength Signal█ Overview
Kaufman Trend Strength Signal is an advanced trend detection tool that decomposes price action into its underlying directional trend and localized oscillation using a vector-based Kalman Filter.
By integrating adaptive smoothing and dynamic weighting via a weighted moving average (WMA), this indicator provides real-time insight into both trend direction and trend strength — something standard moving averages often fail to capture.
The core model assumes that observed price consists of two components:
(1) a directional trend, and
(2) localized noise or oscillation.
Using a two-step Predict & Update cycle, the filter continuously refines its trend estimate as new market data becomes available.
█ How It Works
This indicator employs a Kalman Filter model that separates the trend from short-term fluctuations in a price series.
Predict & Update Cycle : With each new bar, the filter predicts the price state and updates that prediction using the latest observed price, producing a smooth but adaptive trend line.
Trend Strength Normalization : Internally, the oscillator component is normalized against recent values (N periods) to calculate a trend strength score between -100 and +100.
(Note: The oscillator is not plotted on the chart but is used for signal generation.)
Filtered MA Line : The trend component is plotted as a smooth Kalman Filter-based moving average (MA) line on the main chart.
Threshold Cross Signals : When the internal trend strength crosses a user-defined threshold (default: ±60), visual entry arrows are displayed to signal momentum shifts.
█ Key Features
Adaptive Trend Estimation : Real-time filtering that adjusts dynamically to market changes.
Visual Buy/Sell Signals : Entry arrows appear when the trend strength crosses above or below the configured threshold.
Built-in Range Filter : The MA line turns blue when trend strength is weak (|value| < 10), helping you filter out choppy, sideways conditions.
█ How to Use
Trend Detection :
• Green MA = bullish trend
• Red MA = bearish trend
• Blue MA = no trend / ranging market
Entry Signals :
• Green triangle = trend strength crossed above +Threshold → potential bullish entry
• Red triangle = trend strength crossed below -Threshold → potential bearish entry
█ Settings
Entry Threshold : Level at which the trend strength triggers entry signals (default: 60)
Process Noise 1 & 2 : Control the filter’s responsiveness to recent price action. Higher = more reactive; lower = smoother.
Measurement Noise : Sets how much the filter "trusts" price data. High = smoother MA, low = faster response but more noise.
Trend Lookback (N2) : Number of bars used to normalize trend strength. Lower = more sensitive; higher = more stable.
Trend Smoothness (R2) : WMA smoothing applied to the trend strength calculation.
█ Visual Guide
Green MA Line → Bullish trend
Red MA Line → Bearish trend
Blue MA Line → Sideways/range
Green Triangle → Entry signal (trend strengthening)
Red Triangle → Entry signal (trend weakening)
█ Best Practices
In high-volatility conditions, increase Measurement Noise to reduce false signals.
Combine with other indicators (e.g., RSI, MACD, EMA) for confirmation and filtering.
Adjust "Entry Threshold" and noise settings depending on your timeframe and trading style.
❗ Disclaimer
This script is provided for educational purposes only and should not be considered financial advice or a recommendation to buy/sell any asset.
Trading involves risk. Past performance does not guarantee future results.
Always perform your own analysis and use proper risk management when trading.

AllMA Trend Radar [trade_lexx]📈 AllMA Trend Radar is your universal trend analysis tool!
📊 What is AllMA Trend Radar?
AllMA Trend Radar is a powerful indicator that uses various types of Moving Averages (MA) to analyze trends and generate trading signals. The indicator allows you to choose from more than 30 different types of moving averages and adjust their parameters to suit your trading style.
💡 The main components of the indicator
📈 Fast and slow moving averages
The indicator uses two main lines:
- Fast MA (blue line): reacts faster to price changes
- Slow MA (red line): smoother, reflects a long-term trend
The combined use of fast and slow MA allows you to get trend confirmation and entry/exit points from the market.
🔄 Wide range of moving averages
There are more than 30 types of moving averages at your disposal:
- SMA: Simple moving average
- EMA: Exponential moving average
- WMA: Weighted moving average
- DEMA: double exponential MA
- TEMA: triple exponential MA
- HMA: Hull Moving Average
- LSMA: Moving average of least squares
- JMA: Eureka Moving Average
- ALMA: Arnaud Legoux Moving Average
- ZLEMA: moving average with zero delay
- And many others!
🔍 Indicator signals
1️⃣ Fast 🆚 Slow MA signals (intersection and ratio of fast and slow MA)
Up/Down signals (intersection)
- Buy (Up) signal:
- What happens: the fast MA crosses the slow MA from bottom to top
- What does the green triangle with the "Buy" label under the candle look
like - What does it mean: a likely upward trend reversal or an uptrend strengthening
- Sell signal (Down):
- What happens: the fast MA crosses the slow MA from top to bottom
- What does it look like: a red triangle with a "Sell" mark above the candle
- What does it mean: a likely downtrend reversal or an increase in the downtrend
Greater/Less signals (ratio)
- Buy signal (Greater):
- What happens: the fast MA becomes higher than the slow MA
- What does it look like: a green triangle with a "Buy" label under the candle
- What does it mean: the formation or confirmation of an uptrend
- Sell signal (Less):
- What happens: the fast MA becomes lower than the slow MA
- What does it look like: a red triangle with a "Sell" mark above the candle
- What does it mean: the formation or confirmation of a downtrend
2️⃣ Signals ⚡️ Fast MA (fast MA and price)
Up/Down signals (intersection)
- Buy signal (Up Fast):
- What happens: the price crosses the fast MA from bottom to top
- What does it look like: a green triangle with a "Buy" label under the candle
- What does it mean: a short-term price growth signal
- Sell signal (Down Fast):
- What happens: the price crosses the fast MA from top to bottom
- What does it look like: a red triangle with a "Sell" label above the candle
- What does it mean: a short-term price drop signal
Greater/Less signals (ratio)
- Buy signal (Greater Fast):
- What happens: the price is getting higher than the fast MA
- What does it look like: a green triangle with a "Buy" label under the candle
- What does it mean: the price is above the fast MA, which indicates an upward movement
- Sell signal (Less Fast):
- What happens: the price is getting lower than the fast MA
- What does it look like: a red triangle with a "Sell" mark above the candle
- What does it mean: the price is under the fast MA, which indicates a downward movement
3️⃣ Signals 🐢 Slow MA (slow MA and price)
Up/Down signals (intersection)
- Buy signal (Up Slow):
- What happens: the price crosses the slow MA from bottom to top
- What does it look like: a green triangle with a "Buy" label under the candle
- What does it mean: a potential medium-term upward trend reversal
- Sell signal (Down Slow):
- What happens: the price crosses the slow MA from top to bottom
- What does it look like: a red triangle with a "Sell" label above the candle
- What does it mean: a potential medium-term downward trend reversal
Greater/Less signals (ratio)
- Buy signal (Greater Slow):
- What happens: the price is getting above the slow MA
- What does it look like: a green triangle with a "Buy" label under the candle
- What does it mean: the price is above the slow MA, which indicates a strong upward movement
- Sell signal (Less Slow):
- What is happening: the price is getting below the slow MA
- What does it look like: a red triangle with a "Sell" mark above the candle
- What does it mean: the price is under the slow MA, which indicates a strong downward movement
🛠 Filters to filter out false signals
1️⃣ Minimum distance between the signals
- What it does: sets the minimum number of candles between signals of the same type
- Why it is needed: it prevents the appearance of too frequent signals, especially during periods of high volatility
- How to set it up: Set a different value for each signal type (default: 3-5 bars)
- Example: if the value is 3 for Up/Down signals, after the buy signal appears, the next buy signal may appear no earlier than 3 bars later
2️⃣ Advanced indicator filters
🔍 RSI Filter
- What it does: Checks the Relative Strength Index (RSI) value before generating a signal
- Why it is needed: it helps to avoid countertrend entries and catch reversal points
- How to set up:
- For buy signals (🔋 Buy): set the RSI range, usually in the oversold zone (for example, 1-30)
- For sell signals (🪫 Sell): set the RSI range, usually in the overbought zone (for example, 70-100)
- Example: if the RSI = 25 (in the range 1-30), the buy signal will be confirmed
📊 MFI Filter (Cash Flow Index)
- What it does: analyzes volumes and the direction of price movement
- Why it is needed: confirms signals with data on the activity of cash flows
- How to set up:
- For buy signals (🔋 Buy): set the MFI range in the oversold zone (for example, 1-25)
- For sell signals (🪫 Sell): set the MFI range in the overbought zone (for example, 75-100)
- Example: if MFI = 80 (in the range of 75-100), the sell signal will be confirmed
📈 Stochastic Filter
- What it does: analyzes the position of the current price relative to the price range
- Why it is needed: confirms signals based on overbought/oversold conditions
- How to configure:
- You can configure the K Length, D Length and Smoothing parameters
- For buy signals (🔋 Buy): set the stochastic range in the oversold zone (for example, 1-20)
- For sell signals (🪫 Sell): set the stochastic range in the overbought zone (for example, 80-100)
- Example: if stochastic = 15 (is in the range of 1-20), the buy signal will be confirmed
🔌 Connecting to trading strategies
The indicator provides various connectors to connect to your trading strategies.:
1️⃣ Individual connectors for each type of signal
- 🔌Fast vs Slow Up/Down MA Signal🔌: signals for the intersection of fast and slow MA
- 🔌Fast vs Slow Greater/Less MA Signal🔌: signals of the ratio of fast and slow MA
- 🔌Fast Up/Down MA Signal🔌: signals of the intersection of price and fast MA
- 🔌Fast Greater/Less MA Signal🔌: signals of the ratio of price and fast MA
- 🔌Slow Up/Down MA Signal🔌: signals of the intersection of price and slow MA
- 🔌Slow Greater/Less MA Signal🔌: Price versus slow MA signals
2️⃣ Combined connectors
- 🔌Combined Up/Down MA Signal🔌: combines all the crossing signals (Up/Down)
- 🔌Combined Greater/Less MA Signal🔌: combines all the signals of the ratio (Greater/Less)
- 🔌Combined All MA Signals🔌: combines all signals (Up/Down and Greater/Less)
❗️ All connectors return values:
- 1: buy signal
- -1: sell signal
- 0: no signal
📚 How to start using AllMA Trend Radar
1️⃣ Selection of types of moving averages
- Add an indicator to the chart
- Select the type and period for the fast MA (default: DEMA with a period of 14)
- Select the type and period for the slow MA (default: SMA with a period of 14)
- Experiment with different types of MA to find the best combination for your trading style
2️⃣ Signal settings
- Turn on the desired signal types (Up/Down, Greater/Less)
- Set the minimum distance between the signals
- Activate and configure the necessary filters (RSI, MFI, Stochastic)
3️⃣ Checking on historical data
- Analyze how the indicator works based on historical data
- Pay attention to the accuracy of the signals and the presence of false alarms
- Adjust the settings if necessary
4️⃣ Introduction to the trading strategy
- Decide which signals will be used to enter the position.
- Determine which signals will be used to exit the position.
- Connect the indicator to your trading strategy through the appropriate connectors
🌟 Practical application examples
Scalping strategy
- Fast MA: TEMA with a period of 8
- Slow MA: EMA with a period of 21
- Active signals: Fast MA Up/Down
- Filters: RSI (range 1-40 for purchases, 60-100 for sales)
- Signal spacing: 3 bars
Strategy for day trading
- Fast MA: TEMA with a period of 10
- Slow MA: SMA with a period of 20
- Active signals: Fast MA Up/Down and Fast vs Slow Greater/Less
- Filters: MFI (range 1-25 for purchases, 75-100 for sales)
- Signal spacing: 5 bars
Swing Trading Strategy
- Fast MA: DEMA with a period of 14
- Slow MA: VWMA with a period of 30
- Active signals: Fast vs Slow Up/Down and Slow MA Greater/Less
- Filters: Stochastic (range 1-20 for purchases, 80-100 for sales)
- Signal spacing: 8 bars
A strategy for positional trading
- Fast MA: HMA with a period of 21
- Slow MA: SMA with a period of 50
- Active signals: Slow MA Up/Down and Fast vs Slow Greater/Less
- Filters: RSI and MFI at the same time
- The distance between the signals: 10 bars
💡 Tips for using AllMA Trend Radar
1. Select the types of MA for market conditions:
- For trending markets: DEMA, TEMA, HMA (fast MA)
- For sideways markets: SMA, WMA, VWMA (smoothed MA)
- For volatile markets: KAMA, AMA, VAMA (adaptive MA)
2. Combine different types of signals:
- Up/Down signals work better when moving from a sideways trend to a directional
one - Greater/Less signals are optimal for fixing a stable trend
3. Use filters effectively:
- The RSI filter works great in trending markets
- MFI filter helps to confirm the strength of volume movement
- Stochastic filter works well in lateral ranges
4. Adjust the minimum distance between the signals:
- Small values (2-3 bars) for short-term trading
- Average values (5-8 bars) for medium-term trading
- Large values (10+ bars) for long-term trading
5. Use combination connectors:
- For more reliable signals, connect the indicator through the combined connectors
💰 With the AllMA Trend Radar indicator, you get a universal trend analysis tool that can be customized for any trading style and timeframe. The combination of different types of moving averages and advanced filters allows you to significantly improve the accuracy of signals and the effectiveness of your trading strategy!

Multiple MAsHere's a well-written description in English for your "Multiple MAs" indicator that you can use when publishing on TradingView. It’s concise, professional, and highlights the key features of the indicator while explaining its purpose for traders.
---
### Multiple MAs Indicator
#### Overview
The **Multiple MAs** indicator is a versatile and straightforward tool designed to help traders visualize price trends using multiple Simple Moving Averages (SMAs) on a single chart. By plotting six SMAs with customizable lengths (MA5, MA10, MA20, MA50, MA100, and MA200), this indicator provides a clear view of short-term, medium-term, and long-term trends, making it ideal for trend-following strategies, crossover analysis, and identifying potential support/resistance levels.
#### Features
- **Customizable MA Lengths**: Adjust the periods of all six moving averages (MA5, MA10, MA20, MA50, MA100, MA200) to suit your trading style and timeframe.
- **Distinct Visuals**: Each MA is plotted with a unique color and line width for easy identification:
- MA5 (Dodger Blue, 1px)
- MA10 (Green, 1px)
- MA20 (Red, 2px)
- MA50 (Purple, 3px)
- MA100 (Gray, 3px)
- MA200 (White, 3px)
- **Overlay on Price Chart**: The indicator overlays directly on the price chart, allowing for seamless integration with other technical analysis tools.
- **High Precision**: Displays values with 8-decimal precision, ensuring accuracy for assets with small price movements (e.g., forex pairs or cryptocurrencies).
#### How to Use
1. **Trend Identification**: Use the longer MAs (e.g., MA100, MA200) to determine the overall trend direction. If the price is above these MAs, the trend is likely bullish; if below, it’s likely bearish.
2. **Crossover Signals**: Look for crossovers between shorter MAs (e.g., MA5 crossing MA20) for potential entry or exit signals. For example:
- A bullish signal occurs when a shorter MA crosses above a longer MA.
- A bearish signal occurs when a shorter MA crosses below a longer MA.
3. **Support and Resistance**: MAs often act as dynamic support or resistance levels. Watch for price reactions around these lines, especially the MA50, MA100, and MA200.
4. **Divergence Analysis**: Compare the slope of different MAs to identify potential trend reversals or weakening momentum.
#### Settings
- **MA5 Length**: Default is 5 bars.
- **MA10 Length**: Default is 10 bars.
- **MA20 Length**: Default is 20 bars.
- **MA50 Length**: Default is 50 bars.
- **MA100 Length**: Default is 100 bars.
- **MA200 Length**: Default is 200 bars.
#### Best Practices
- **Timeframe**: This indicator works on any timeframe but is particularly effective on daily, 4-hour, and 1-hour charts for swing trading or trend-following strategies.
- **Combine with Other Tools**: Pair the Multiple MAs with other indicators like RSI, MACD, or volume analysis to confirm signals and avoid false breakouts.
- **Adjust for Volatility**: For highly volatile assets, consider increasing the MA lengths to reduce noise and focus on broader trends.
#### Notes
- The indicator is lightweight and optimized for performance, ensuring it runs smoothly even on lower timeframes.
- Colors and line widths are pre-set for clarity but can be customized in the indicator settings if needed.
#### Credits
Created by kosar_v. Feedback and suggestions are welcome to improve this tool for the TradingView community!

TEMA OBOS Strategy PakunTEMA OBOS Strategy
Overview
This strategy combines a trend-following approach using the Triple Exponential Moving Average (TEMA) with Overbought/Oversold (OBOS) indicator filtering.
By utilizing TEMA crossovers to determine trend direction and OBOS as a filter, it aims to improve entry precision.
This strategy can be applied to markets such as Forex, Stocks, and Crypto, and is particularly designed for mid-term timeframes (5-minute to 1-hour charts).
Strategy Objectives
Identify trend direction using TEMA
Use OBOS to filter out overbought/oversold conditions
Implement ATR-based dynamic risk management
Key Features
1. Trend Analysis Using TEMA
Uses crossover of short-term EMA (ema3) and long-term EMA (ema4) to determine entries.
ema4 acts as the primary trend filter.
2. Overbought/Oversold (OBOS) Filtering
Long Entry Condition: up > down (bullish trend confirmed)
Short Entry Condition: up < down (bearish trend confirmed)
Reduces unnecessary trades by filtering extreme market conditions.
3. ATR-Based Take Profit (TP) & Stop Loss (SL)
Adjustable ATR multiplier for TP/SL
Default settings:
TP = ATR × 5
SL = ATR × 2
Fully customizable risk parameters.
4. Customizable Parameters
TEMA Length (for trend calculation)
OBOS Length (for overbought/oversold detection)
Take Profit Multiplier
Stop Loss Multiplier
EMA Display (Enable/Disable TEMA lines)
Bar Color Change (Enable/Disable candle coloring)
Trading Rules
Long Entry (Buy Entry)
ema3 crosses above ema4 (Golden Cross)
OBOS indicator confirms up > down (bullish trend)
Execute a buy position
Short Entry (Sell Entry)
ema3 crosses below ema4 (Death Cross)
OBOS indicator confirms up < down (bearish trend)
Execute a sell position
Take Profit (TP)
Entry Price + (ATR × TP Multiplier) (Default: 5)
Stop Loss (SL)
Entry Price - (ATR × SL Multiplier) (Default: 2)
TP/SL settings are fully customizable to fine-tune risk management.
Risk Management Parameters
This strategy emphasizes proper position sizing and risk control to balance risk and return.
Trading Parameters & Considerations
Initial Account Balance: $7,000 (adjustable)
Base Currency: USD
Order Size: 10,000 USD
Pyramiding: 1
Trading Fees: $0.94 per trade
Long Position Margin: 50%
Short Position Margin: 50%
Total Trades (M5 Timeframe): 128
Deep Test Results (2024/11/01 - 2025/02/24)BTCUSD-5M
Total P&L:+1638.20USD
Max equity drawdown:694.78USD
Total trades:128
Profitable trades:44.53
Profit factor:1.45
These settings aim to protect capital while maintaining a balanced risk-reward approach.
Visual Support
TEMA Lines (Three EMAs)
Trend direction is indicated by color changes (Blue/Orange)
ema3 (short-term) and ema4 (long-term) crossover signals potential entries
OBOS Histogram
Green → Strong buying pressure
Red → Strong selling pressure
Blue → Possible trend reversal
Entry & Exit Markers
Blue Arrow → Long Entry Signal
Red Arrow → Short Entry Signal
Take Profit / Stop Loss levels displayed
Strategy Improvements & Uniqueness
This strategy is based on indicators developed by "l_lonthoff" and "jdmonto0", but has been significantly optimized for better entry accuracy, visual clarity, and risk management.
Enhanced Trend Identification with TEMA
Detects early trend reversals using ema3 & ema4 crossover
Reduces market noise for a smoother trend-following approach
Improved OBOS Filtering
Prevents excessive trading
Reduces unnecessary risk exposure
Dynamic Risk Management with ATR-Based TP/SL
Not a fixed value → TP/SL adjusts to market volatility
Fully customizable ATR multiplier settings
(Default: TP = ATR × 5, SL = ATR × 2)
Summary
The TEMA + OBOS Strategy is a simple yet powerful trading method that integrates trend analysis and oscillators.
TEMA for trend identification
OBOS for noise reduction & overbought/oversold filtering
ATR-based TP/SL settings for dynamic risk management
Before using this strategy, ensure thorough backtesting and demo trading to fine-tune parameters according to your trading style.

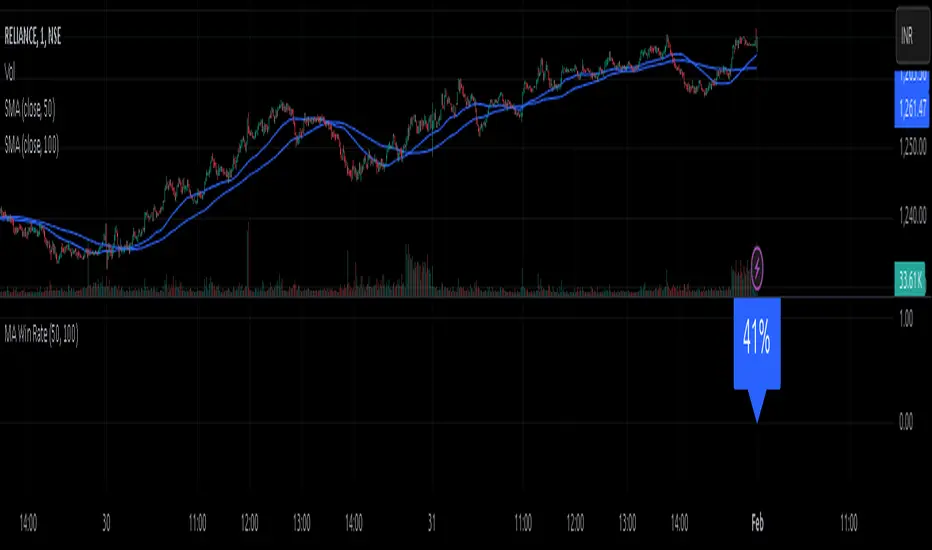
MA Win RateMoving Average Cross Win Rate
This simple yet useful script calculates the percentage of times a moving average crossover successfully predicts price movement.
Win Conditions:
1] A Golden Cross (fast MA crossing above slow MA) where the price moves up afterward.
2] A Death Cross (fast MA crossing below slow MA) where the price moves down afterward.
In this script, I have used a Simple Moving Average (SMA) for illustration.
You can modify the code to apply any type of moving average and test its accuracy.
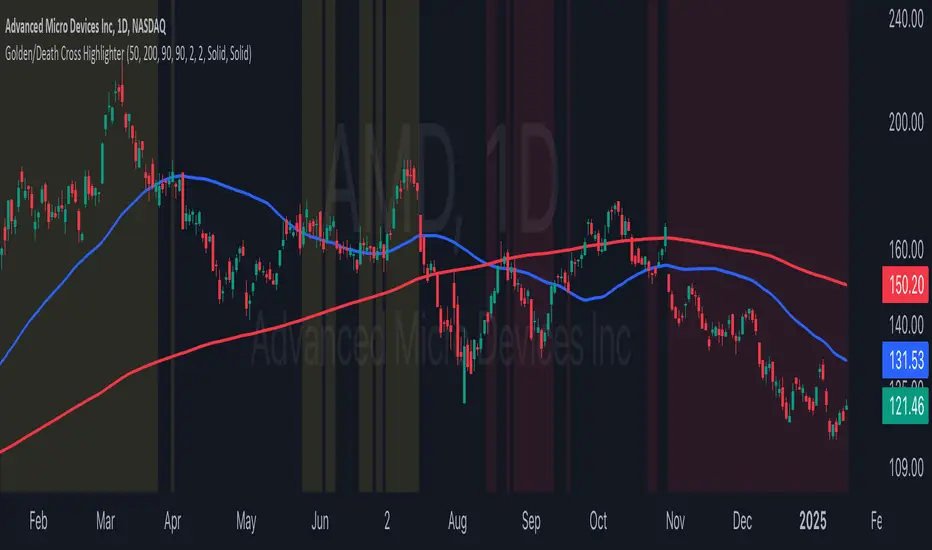
Golden/Death Cross HighlighterThis indicator helps you easily identify and visualize Golden Cross and Death Cross patterns combined with price action confirmation. It highlights chart backgrounds when specific conditions are met, making it easy to spot potential trend changes.
🔑 Key Features:
Highlights Golden Cross conditions (50 SMA crosses above 200 SMA) when price closes above both MAs
Highlights Death Cross conditions (50 SMA crosses below 200 SMA) when price closes below both MAs
Customizable MA lengths (default: 50 and 200)
Adjustable highlight opacity
Built-in alerts for cross events
Clear visualization of both moving averages
📈 Color Guide:
Yellow Background: Golden Cross active + price above both MAs
Red Background: Death Cross active + price below both MAs
⚙️ Settings:
Fast MA Length: Length of faster moving average (default 50)
Slow MA Length: Length of slower moving average (default 200)
Golden Cross Highlight Opacity: Adjust visibility of bullish highlights
Death Cross Highlight Opacity: Adjust visibility of bearish highlights
💡 Usage Tips:
Use in combination with other indicators for confirmation
Set up alerts for potential trend changes
Adjust opacity to match your chart style
Works best on higher timeframes (4H, Daily, Weekly)
Johnny's Adjusted BB Buy/Sell Signal"Johnny's Adjusted BB Buy/Sell Signal" leverages Bollinger Bands and moving averages to provide dynamic buy and sell signals based on market conditions. This indicator is particularly useful for traders looking to identify strategic entry and exit points based on volatility and trend analysis.
How It Works
Bollinger Bands Setup: The indicator calculates Bollinger Bands using a specified length and multiplier. These bands serve to identify potential overbought (upper band) or oversold (lower band) conditions.
Moving Averages: Two moving averages are calculated — a trend moving average (trendMA) and a long-term moving average (longTermMA) — to gauge the market's direction over different time frames.
Market Phase Determination: The script classifies the market into bullish or bearish phases based on the relationship of the closing price to the long-term moving average.
Strong Buy and Sell Signals: Enhanced signals are generated based on how significantly the price deviates from the Bollinger Bands, coupled with the average candle size over a specified lookback period. The signals are adjusted based on whether the market is bullish or bearish:
In bullish markets, a strong buy signal is triggered if the price significantly drops below the lower Bollinger Band. Conversely, a strong sell signal is activated when the price rises well above the upper band.
In bearish markets, these signals are modified to be more conservative, adjusting the thresholds for triggering strong buy and sell signals.
Features:
Flexibility: Users can adjust the length of the Bollinger Bands and moving averages, as well as the multipliers and factors that determine the strength of buy and sell signals, making it highly customizable to different trading styles and market conditions.
Visual Aids: The script vividly plots the Bollinger Bands and moving averages, and signals are visually represented on the chart, allowing traders to quickly assess trading opportunities:
Regular buy and sell signals are indicated by simple shapes below or above price bars.
Strong buy and sell signals are highlighted with distinctive colors and placed prominently to catch the trader's attention.
Background Coloring: The background color changes based on the market phase, providing an immediate visual cue of the market's overall sentiment.
Usage:
This indicator is ideal for traders who rely on technical analysis to guide their trading decisions. By integrating both Bollinger Bands and moving averages, it provides a multi-faceted view of market trends and volatility, making it suitable for identifying potential reversals and continuation patterns. Traders can use this tool to enhance their understanding of market dynamics and refine their trading strategies accordingly.

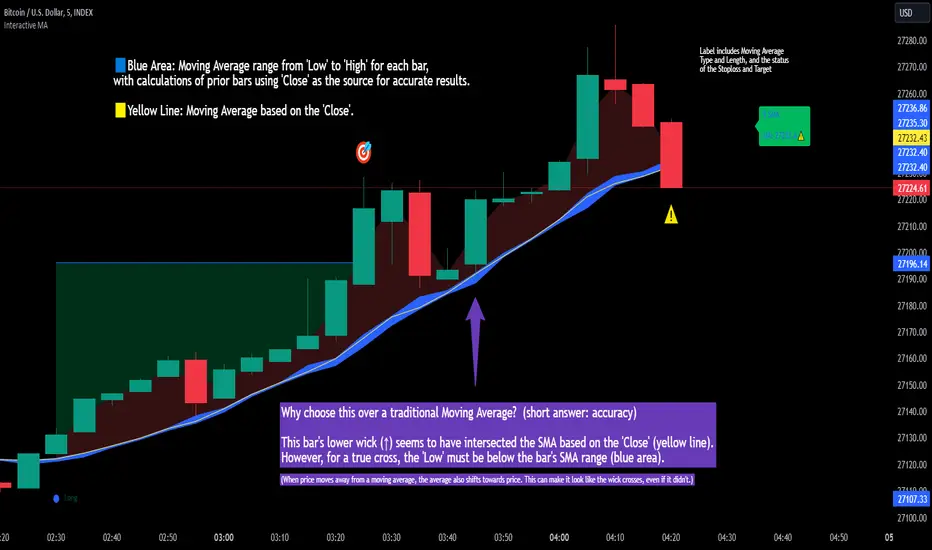
Interactive MA Stop Loss [TANHEF]This indicator is "Interactive." Once added to the chart, you need to click the start point for the moving average stoploss. Dragging it afterward will modify its position.
Why choose this indicator over a traditional Moving Average?
To accurately determine that a wick has crossed a moving average, you must examine the moving average's range on that bar (blue area on this indicator) and ensure the wick fully traverses this area.
When the price moves away from a moving average, the average also shifts towards the price. This can make it look like the wick crossed the average, even if it didn't.
How is the moving average area calculated?
For each bar, the moving average calculation is standard, but when the current bar is involved, its high or low is used instead of the close. For precise results, simply setting the source in a typical moving average calculation to 'Low' or 'High' is not sufficient in calculating the moving average area on a current bar.
Moving Average Options:
Simple Moving Average
Exponential Moving Average
Relative Moving Average
Weighted Moving Average
Indicator Explanation
After adding indicator to chart, you must click on a location to begin an entry.
The moving average type can be set and length modified to adjust the stoploss. An optional profit target may be added.
A symbol is display when the stoploss and profit target are hit. If a position is create that is not valid, "Overlapping MA and Bar" is displayed.
Alerts
'Check' alerts to use within indicator settings (stop hit and/or profit target hit).
Select 'Create Alert'
Set the condition to 'Interactive MA''
Select create.
Alert messages can have additional details using these words in between two Curly (Brace) Brackets:
{{stop}} = MA stop-loss (price)
{{upper}} = Upper MA band (price)
{{lower}} = Lower MA band (price)
{{band}} = Lower or Upper stoploss (word)
{{type}} = Long or Short stop-loss (word)
{{stopdistance}} = Stoploss Distance (%)
{{targetdistance}} = Target Distance (%)
{{starttime}} = Start time of stoploss (day:hour:minute)
{{maLength}} = MA Length (input)
{{maType}} = MA Type (input)
{{target}} = Price target (price)
{{trigger}} = Wick or Close Trigger input (input)
{{ticker}} = Ticker of chart (word)
{{exchange}} = Exchange of chart (word)
{{description}} = Description of ticker (words)
{{close}} = Bar close (price)
{{open}} = Bar open (price)
{{high}} = Bar high (price)
{{low}} = Bar low (price)
{{hl2}} = Bar HL2 (price)
{{volume}} = Bar volume (value)
{{time}} = Current time (day:hour:minute)
{{interval}} = Chart timeframe
{{newline}} = New line for text
I will add further moving averages types in the future. If you suggestions post them below.
ETH MA ChannelThe 200-week moving average for bitcoin is considered to be the most popular bitcoin support and determines the bitcoin price bottom. But examining this index in the case of bitcoin does not have the same result for Ethereum. The above moving average channel is designed according to the price action of ETH to determine its top and bottom based on the 200w moving average. This channel has a good performance on the historical chart.
