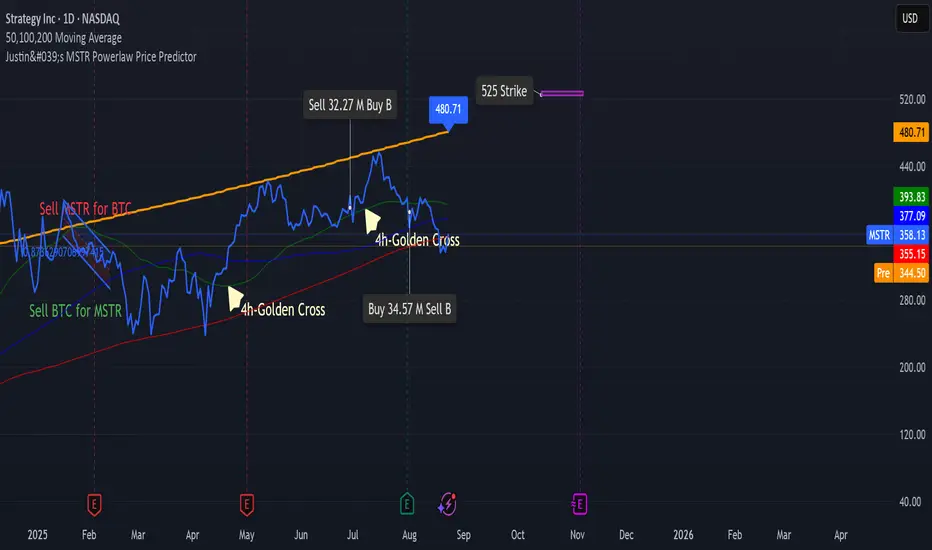
Justin's Bitcoin Power Law PredictorJustin's MSTR Powerlaw Price Predictor is a Pine Script v6 indicator for TradingView that adapts Giovanni Santostasi’s Bitcoin power law model to forecast MicroStrategy (MSTR) stock prices. Using the formula Price = A * (daysSinceGenesis)^B, it calculates fair, upper, and floor prices with constants A_fair = 1.16e-17, A_floor = 0.42e-17, and B = 5.82, starting from Bitcoin’s genesis (January 3, 2009). The script plots these prices, displays values in a table.
Source: www.ccn.com
MSTR

Justin's MSTR Powerlaw Price PredictorJustin's MSTR Powerlaw Price Predictor is a Pine Script v6 indicator for TradingView that adapts Giovanni Santostasi’s Bitcoin power law model to forecast MicroStrategy (MSTR) stock prices. The price prediction is based on the the formula published in this article:
www.ccn.com
M2 Liqudity WaveGlobal Liquidity Wave Indicator (M2-Based)
The Global Liquidity Wave Indicator is designed to track and visualize the impact of global M2 liquidity on risk assets—especially those highly correlated to monetary expansion, like Bitcoin, MSTR, and other macro-sensitive equities.
Key features include:
Leading Signal: Historically leads Bitcoin price action by approximately 70 days, offering traders and analysts a forward-looking edge.
Wave-Based Projection: Visualizes a "probability cloud"—a smoothed band representing the most likely trajectory for Bitcoin based on changes in global liquidity.
Min/Max Offset Controls: Adjustable offsets let you define the range of lookahead windows to shape the wave and better capture liquidity-driven inflection points.
Explicit Offset Visualization: Option to manually specify an exact offset to fine-tune the overlay, ideal for testing hypotheses or aligning with macro narratives.
Macro Alignment: Particularly effective for assets with high sensitivity to global monetary policy and liquidity cycles.
This tool is not just a chart overlay—it's a lens into the liquidity engine behind the market, helping anticipate directional bias in advance of price moves.
How to use?
- Enable the indicator for BTCUSD.
- Set Offset Range Start and End to 70 and 115 days
- Set Specific Offset to 78 days (this can change so you'll need to play around)
FAQ
Why a global liquidity wave?
The global liquidity wave accounts for variability in how much global liquidity affects an underlying asset. Think of the Global Liquidity Wave as an area that tracks the most probable path of Bitcoin, MSTR, etc. based on the total global liquidity.
Why the offset?
Global liquidity takes time to make its way into assets such as #Bitcoin, Strategy, etc. and there can be many reasons for that. It's never a specific number of days of offset, which is why a global liquidity wave is helpful in tracking probable paths for highly correlated risk assets.

MicroStrategy Bitcoin Premium v2 [Kendrick_Chan]In 2020, MicroStrategy, under the leadership of CEO Michael Saylor, began purchasing large amounts of Bitcoin to hedge against inflation and diversify its corporate treasury. This move transformed MicroStrategy into one of the largest corporate holders of Bitcoin, with the company continually increasing its holdings through additional purchases funded by issuing new shares and convertible bonds.
The MicroStrategy Bitcoin Premium indicator is a dynamic tool that underscores the enthusiasm of equity market investors to gain Bitcoin exposure through MicroStrategy's (MSTR) stock. This indicator measures the premium investors are willing to pay for MSTR shares relative to the company's Bitcoin and cash holdings, reflecting the traditional market's eagerness to hold Bitcoin indirectly.
How Does It Work:
When MicroStrategy issues convertible bonds, cash level increases and all CB are assumed to convert to stocks diluting the shares.
In case of sales of MSTR new shares, cash level increases and diluted shares are adjusted tentatively before the quarterly financial reports.
In the event of Bitcoin purchases, the Bitcoins holding increases while cash level decreases.
Premium = Assumed Diluted Market Cap / ( Bitcoins Value + Cash and Cash Equivalents ) - 100%
How To Use:
By understanding and utilizing the MicroStrategy Bitcoin Premium indicator, traders and investors can make more informed decisions, whether they are swing trading MSTR, gauging Bitcoin demand, or seeking arbitrage opportunities.
1. MSTR Swing Traders
Swing traders can leverage the indicator to identify potential MSTR entry and exit points based on the overbought or oversold conditions of the stock.
2. Bitcoin Investors and Traders
The premium indicator can serve Bitcoin investors as a proxy for gauging overall market demand. A high premium indicates strong demand for Bitcoin exposure through MSTR, reflecting broader market enthusiasm for Bitcoin. A low premium suggests reduced demand.
Bitcoin traders may also anticipate the Bitcoin demand driven by MicroStrategy:
a) Shen the premium is high, MicroStrategy could issue new shares or convertible bonds to raise funds and buy more Bitcoins.
b) Arbitrageurs might also short sell MSTR and buy the equivalent Bitcoins.
3. MSTR-Bitcoin Arbitrageurs
Arbitrage traders can use the premium indicator to exploit price discrepancies between MSTR stock and Bitcoin. This strategy profits from any convergence between the stock price and the value of the underlying Bitcoin holdings.
The indicator helps identify optimal times to enter and exit arbitrage positions, minimizing risk and maximizing potential returns by capitalizing on market inefficiencies.

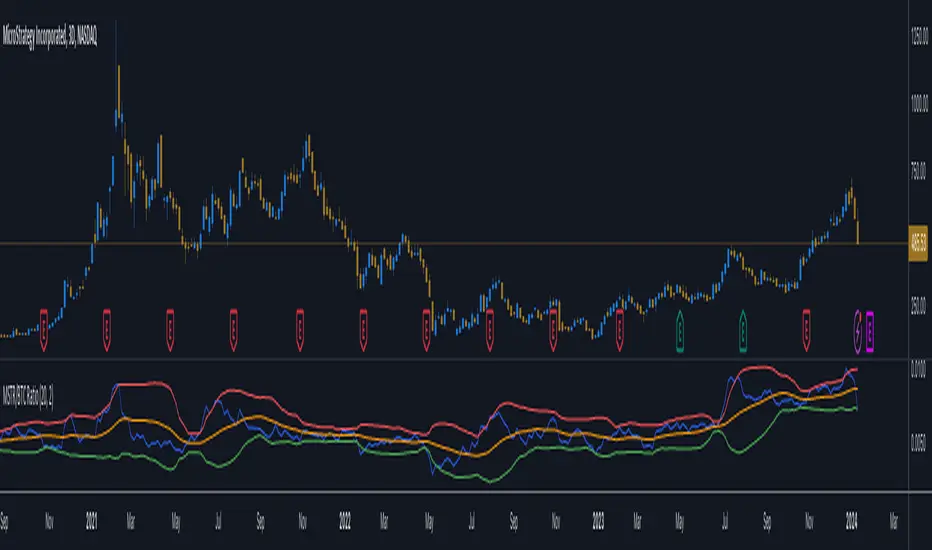
MicroStrategy / Bitcoin Market Cap RatioThis indicator offers a unique analytical perspective by comparing the market capitalization of MicroStrategy (MSTR) with that of Bitcoin (BTC) . Designed for investors and analysts interested in the correlation between MicroStrategy's financial performance and the Bitcoin market, the script calculates and visualizes the ratio of MSTR's market capitalization to Bitcoin's market capitalization.
Key Features:
Start Date: The script considers data starting from July 28, 2020, aligning with MicroStrategy's initial announcement to invest in Bitcoin.
Data Sources: It retrieves real-time data for MSTR's total shares outstanding, MSTR's stock price, and BTC's market capitalization.
Market Cap Calculations: The script calculates MicroStrategy's market cap by multiplying its stock price with the total shares outstanding. It then forms a ratio of MSTR's market cap to BTC's market cap.
Bollinger Bands: To add a layer of analysis, the script includes Bollinger Bands around the ratio, with customizable parameters for length and multiplier. These bands can help identify overbought or oversold conditions in the relationship between MSTR's and BTC's market values.
The indicator plots the MSTR/BTC market cap ratio and the Bollinger Bands, providing a clear visual representation of the relationship between these two market values over time.
This indicator is ideal for users who are tracking the impact of Bitcoin's market movements on MicroStrategy's valuation or vice versa. It provides a novel way to visualize and analyze the interconnectedness of a leading cryptocurrency asset and a major corporate investor in the space.
MicroStrategy Software Business Share PriceSimilar to the MicroStrategy Premium script. This indicator derives MSTR's core software business value by calculating its Bitcoin holdings as a percentage of market cap. Thus you can do, (1 - Bitcoin holdings as a % of market cap) * current share price = Core business share price

Micro Strategy PremiumSince the decision to buy 38,250 Bitcoin under their new treasury policy. Micro Strategy has become an easy and tax efficient way for many investors to gain an exposure to Bitcoin.
This script displays:
- Micro Strategy premium vs price of BTCUSD (CME)
- Micro Strategy premium vs price of BTCUSD (CME) minus Nasdaq 100 (QQQ ETF). A straightforward method to detach Micro Strategy’s share price from the overall performance of the US tech sector. This could potentially give you a more accurate premium.
- Micro Strategy’s 38,250 BTC as a percentage of their Market Cap
This script also acknowledges that Micro Strategy should be renamed “Macro Strategy” and that Michael Saylor is a living legend.
