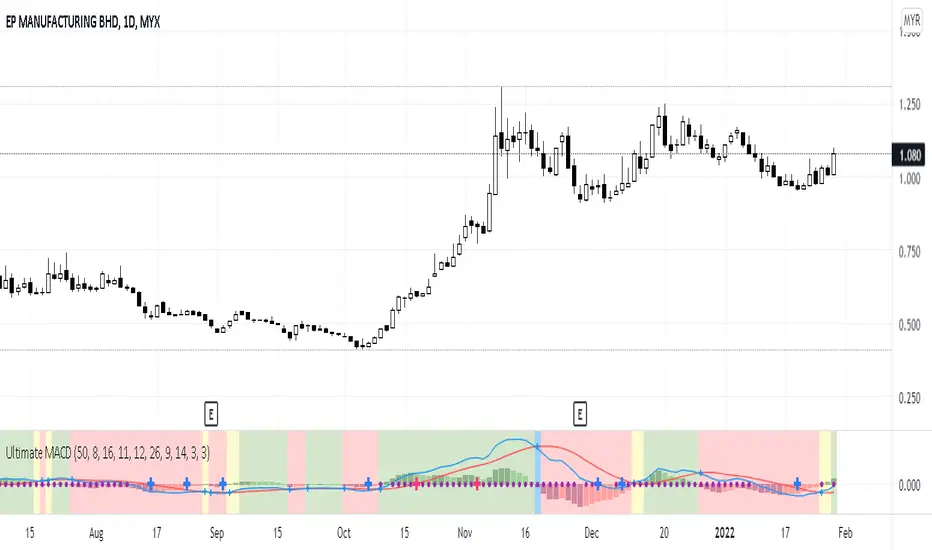
Relative Strength Index of EU and US Stock Index Trends quality//Relative Strength Index of European and US Stock Index Trends quality
//This indicator reveals the relative strength of European and US stock index futures.
//take Bull trend as an example , the current closed price>EMA20 value and the current closed price >20th previous bar closed price( deduction price),
//it's defined as a lower level bull trend .If the current price EMA20>EMA60, it's defined as a higher level bull trend .If the EMA20>EMA60>EMA120,it's defined as the highest level bull trend.
//You can choose to draw the curve with the deviation rate of the original major indexes to 20EMA, or draw the deviation rate with the average value (default value is 5 bars).
//In addition, a more technical method is added to analyze the deviation changes of the major indexes.The deviation rate changing velocity value, parameter tan (abbreviated by t) of 1, 2, 5, 10 is introduced.
//You can have the option of calculate the tan using average value of 5 candlesticks or original value.
//Taking tan1 as an example, it indicates how much the deviation rate between the current price and the previous candlestick has changed.
//The indicator of the index color and the description of the trend quality color can be switched off in option.
//In addition, this code color scheme is only suitable for black background (the code color needs to be changed by yourself if you use white background).
N-macd
RogTrader AlgoA simple BUY/SELL algorithm based on Moving Averages (EMA), MACD, RSI, Stochastic, ADX, ATR, CCI, OBV, Pivot Points, and Parabolic Sar, and Volume averaged.
Simple algo that uses multiples indicator strengths and weight them to generate buy and sell signals
Indicator strengths are displayed on each candle (green is bullish and red is bearish)
Green Buy and Red Sell shall be primarily used for long positions
Bull and Bear Strengths are created based on Price Action, and Volume, the length of the array shows upward or downward strength
Indicators' Signal Strength shows number Indicators' indication for the direction.
Bollinger Bands are in red and green filled
VWAP Bands are in gray, green, and red
Linear Regression is the blue line
Check multiple timeframes.
MACD/EMA Golden CrossThis is a slight modification to the MACD indicator. The golden cross indicator makes use of EMA 7 and EMA 21 as well as MACD together, in which it will turn the MACD line yellow & fill the MACD with a yellow background when MACD is above the signal line and EMA7 is above EMA21. This is best suited for swing trading on a daily timeframe.
My BTST RSI MACD X-BODYMy trial of script base on EMA , RSI and MACD to filter the best Candle which has likely hood of uptrend in a practice of " Buy Today Sell Tomorrow".
Blue candle : 40 to 70 % RSI
Orange candle > 80 % RSI
Yellow candle < 30 % RSI - buy and can hold
Lime candle buy above MACD line.
Also i added the label when 2 EMAs and SMA cross each other in solid body candle.
Buy on Blue, Lime.
Buy and hold on Yellow candle.
Good luck!
NIFTY Money Flow - Scalping/SwingBrief Description About Script
It considers the change of price in the direction
change of price is +Ve then considered as +Ve money flow
-Ve then considered as -Ve money flow
and it multplied by Volume change
This Strategy works best with NIFTY
For Scalping:-
Settings:- 1 Min Candle Time Frame, Length 20
For Swing:-
Setting:- 30 Min Candle Time Frame, Length 11
How to use it?
Common usage:-
Buy - When turns Red to Green Buy by keeping 1.5 * ATR as SL or Trailing SL(Optional) at the same time frame
Sell - When turns Green to Red SL by keeping 1.5 * ATR as SL or Trailing SL(Optional) at the same time frame
Trend reversal:-
Draw Divergence between indicator and price
Buy - Indicator forms Higher Highs(Red Side), Price Lower Lows
Sell - Indicator forms Lower Lows(Green Side), Price Higher Highs
Breakouts:-(Less Accurate compared to other scenarios)
End of Triangel/Box Indicator Turns Red to Green - Bullish Breakout, Green to Red Bearish Breakout
can use for breakouts chart patterns and guess which side it's going to break
can use for reversal as well by observing divergence between price & indicator
Note:-
In the future, an updated version is coming with it auto-generated buy/sell signal on the chart & gives backtesting results as a strategy
RSI/RSX Divergance on chart [Anan]This script points Regular/Hidden Bull/Bear RSI/RSX divergences on the chart.
Options:
-RSI/RSX source
-RSI/RSX length
-Show/hide Regular/hidden Bull/Bear divergences
KMACThis is a heavily modified MACD indicator that includes two different measurements, either regular, or weighted. Weighted is either EMA or KAMA dependent. I personally only use this in certain scenarios but it has proved handy for overall trend as it's slower.
This indicator also has a colorized histogram for the rising/falling of momentum, as well as arrows and crosses to indicate the "death" crosses, "golden" crosses, and falling above/below the "0-Line". 0-Line is embedded into the indicator as well, the user need not worry about drawing it on top of the indicator.
BSKL Short-Term Momentum TradingIndicator to identify the beginning of a Momentum, designed to use for the Malaysian market(I haven't tried it on other markets).
Best to use on 30 minute timeframe. When all criteria is fulfilled, there will be a "^" logo appearing below the candlestick .
Not to be commercialised, feel free to PM me for any improvement or suggestion.
Happy trading.
Divergence of Market Breadth & Price deduction indicatorHow it begin?
Traders and investors use market breadth in order to assess the index’s overall health. Market breadth can be a reliable, if not an accurate, indicator of an upcoming price rise in the index. Similarly, it can also provide early warning signs for a future price decline.
What is it?
market breadth in this case refer to percentage of stocks above 20 Simple Moving Average,which could be used as a barometer for the market.
How it works?
This paticular indicator compare the divergence of Nasdaq 100 and Russell 2000 percentage of stocks above 20 Simple Moving Average.
This indicator also include a deduction price method ,which is inspired from LEI & LoneCapital
RSI and market strength with alerts By combining the true strength of the Nasdaq (NDX) and S&P500 ( SPY ) we can then compare that against the volatility /fear index ( VIX ). The true strength of the Volatility Index ( VIX ) is shown by the red area and the Nasdaq (NDX) and S&P500 ( SPY ) by the silver /teal areas.
The yellow EMA area shows the average difference between the VIX and the NDX/ SPY indexes. When the yellow area crosses above the zero line and is climbing it means that the NDX/ SPY are strengthening. When the yellow area is decreasing or crosses under the zero line it means the fear/volatility index ( VIX ) is becoming stronger and NDX/ SPY are weakening. The RSI is overlaid as a white line to show the correlation of the instrument strength compared to the market.
When looking at charts of companies/components listed on the Nasdaq and/or S&P 500 you will notice a frequent correlation between the movement of the yellow area depicting index health and the RSI of the chart you are viewing. It’s a very quick and effective method of seeing the strength and fear within the market indexes and how they are effecting your chart.
The background color changes when the market strength combined with the active symbol RSI and higher timeframe MACD signals are aligned. Green is a buy zone, Red is a sell zone.
There are also red and green indicator x’s at the top/bottom of the indicator. They show a drastic change in Relative strength within a short period. This often indicates a buy or sell opportunity.
It is tested and works well on all timeframes with Stocks listed on NASDAQ & S&P500 .
Buy, Sell, Exit Buy and Exit Sell alerts are included.
There are also red and green indicator x’s at the top/bottom of the indicator. They show a drastic change in Relative strength within a short period. This often indicates a buy or sell opportunity.
MA MTF Momentum HistogramMy own interpretation indicator which i call multi time frame moving averages momentum with NO LAG EMA support (Optional).
The indicator is calculated by subtracting the long-term EMA from the short-term EMA .
This pretty much resembles the MACD moving averages calculation but without the smoothing of the histogram.
Can also be used to find divergences.
The background shows the main trend with higher time frame which can be set in the settings.
Aimed to use with Higher time frame (Double or more) but can also work with lower time frame.
How to use the indicator?
==Histogram==
Green: Momentum of asset is positive and increasing.
Lighter Green: Momentum of asset is still positive but decreasing and can revert to negative momentum.
Red: Momentum of asset is negative and increasing.
Lighter Red: Momentum of asset is still negative but increasing and revert to positive momentum.
==Background Color - Main Trend==
Green: HTF (Higher time frame) momentum is positive.
RED: HTF momentum is negative.
Feel free to comment and Follow to stay updated with upcoming scripts: www.tradingview.com
NOTE: BARS ARE COLORED BY DEFAULT WITH HISTOGRAM COLORS! (Can be changed in settings)
MACD and EMA200 With SignalsThis is my first indicator. It PROVIDES BUY, SHORT, and FALSE Signals by taking the MACD and the 200EMA.
PWTPROv5 TrendIndicator with LONG/SHORT BTC ETH alerts
This PWTPRO indicator is based on VWAP , MACD and EMAs
Best fits for BTC /USDT and ETH/USDT trading for 1H timeframe for positional trading (3-5 trades per week)
15min TF is good for intraday scalping. 4H is good for longterm. Fits for any coin, forex, metals, oil and bonds.
There are 4 types of entries, 1,3 and 4 are on by default. It's more accurate. Rest you can test.
Warning. Not yet works with huge trend continuation. Use it manually with you own risk management, don't forget stop-losses.
Show take profits and stop-loss (It's off by defaults)
You can now add 3 take-profit and 1 stop-loss labels on chart in %
Use 0 values to remove any of them from the charts.
New option: Show entering position price as label
Minor visual improvements with price labels (y position is now correctly above/below bars)
+added new option to round prices for integer values (i.e. 9251 for btc instead of 9251.35) off by defaults and now fits for altcoins and any asses that has price below 1 (usd, btc etc)
This is invite only script. PM me if you want to test it.
MACD Multiple Time Frames Weighted Momentum Score OscillatorThis script looks at the current momentum direction (up or down) for the 5 minute, 30 minute, 1 hour, 4 hour and daily and allows you to set scores of importance to these.
These scores are then added up to create an oscillator matching your preferences. Tune the indicator to match what you believe is the most important time frames that people use and score it accordingly. The values I put by default are just for demonstration.
For example, (and if you want to test to verify it's working), set the scores to 0 for everything except for the daily). Look at the daily macD by adding it as an indicator and set a score. Whenever the macD is trending up it will add the appropriate value to the score and likewise remove it when it's not.
Enjoy!
Ampleforth Rebase MACDThis script reveals Ampleforth rebase levels which are going to always work. In addition to that is MACD crossovers serving as potential buy/sell entries. You can set alerts for MACD crossovers and price entering balanced value area (0.96 - 1.06).
MACD signals can be used to automatically open a position and entering a balanced value area can be used as take-profit. Since the price will always move to this level, using this strategy without leverage should be profitable.
Ampleforth seems like a nice asset to trade since it is unlikely to correlate with anything else. At least not when it gets to the extreme levels.
MACD & RSIThis indicator shows the MACD and the RSI in one chart. So that both oscillators can be displayed, the RSI was subtracted by 50.
The RSI ranges between 50 and -50 (default 0-100)
The MACD is in the normal setting.
Adaptive MACDThis is part 6 of 11 in the system named Ninetales/Volt V2 you can find on Tradingview.
Add custom values to backtest, it will return the most accurate of them.
MACD with Buy & Sell alerts by Keiron RichieA redesign of the Moving Average Convergence Divergence (MACD) indicator to include background color changes for easy identification and includes Buy/Sell Alerts.
When the MACD (White line) crosses above the Signal (Red Line) the background changes to GREEN.
Likewise, when the MACD (White line) crosses under the Signal (Red Line) the background changes to RED.
Buy & Sell alerts are included.
MACD for WA1) I updated MACD formula to work with the Elliott Wave Principle
2) I changed the standard parameters and indicator’s display type as default for use in Wave Analysis
1) Актуализировал формулу MACD для работы по Волновому Принципу Эллиотта
2) Изменил по умолчанию стандартные параметры и вид отображения индикатора для использования в Волновом Анализе
MACD Indicator [SystemAlpha]This is a MACD indicator enhanced with:
- Show MACD and Signal Only or Histogram Only or Both
- Show Buy and Sell Alert - MACD Cross
- Show Bar Color
- Show Regular and Hidden divergence
- Show Divergence Labels
- Generate Alerts: Buy/Sell and Divergence