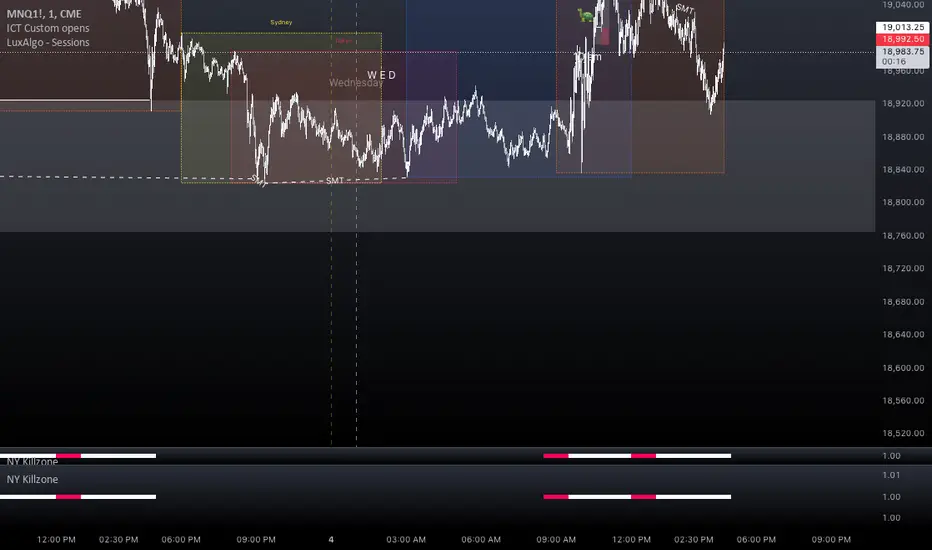
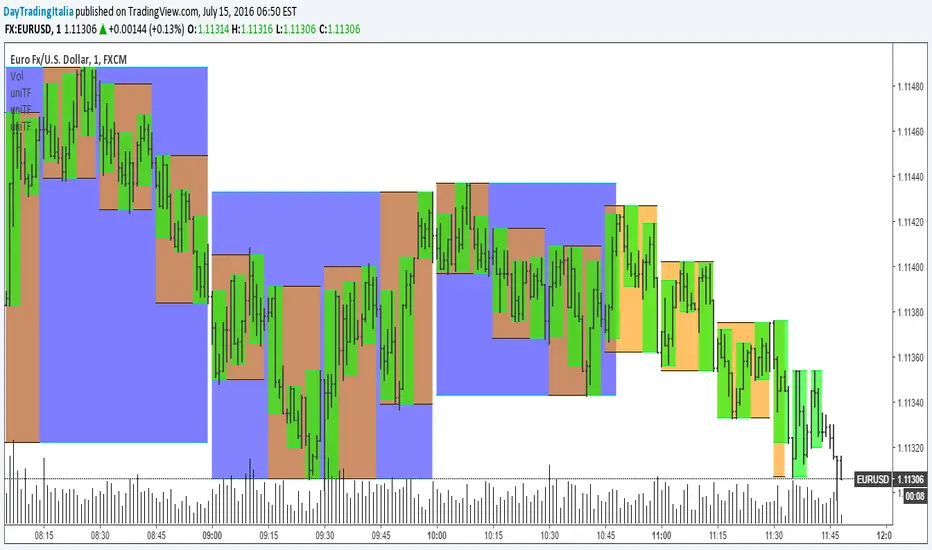
NY Killzone (Morning, Lunch, Afternoon)Indicator for New York session that splits Morning, Lunch and Afternoon part of the session.
Works on Time Frames of 30m and below.
NEW
[-_-] Custom Type ExamplesDescription:
This script shows an example use of new Pinescript's feature called User Defined Types, which can be seen as analogue of from C++ or from Python. It is not an indicator for technical analysis, and serves only as an example of how to use the new feature mentioned above.
In the script I define 4 custom types and a custom initialisation function for each:
- Point (represents a coordinate with x -> bar_index, y -> price)
- Tria (creates a triangle using objects and objects as coordinates of 3 points)
- Path (creates a path-like object from an of )
- Trade (creates a visual representation of a Long/Short trade with set Take Profit and Stop Loss, and displays an info label with realized Profit/Loss)
I'd personally like to see this feature improved by adding methods (so that we could, for example, define functions inside a custom type), which could be an analogue of classes from other programming languages.

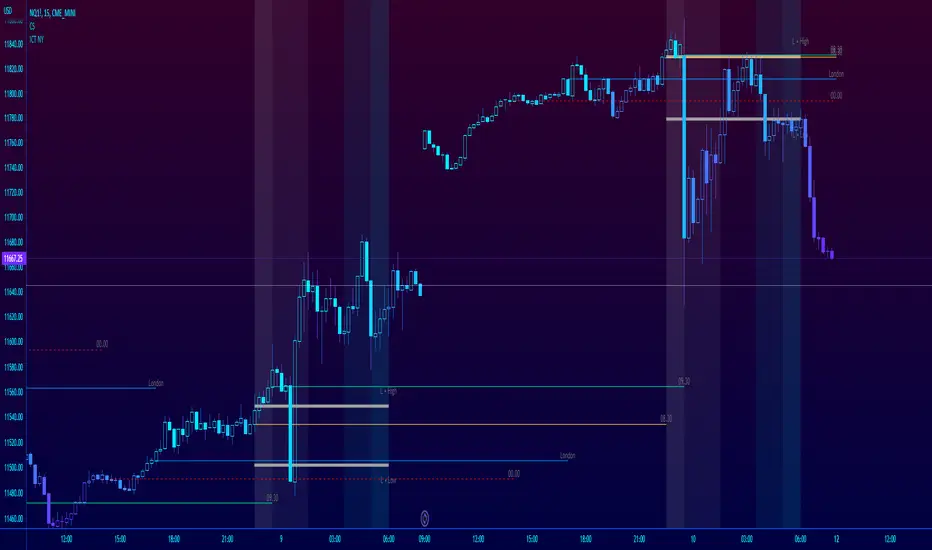
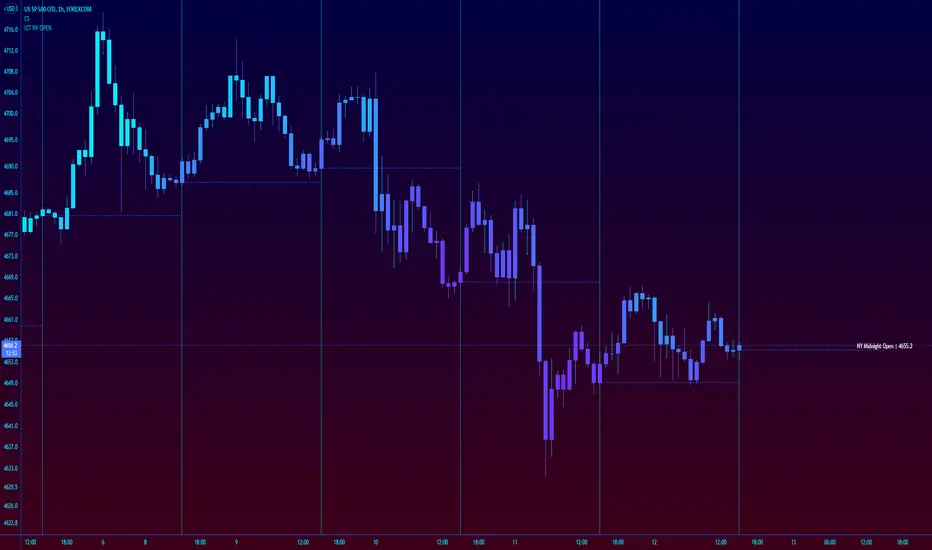
ICT NY Futures Indices Session Model - YT New York MentorshipThis indicator plots out the time periods and open lines as outlined in ICT's 2022 Mentorship and is designed specifically for the New York futures trading session.
Time zone is set to GMT-4 (NY) by default but can be changed for accommodate daylight saving in the menu.
Please note this indicator is to be used only on the 30min timeframe and below.
Here are its features:
The background color shows the morning session, in two parts (8.30am to 9.30am and 9.30am to 11.30am), then a two hour gap for lunch (ICT calls this "Dead time") and finally, the afternoon session, also to two (1.30pm to 3pm and 3pm to 4pm).
It not only shows the current killzones, but future zones as well.
These times are important; trades can be framed within these zones as taught in the mentorship.
Next are the open lines. These lines are automatically plotted and can be areas for price to react off of; they are the opening price of a candle at these times:
00.00 (New York Midnight, also known as "True Day Open")
8.30am (New York Equities pre-open)
9.30am (New York Equities open)
2.00am (London Stock Exchange open)
And lastly, London's trading session High and Low are projected forward onto the New York trading session.
These two price points are areas of liquidity that were pooled during London, but they can also often set the high or low of the day.
Please let me know if there are any bugs or if you have suggestions for the next update.
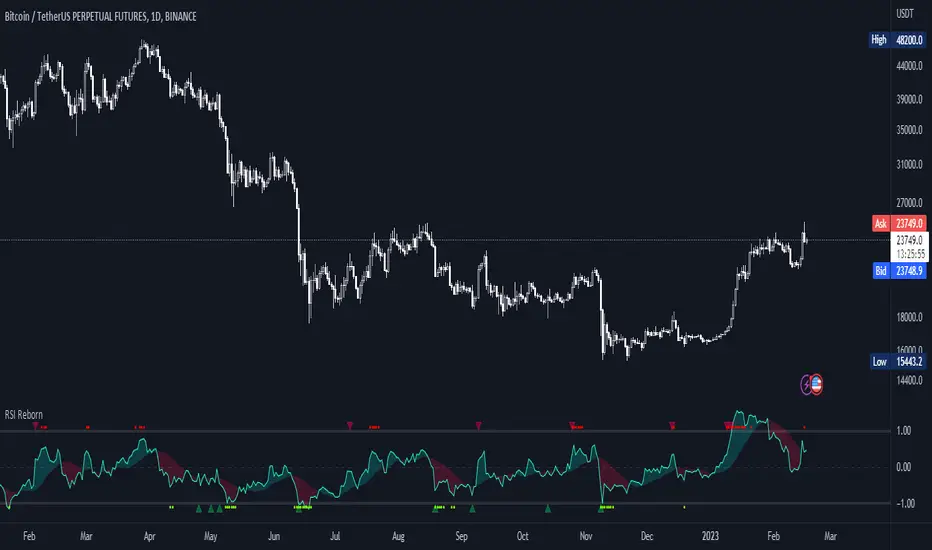
RSI Reborn [New Formula]A unique non-standard RSI formula with my extensions.
The indicator is displayed without delays and repaints, immediately after the close of the candle.
This formula allows me to correctly include the moving average in the calculation. The calculation allows me to display RSI with any type of MA.
By default I use EMA, with this type of MA my RSI is not visually different from a regular RSI.
I have 11 types of RSI to choose from:
'EMA'
'ALMA'
'RMF'
'TilsonT3'
'ARSI'
'RMA'
'SMA'
'VWMA'
'WMA'
'WWMA'
'ZEMA'
You also have a choice of RSI display:
As candlesticks and as a simple line.
You can adjust the colors in the Style tab.
When you select 'Candles' type, you can make the wicks transparent if they bother you.
I also added a source selection. By default, any RSI uses the Close source.
But you can choose any of 15:
VWAP, Close, Open, HL2, HLC3, OHLC4, Volume, High, Low, vwap(Close), vwap(Open), vwap(High), vwap(Low), AVG(vwap(H,L)), AVG(vwap(O,C)).
Additional extensions:
Additional RSI added.
By default, the extra RSI is twice as long as the regular RSI. Despite the value of 14. The "Multiple of Current TF" function allows calling RSI from a timeframe twice as long as the current one, if it is equal to 2. If it is equal to 3, then it will be 3 times longer than the current timeframe. And so on.
An additional moving average has been added.
You can use it as an ordinary additional line. Or leave it as Cloud by default.
A unique oversold/oversold formula in the form of small red/green dots has been added.
Bolinger Bands feature has also been added.
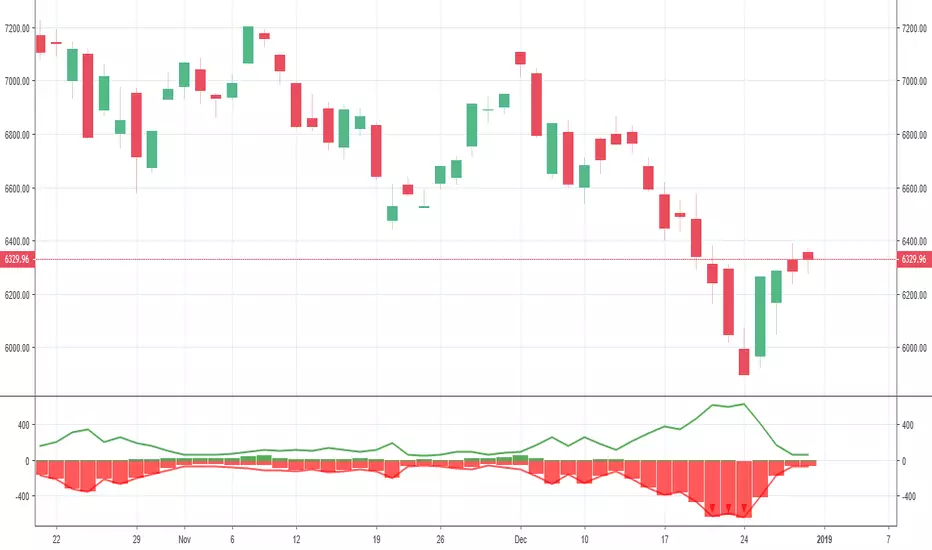
Net New Highs/Lows (With visible code)Basically the same script than Carusolnsights but without hidding the lines of code...
"This indicator displays the net number of stocks on the Nasdaq Composite making 52-week highs or lows. For instance, if there are 60 new 52-week highs and 20 new 52-week lows, the net number will display 40 net new 52 week highs. This indicator is particularty useful in gauging what the breadth is of the Nasdaq.
Three days of net 52-week highs show a healthy market which is conducive to increasing exposure. This condition is highlighted with a green background.
Three days of net 52-week lows show an unhealthy market which is conducive to reducing exposure. This condition is high|lighted with a red background."

Commodity Channel Relative StrengthNew concept(I think atleast) I've joined the Standard RSI and CCI at the hip with another plotcandle, which gives a picture of a larger candle With more interesting movement imo. Includes Fib Retracement Levels, High/Low and a couple of coppock curves for more confirmation. Broadening candles seem to indicate a weakening of trend strength (from what i've seen atleast) although exceptions do occur. Vice versa for tapering to a lesser degree I imagine. RSI has been shifted down to 0 to align the center point with the CCI , so the usual 30/70 RSI Levels are now -20/20 (although I have 30/-30 instead for the hlines).

ICT New York NY Midnight Open and DividerThis simple indicator plots out ICT's New York midnight open price and a vertical divider at that time.
12am NY time is a key level to watch for daytrading and intraday scalping, often providing entry levels and orderblocks.
The session time may need to be adjusted for different exchanges, but the default is for most of forex.
Nunchucks✖ Nunchucks
A new way to display market data
Does not flip color during current candle
Displays Higher and Lower than the previous nunchuck's range
Use it with current price line

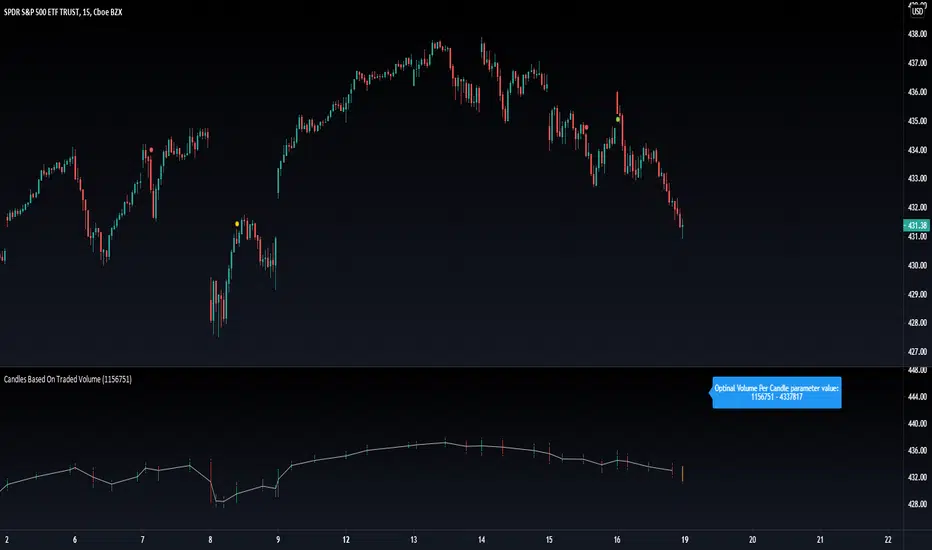
Candles Based On Traded VolumeCBTV - Candlesticks Based on Traded Volume
This is the first robust implementation of volume based candlesticks (bars) on TradingView. This type of bar was describe in the book "Advances in Financial Machine Learning," written by Lopez de Prado, a well-known quant who has managed billions of dollars over the course of his career.
Volume Candlesticks (Bars) are bars that are indexed by total volume, with each set of N shares exchanged forming a separate bar.
This means that on CBTV chart a candle forms not after a specific time interval defined by the time frame of the chart, but when a determined volume was traded.
This approach to price sampling is much better than the time based one, because it does not oversample periods where nothing happens. Traditional candlestick charts show a lot of low volume bars without meaningful price changes in them.
The efficient price sampling results in better results when using volume based bars in machine learning forecasting models. They are also useful for technical analysis. Candlestick patterns on CBTV chart are more pronounced and have more predictive power.
Volume based bars can be constructed only for instruments where volume data is available. These are stocks, futures and crypto currencies.
When you run CBTV it appears in a separate window below the traditional time based chart.
CBTV will be used in pair with a helper indicator which is called Optimal Volume per Candle (OVPC).
When applied to a chart OVPC shows the optimal range for volume per candle to construct volume based candlesticks from this timeframe data. It appears in the blue box above the most recent candle of a standard time based chart.
When you set a Volume Per Candle parameter in CBTV make sure it is within the range that shows OVPC. In this case volume based chart will be easy to read and all the calculations will be performed with the high level of precision.
The most recent unfinished candle is marked with the different set of colors than historical candles. Unfinished candle is colored in orange if it is a falling candle, blue it it is a rising one.
If you leave the CBTV chart opened for a long time you can have multiple blue or orange candles on it. In this case press the “hide” icon with the eye sign twice (it’s on the left side of the indicator panel next to its input parameters). This will refresh the CBTV and remove the artifacts.
While everything comes Real-time you will see the orange or blue bars form but never update. All you need to do is REFRESH THE CHART. Hoping soon to update this with a version you wont have to refresh the chart.
Please drop a like and comment what you guys think and once again thank you Tradingview for such a great platform :)
TSI Strength Meter vs USD with divergenceThis indicator consists of two lines. One is a gray line (USD) and the asset indicator is green or red.
The basis of this indicator is the true strength indicator (TSI) with parameters 5,15. Both line sets are based on a TSI (5,15).
The lookback period is for new highs / new lows. Default value is 200 periods.
GREEN/RED LINE
The first that is green and red is whatever you choose to display ( BTC in this case).
The green and red lines indicate going up or going down.
GRAY LINE
The gray line is the US Dollar . So everything is relative to that by default.
ZERO LINE CROSSES
These are momentum shifts. If you see a crossover of both around the zero line, its a good indication there is a change in momentum and a reversal of trend.
NEW HIGHS NEW LOWS
There are 4 new colors added to this indicator. For the asset you are viewing, a lime color means new highs within the lookback period. A new low is indicated by a yellow line color.
The new lows for the USD are white for new lows within the lookback period and blue line for the new highs.
DIVERGENCE
You can also spot divergences easily. For example, if a lime color is seen on the indicator line, that means "new high" but if it occurs below the last "new high" it means the asset is going up to new highs but the indicator is showing us that the readings are below the previous new highs, indicating a negative divergence.
The same goes for the yellow colored lines. higher yellows mean positive divergence.
And with the US Dollar , blue lines dropping means a negative divergence in the US Dollar , while white lines moving up means a positive dollar divergence.
INTERPRETATION
Examples:
If you see a green and sometimes red line of the asset indicator and a gray line that drops below the zero line; it may mean the asset is rising and the trend is up.
If you see a green and red line below the zero line and with a gray line above the zero line , it indicates there is a negative trend. If you suddenly see blue lines on the USD, this means its hitting new lows. If these blue lines then start to slowly move downwards; then we have a positive divergence. If that were to be followed by the green line crossing the zero line, its a pretty good be that the trend is changing and its a very good buying oportunity.

[JRL] Pivot Regression OscillatorIntroducing the Pivot Regression Oscillator. This oscillator uses a similar formula to the Stochastic Oscillator. However, instead of comparing the closing price to the lowest price of a period, it compares the distance between current price and the current pivot point. By basing our oscillator on pivot levels, we incorporate a much more relevant and consequential price point around which to base our comparisons.
The indicator can give reliable overbought and oversold signals, and it plots two exponential moving averages as output, which provides crossover signals that can be used to help time trades.
The Pivot Regression Oscillator can be effective for timing re-entries into a trend and seems to be able to avoid some of the false signals of other indicators.
Let me know if you find this useful. Cheers!

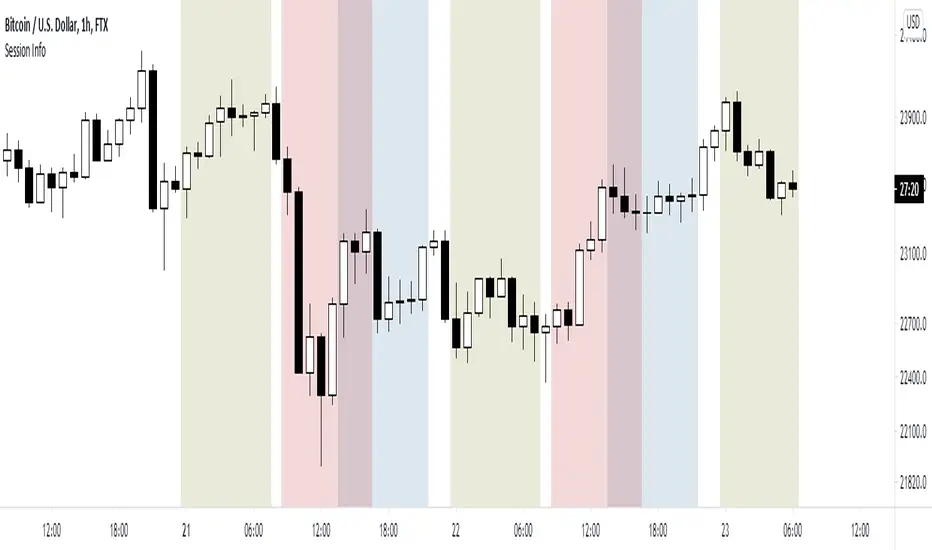
World market Session Information for bitcoinIt marks out different world markets active timings on the bitcoin charts.
You can also modify the script to a strategy and test out different strategies.
King CobraWith this indicator i tried to create a more clear view of the daily chart.
This indicator only works on the daily chart.
This is how the plotted line is created:
When the 'day close' is greater then the 'day hl2' it plots 1 up 'color = green'
When the 'day close' is lesser then the 'day hl2' it plots 1 down 'color = red'
When the 'day hl2' is greater then the 'previous day hl2' it plots 1 up 'color = green'
When the 'day hl2' is lesser then the 'previous day hl2' it plots 1 down 'color = red'
When value (position) of plotted point is on the same value (position) as previous point it plots the color yellow.
A yellow spot could be position entry or exit.
Enjoy:)

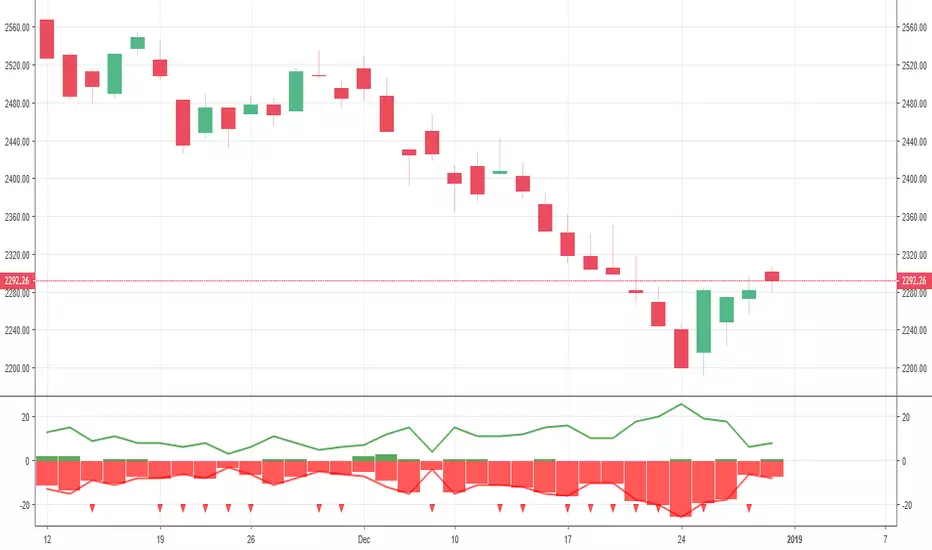
New Highs-Lows AMEX-Buschi
English:
This indicator shows the AMEX's up volume (green) and down volume (red).
Extreme trading days with more than 90 % up or down volume are marked via lines (theoretically values) and triangles (breaches).
Deutsch:
Dieser Indikator zeigt das Aufwärts- (grün) und Abwärts-Volumen (rot) der AMEX.
Extreme Handelstage mit mehr als 90 % Aufwärts- oder Abwärts-Volumen ist gekennzeichnet über Linien (theoretische Werte) und Dreiecke (Überschreitungen).
New Highs-Lows NASDAQ-Buschi
English:
This indicator shows the NASDAQ's new highs (green) and new lows (red).
Extreme trading days with more than 99 % new highs relative to new lows vice versa are marked via lines (theoretically values) and triangles (breaches).
Deutsch:
Dieser Indikator zeigt die neuen Hochs (grün) und neuen Tiefs (rot) der NASDAQ.
Extreme Handelstage mit mehr als 99 % neuen Hochs relativ zu den neuen Tiefs und andersherum sind gekennzeichnet über Linien (theoretische Werte) und Dreiecke (Überschreitungen).
New Highs-Lows NYSE-Buschi
English:
This indicator shows the NYSE's new highs (green) and new lows (red).
Extreme trading days with more than 99 % new highs relative to new lows vice versa are marked via lines (theoretically values) and triangles (breaches).
Deutsch:
Dieser Indikator zeigt die neuen Hochs (grün) und neuen Tiefs (rot) der NYSE.
Extreme Handelstage mit mehr als 99 % neuen Hochs relativ zu den neuen Tiefs und andersherum sind gekennzeichnet über Linien (theoretische Werte) und Dreiecke (Überschreitungen).

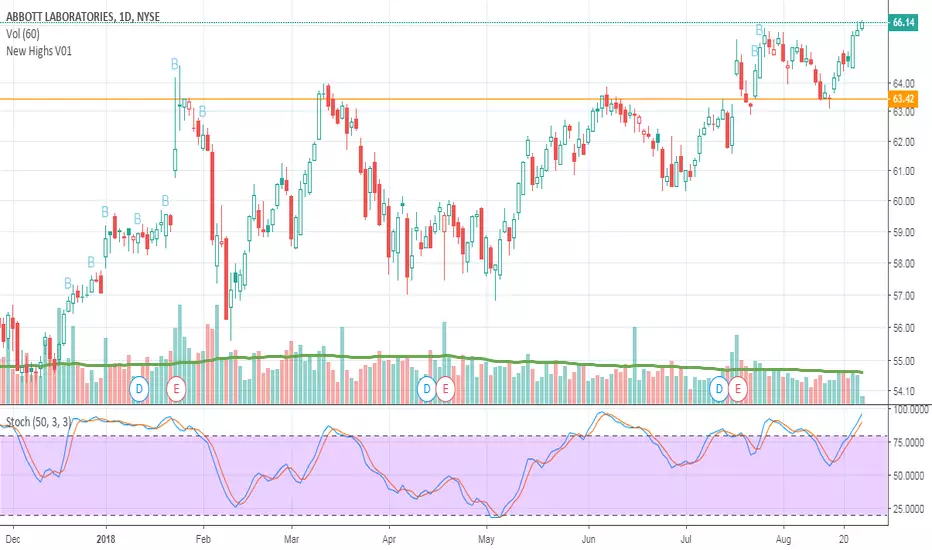
New Highs V01Script is meant for finding stocks in new uptrends and has had a pullback. Looking for support confirmation before going long. My first script.
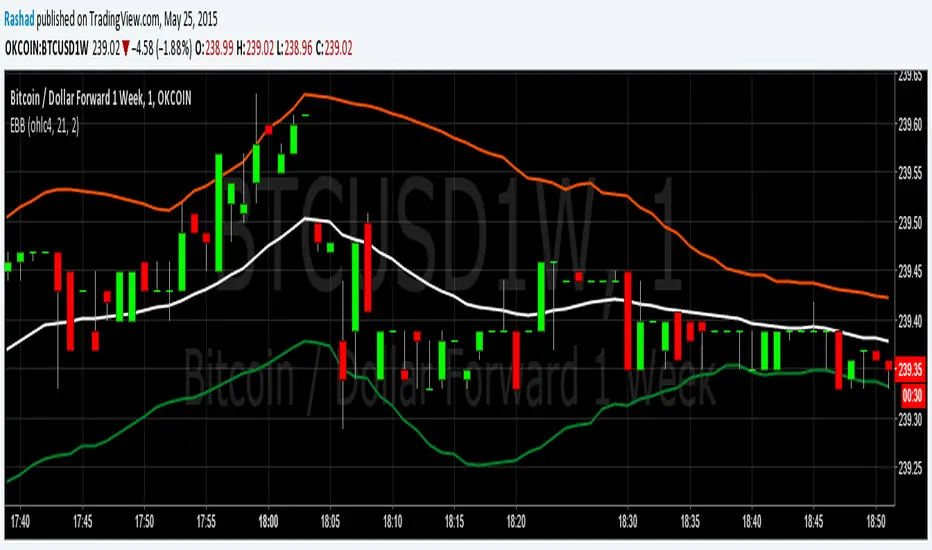
Exponential Bollinger BandsThese Bollinger Bands are exponential because the variance is calculated using the exponential moving average, rather than just adding the normal standard deviation to the ema. This may be more useful because the exponential standard deviation should be more sensitive to near term increases or decreases in volatility.
Please do not forget that Bollinger Bands should always be combined with another method of analysis. Bollinger Bands just provide an easy way to gauge where the price could range in. At 2 standard deviations of a continuously random variable, more than 98% of data points are in this range. I am however going to test this in excel to get the average number of data points that stay in the range for Bitcoin. I will upload my findings when I complete that. Please monitor this description if your interested.