Daily Floor PivotsDaily Floor Pivots with Comprehensive Statistical Analysis
Overview
This indicator combines traditional floor pivot levels with golden zone analysis and comprehensive statistical insights derived from 15 years of historical NQ futures data. While the pivot levels and golden zones can be applied to any instrument, the statistical tables are specifically calibrated for NQ/MNQ futures based on analysis of 2,482 NY Regular Trading Hours (RTH) sessions from 2010-2025.
What Makes This Indicator Original
Unlike standard pivot indicators that merely plot levels, this tool provides:
Enhanced Golden Zone Analysis: Calculates not only the main golden zone (0.5-0.618 retracement of previous day's range) but also golden zones between each pivot pair (PP-R1, R1-R2, R2-R3, PP-S1, S1-S2, S2-S3)
Data-Driven Statistical Tables: Two comprehensive tables displaying real statistics from 2,482 trading days of NQ analysis, including:
Probability-based touch rates and continuation patterns
Context-aware statistics based on opening position
Gap analysis and behavioral patterns
First touch dynamics and time-to-reach averages
Granular Customization: Every visual element and statistical section can be independently toggled, allowing traders to focus on what matters most to their strategy
How It Works
Pivot Calculation Methodology
The indicator uses the standard floor pivot formula based on the previous day's price action:
Pivot Point (PP) = (Previous High + Previous Low + Previous Close) / 3
Resistance Levels: R1, R2, R3 calculated from PP and previous range
Support Levels: S1, S2, S3 calculated from PP and previous range
Golden Zone Calculations
Main Golden Zone: The 0.5 to 0.618 Fibonacci retracement of the previous day's range, representing a key reversal and continuation area.
Inter-Pivot Golden Zones: For each adjacent pivot pair, golden zones are calculated as:
Resistance pairs (PP→R1, R1→R2, R2→R3): 0.5-0.618 range from the lower pivot
Support pairs (PP→S1, S1→S2, S2→S3): 0.382-0.5 range from the upper pivot
These zones represent high-probability areas where price tends to react when moving between pivot levels.
Statistical Analysis Source
All statistics displayed in the tables are derived from external Python analysis of 15 years of 1-minute NQ futures data (2010-2025), specifically analyzing NY RTH sessions (9:30 AM - 4:00 PM EST). The analysis tracked:
2,482 complete trading days
Intraday pivot touches and closes
Opening position context
Gap behavior relative to previous day
Time-of-day patterns
Sequential pivot interactions
IMPORTANT: While the pivot levels and golden zones are universally applicable mathematical calculations that work on any instrument, the statistical percentages shown in the tables are specific to NQ/MNQ behavior only. Do not assume these statistics transfer to other instruments.
Configuration Guide
Basic Settings
Number of Periods Back (1-20, default: 3)
Controls how many historical pivot periods are displayed on the chart
Setting to 1 shows only current day's pivots
Higher values show more historical context
Labels Position (Left/Right)
Choose whether pivot labels appear on the left or right side of each level line
Line Width (1-5, default: 2)
Adjust the thickness of all pivot and golden zone lines
Golden Zone Customization
Show Daily Golden Zone (0.5-0.618)
Toggle the main golden zone on/off
When enabled, displays a shaded box between the 0.5 and 0.618 retracement levels
Line Color / Fill Color
Customize the appearance of the main golden zone
Fill color determines the shaded box transparency
Show Labels / Show Prices
Control whether "0.5" and "0.618" labels appear
Control whether price values are displayed on labels
Inter-Pivot Golden Zones
Six toggle options allow you to show/hide individual golden zones:
PP to R1 / PP to S1: Most frequently touched (60.8% / 50.9%)
R1 to R2 / S1 to S2: Moderately touched (25.2% / 24.0%)
R2 to R3 / S2 to S3: Rarely touched (9.4% / 10.5%)
Line Color / Fill Color: Customize appearance of all inter-pivot zones
Show Labels / Show Prices: Control labeling for inter-pivot zones
Usage Tip: Disable outer zones (R2-R3, S2-S3) on lower volatility days to reduce chart clutter.
Pivot Display
Show Support/Resistance Levels: Master toggle for all pivot lines
Show SR Labels / Show SR Prices: Control labeling on pivot levels
Individual level toggles and colors:
PP (Pivot Point): The central reference point
R1/S1: Primary resistance/support (38.9% / 35.4% touch rate)
R2/S2: Secondary levels (15.6% / 16.1% touch rate)
R3/S3: Extended levels (5.1% / 7.3% touch rate)
Color Customization: Each level's color can be independently set
Overall Statistics Table
Show Overall Statistics Table: Master toggle
Table Size: tiny/small/normal/large/huge/auto
Table Position: Top Left/Top Right/Bottom Left/Bottom Right
Section Toggles (enable/disable individual sections):
Current Session Info
Touch & Close Rates
Continue & Reject Rates
First Touch Statistics
Golden Zone Statistics
Daily Close Distribution
Highest/Lowest Levels Reached
Context Statistics Table
Show Context Statistics Table: Master toggle
Table Size: tiny/small/normal/large/huge/auto
Table Position: Top Left/Top Right/Bottom Left/Bottom Right
Section Toggles:
Current Opening Zone
Opening Zone Statistics
Previous Day Gap Context
Understanding the Statistical Tables
TABLE 1: OVERALL STATISTICS
This table presents universal statistics from 2,482 days of NQ analysis.
Current Session Info
Displays real-time context for the active session:
Open: Where the current RTH session opened relative to pivots (e.g., "GZ_TO_R1" means opened between the PP-R1 golden zone and R1)
Now: Current price position relative to pivots
Direction: Bull (close > open), Bear (close < open), or Flat
How to use: This section helps you quickly understand where price opened and where it currently is, providing immediate context for the day's action.
Touch & Close Rates
Shows probability that each pivot level will be reached during RTH:
Touch %: Percentage of days where price touched this level at any point
Example: R1 touched 38.9% of days, PP touched 57.5% of days
Close %: Percentage of days where price closed beyond this level
Example: R1 close beyond happened 39.8% of days
How to interpret:
Higher touch rates indicate more reliable levels for intraday targeting
The difference between touch and close rates shows rejection frequency
PP has the highest touch rate (57.5%), making it the most magnetic level
Outer levels (R3/S3) have low touch rates (5.1%/7.3%), indicating rare extension days
Continue & Reject Rates
When a level is touched, these statistics show what happens next:
Continue %: Probability price continues through the level
Example: When PP is touched, price continues 88.1% of the time
Reject %: Probability price rejects from the level and reverses
Example: When R1 is touched, price rejects 50.9% of the time
How to interpret:
PP shows highest continuation (88.1%), confirming it's a poor reversal level
Support levels (S1/S2/S3) show strong rejection rates (62.5%/60.7%/56.1%), making them better reversal candidates
Continuation rates above 80% suggest the level is better as a target than an entry
First Touch Statistics
Analyzes which pivot is typically touched first during RTH:
1st Touch %: Probability this level is the first pivot encountered
PP is first touched 37.1% of days (most common)
R1 is first touched 26.0% of days
S1 is first touched 10.9% of days
1st→Continue: If this level is touched first, probability of continuation
S1-S3 show 95.6%-100% continuation when touched first
This means when price reaches support first, it usually continues lower
Avg Time: Minutes after 9:30 AM EST before first touch
PP: 1h 6m average
S3: 19m average (when bearish)
R3: 3h 19m average (when bullish)
How to interpret:
Opening away from PP means higher probability of reaching extremes (R2/R3 or S2/S3)
When support is touched first (within first 2 hours), expect continuation lower
Late-day first touches (after 2 PM) often indicate strong trending days
Multi-Touch: Shows how often levels are tested multiple times (92.8%-95.0% across all levels)
Golden Zone Statistics
Main GZ: 58.5% touch rate for the 0.5-0.618 zone
Inter-Pivot zones:
PP-R1: 60.8% (highest probability)
PP-S1: 50.9%
R1-R2: 25.2%
S1-S2: 24.0%
R2-R3: 9.4%
S2-S3: 10.5%
How to interpret:
Main GZ is touched more often than any individual resistance level
PP-R1 and PP-S1 golden zones are high-probability mean reversion areas
Outer golden zones (R2-R3, S2-S3) are only relevant on high volatility days
Daily Close Distribution
Shows where RTH sessions typically close:
Above/Below PP: 58.5% close above, 41.5% below (slight bullish bias)
Above R1: 24.5% of days
Below S1: 18.7% of days
In GZ: Only 6.3% close in the golden zone (typically transits through it)
How to interpret:
Most days (58.5%) have bullish bias (close above PP)
Less than 25% of days are strong trending days (beyond R1/S1)
Golden zone is an action area, not a resting area
Highest/Lowest Levels Reached
Distribution of the most extreme level reached:
High Resist: R1 (26.0%), R2 (10.8%), R3 (5.1%)
Low Support: S1 (35.4%), S2 (1.9%), S3 (0.6%)
How to interpret:
Most days don't reach beyond R1 or S1
R3/S3 are rare events (5.1%/0.6%), indicating major trending days
S1 is reached as lowest level more often than R1 as highest, suggesting downside is more frequently tested
TABLE 2: CONTEXT STATISTICS
This table provides conditional statistics based on how the session opened.
Current Opening Zone
Displays which of 13 possible zones the RTH session opened in:
ABOVE_R3, R2_TO_R3, R1_TO_R2, GZ_TO_R1, IN_GZ, PP_TO_GZ, AT_PP, GZ_TO_PP, S1_TO_GZ, S2_TO_S1, S3_TO_S2, BELOW_S3
How to use: This immediately tells you the market structure and what type of day to expect.
Opening Zone Statistics
Detailed statistics for the current opening zone (only shows for 6 major zones):
For each zone, you see:
Occurs: How often this opening scenario happens
GZ_TO_R1: 38.4% (most common)
AT_PP: 12.8%
S1_TO_GZ: 24.2%
R1_TO_R2: 9.4%
S2_TO_S1: 6.3%
IN_GZ: 3.8%
Bull/Bear %: Close direction probability
Example: GZ_TO_R1 is perfectly balanced (50.0% bull / 49.6% bear)
R1_TO_R2 is bullish (58.1% bull / 41.0% bear)
Levels Hit: Probability of reaching each pivot level from this opening
Helps identify high-probability targets
Example: From GZ_TO_R1, PP is hit 52.9%, R1 is hit 49.0%, S1 is hit 21.6%
How to interpret:
GZ_TO_R1 (most common): Balanced day, watch PP and GZ for direction clues
AT_PP: Slight bullish bias (56.9%), high chance of touching both PP (92.8%) and GZ (90.3%)
R1_TO_R2: Bullish bias (58.1%), expect continuation to R2 (58.1% chance)
S2_TO_S1: Bullish reversal setup (59.9%), very high chance of S1 touch (82.8%)
IN_GZ: Rare opening (3.8%), bullish bias, virtually guaranteed GZ touch (100%)
Previous Day Gap Context
Shows current gap scenario and typical behavior:
Three scenarios:
GAP UP: Opened Above Yesterday's High (20.5% of days)
R1 Touch: 65.9% (high probability)
R2 Touch: 42.1%
S1 Touch: 15.0% (low probability)
Bias: Bullish continuation
GAP DOWN: Opened Below Yesterday's Low (11.3% of days)
S1 Touch: 71.5% (high probability)
S2 Touch: 55.2%
R1 Touch: 12.1% (low probability)
Bias: Bearish continuation
NO GAP: Opened Within Yesterday's Range (68.2% of days)
PP Touch: 69.5%
GZ Touch: 71.7%
R1 Touch: 35.2%
Bias: Balanced (watch for direction at PP/GZ)
How to interpret:
Gap days (up or down) tend to continue in the gap direction
When gapping, fade trades are low probability (15.0% and 12.1%)
Most days (68.2%) open within previous range, making PP and GZ critical decision zones
The "bias" line provides clear directional guidance for trade selection
Practical Application Examples
Example 1: Standard Day Setup
Scenario: RTH opens at 20,450
PP: 20,400
GZ: 20,390-20,395
R1: 20,425
Previous day high: 20,460
What the tables tell you:
Opening Zone: "GZ_TO_R1" (38.4% occurrence)
Gap Context: "NO GAP" (68.2% occurrence)
Expected behavior: Balanced (50/50 bull/bear)
High probability: PP touch (52.9%), GZ touch (56.8%)
Moderate probability: R1 touch (49.0%), S1 touch (21.6%)
Trade plan:
Wait for price to reach PP (52.9% chance) or GZ (56.8% chance)
Look for directional confirmation at these levels
First target R1 if bullish, S1 if bearish
Avoid assuming direction without confirmation (perfectly balanced opening)
Example 2: Gap Up Day
Scenario: RTH opens at 20,510
Previous day high: 20,460
R1: 20,425
R2: 20,475
What the tables tell you:
Gap Context: "GAP UP" (20.5% occurrence)
R1 touch: 65.9% probability
R2 touch: 42.1% probability
S1 touch: Only 15.0% probability
Bias: Bullish continuation
Trade plan:
Favor long setups
Target R1 first (65.9% chance), then R2 (42.1%)
If R1 breaks, R2 becomes likely target
Shorting is low probability (only 15.0% reach S1)
Example 3: Opening in Golden Zone
Scenario: RTH opens at 20,393
PP: 20,400
GZ: 20,390-20,395
What the tables tell you:
Opening Zone: "IN_GZ" (rare, only 3.8% occurrence)
Bullish bias: 58.1%
GZ touch: 100% (guaranteed - already there)
PP touch: 75.3%
R1 touch: 41.9%
Trade plan:
Expect price to test PP (75.3% chance)
Slight bullish bias suggests long setups better than shorts
Watch how price reacts at PP - likely to continue to R1 (41.9%)
This is an uncommon opening, suggesting potential for larger moves
Best Practices
Match Your Instrument: Remember, statistics are NQ-specific. If trading other instruments, use the levels but disregard the statistical percentages.
Combine with Price Action: Use the statistics for probability context, not as standalone signals. Always confirm with price action, volume, and your trading methodology.
Adapt Table Display: Don't display all sections all the time. Toggle based on your trading phase:
Pre-market: Focus on "Gap Context" to understand the setup
Market open: Watch "Opening Zone Statistics" for directional bias
Intraday: Monitor "Current Session Info" for position tracking
Understand Context: A 60% touch rate doesn't mean guaranteed—it means 40% of days don't touch. Use these probabilities to size positions and manage expectations.
Inter-Pivot Golden Zones: These are most useful when price is already in motion toward a level. For example, if price breaks above PP heading to R1, the PP-R1 golden zone (60.8% touch rate) becomes a high-probability pullback area.
Time Awareness: The "Avg Time" statistics help you understand urgency. If it's 10:30 AM and S1 hasn't been touched (average is 55 minutes), the window for bearish moves is closing.
Technical Notes
Time Zone: All times referenced are NY/EST
Session Definition: RTH is 9:30 AM - 4:00 PM EST
Calculation Period: Pivots update daily based on previous 24-hour period (18:00 previous day to 17:00 current day)
Data Source: Statistics derived from 12 years of NQ 1-minute futures data (2013-2025)
Sample Size: 2,482 complete RTH trading sessions
Disclaimer
This indicator provides statistical probabilities based on historical NQ futures data. Past performance does not guarantee future results. The statistical tables are educational tools and should not be the sole basis for trading decisions. Always:
Use proper risk management
Combine with your own analysis
Understand that probabilities are not certainties
Remember that statistics are instrument-specific (NQ/MNQ only)
Credits
Statistical analysis performed using Python analysis of 12 years of historical NQ futures data. All pivot and golden zone calculations use standard mathematical formulas applicable to any instrument.
Nqstats

NQ Hourly Retracements - 12y Stats with LevelsHour Stats with Levels - TradingView Indicator Description
IMPORTANT: NQ FUTURES ONLY
This indicator is specifically designed for and calibrated to NQ (Nasdaq-100 E-mini) futures only. The statistical data is derived exclusively from 13 years of NQ price action (2013-2025). Do not use this indicator on any other asset, ticker, or market as the statistics will not be applicable and may lead to incorrect trading decisions.
Overview
"Hour Stats with Levels" is a statistical analysis indicator that provides real-time probability-based insights into hourly price behavior patterns. The indicator combines historical pattern recognition with live price action to help traders anticipate potential sweep and reversal scenarios within each trading hour.
Originality and Core Concept
This indicator is based on a comprehensive statistical analysis of 12y years of 1-minute NQ futures data, examining a specific price pattern: when an hourly candle opens inside the previous hour's range. Unlike generic support/resistance indicators, this tool provides hour-specific, context-aware probabilities based on 30,000+ historical occurrences of this pattern.
The originality lies in three key areas:
Pattern-Specific Statistics: Rather than applying generic technical analysis, the indicator only activates when the current hour opens within the previous hour's range, providing relevant statistics for this exact scenario.
Context-Aware Probabilities: Statistics are differentiated based on whether the current hour opened above or below the previous hour's open, recognizing that bullish and bearish opening contexts produce different behavioral patterns.
Comprehensive Retracement Tracking: The indicator tracks four independent retracement levels after a sweep occurs, showing the probability of price returning to: the swept level itself (90+% probability), the 50% level, the current hour's open, and the opposite extreme.
How It Works
The Core Pattern
The indicator monitors a specific price structure:
Setup Condition: The current hourly candle opens inside (between) the previous hour's high and low
Sweep Event: Price then breaks above the previous high (high sweep) or below the previous low (low sweep)
Retracement Analysis: After a sweep, the indicator tracks whether price retraces to key levels
Statistical Foundation
The underlying analysis processed 1-minute bar data from 2013-2025, identifying every instance where an hourly candle opened inside the previous hour's range. For each occurrence, the system tracked:
Whether the high, low, or both were swept during that hour
The distance of the sweep measured as a percentage of the previous hour's range
Whether price retraced to four key levels: the swept level, the 50% point, the current open, and the opposite extreme
These measurements were aggregated for all 24 hours of the trading day, with separate statistics for bullish contexts (opening above previous open) and bearish contexts (opening below previous open), creating 48 unique statistical profiles.
Sweep Distance Percentiles
The "reversal levels" are drawn based on historical sweep distance distributions:
25th Percentile: 75% of historical sweeps were larger than this distance. This represents a conservative reversal zone where smaller, contained sweeps typically reverse.
Median (50th Percentile): The midpoint of all historical sweep distances. Half of all sweeps reversed before reaching this level, half extended beyond it.
75th Percentile: Only 25% of sweeps extended beyond this distance. This represents an extended sweep zone where price has historically shown exhaustion.
For example, if the previous hour's range was 20 points and the median high sweep distance is 40% of range, the median reversal level would be placed 8 points above the previous high.
How to Use the Indicator
Sweeps were calculated using 1m data - as such, it's recommended to use the indicator on a 1min chart
Visual Components
Hour Delimiter (Gray Vertical Line)
Marks the start of each new hour
Helps identify when new statistics become active
Sweep Markers
Green "H" label: High sweep has occurred this hour
Red "L" label: Low sweep has occurred this hour
Markers appear on the exact bar where the sweep happened
Target Levels (Blue Lines)
Prev Open: Previous hour's opening price
Prev High: Previous hour's highest price (sweep target)
Prev Low: Previous hour's lowest price (sweep target)
Prev 50%: Midpoint of previous hour's range
Current Open: Current hour's opening price (key retracement target)
Reversal Levels (Purple Dashed Lines)
Positioned beyond the previous high/low based on historical sweep percentiles
Three levels above previous high (for high sweeps)
Three levels below previous low (for low sweeps)
These represent statistically-derived zones where sweeps typically exhaust
The Statistics Table
The table dynamically updates each hour and displays different statistics based on whether the current hour opened above or below the previous hour's open.
Status Row
Shows current state: waiting for sweep, or which sweep(s) have occurred
If waiting, indicates which sweep is more probable based on historical data
SWEEP PROBABILITIES Section
High Sweep: Historical probability (%) that price will sweep the previous high this hour
Low Sweep: Historical probability (%) that price will sweep the previous low this hour
Both Sweeps: Historical probability (%) that price will sweep both levels this hour
These probabilities are derived from counting how many times each pattern occurred in similar historical contexts. For example, "High Sweep: 73.18%" means that in 73.18% of historical occurrences where the hour opened in this same context (same hour of day, same position relative to previous open), price swept the previous high before the hour closed.
AFTER HIGH SWEEP → Section
These statistics activate only after a high sweep has occurred. They show the probability of price retracing to various levels:
→ Prev High: Probability that price returns to (or below) the level it just swept. This is typically 90%+ because sweeps often act as "false breakouts" or liquidity grabs before reversal.
→ 50% Level: Probability that price retraces at least halfway back into the previous hour's range. This represents a moderate retracement.
→ Current Open: Probability that price retraces all the way back to where the current hour opened. This indicates a complete reversal of the sweep move.
→ Prev Low: Probability that price retraces entirely through the previous range to touch the opposite extreme. This represents a full reversal pattern.
AFTER LOW SWEEP → Section
Mirror of the above, but for low sweeps:
→ Prev Low: Retracement to the swept low level (90%+ probability)
→ 50% Level: Retracement to middle of range
→ Current Open: Full retracement to current hour's open
→ Prev High: Complete reversal to opposite extreme
Important Note on Retracement Statistics: These percentages are tracked independently. A 90% probability of returning to the swept level doesn't mean there's only a 10% chance of deeper retracement. Price can (and often does) retrace through multiple levels sequentially. The percentages show how many times price reached at least that level, not where it stopped.
Trading Applications
Anticipating Sweeps
When an hour opens inside the previous range, check the probabilities. If "High Sweep: 70%" and "Low Sweep: 30%", you know there's a 70% historical likelihood of an upside sweep occurring this hour. This doesn't guarantee it will happen, but provides statistical context for potential setups.
Reversal Trading
The most reliable pattern in the data is the 90%+ retracement probability to swept levels. When a sweep occurs, traders can anticipate a retracement back to at least the swept level in the vast majority of cases. The reversal level percentiles help identify where sweeps may exhaust.
Position Management
The retracement probabilities help manage existing positions. For example, if you're long and a high sweep occurs, you know there's a 90%+ chance of at least some retracement to the swept level, which might inform profit-taking or stop-loss decisions.
Confluence with Current Open
The "Current Open" retracement statistics (typically 60-70%) highlight the magnetic quality of the hour's opening price. After a sweep, price frequently returns to test this level.
Customization Options
The indicator offers extensive visual customization:
Toggle on/off: hour delimiters, sweep markers, target levels, reversal levels, statistics table
Customize colors, line widths, and styles for all visual elements
Adjust label sizes and table position
Show/hide individual target levels and reversal percentiles
Limitations and Considerations
Pattern-Specific: The indicator only provides statistics when the current hour opens inside the previous hour's range. If the hour opens outside this range (gaps up or down), the statistics are not applicable.
Historical Probabilities: The percentages represent historical frequencies, not predictions. A 70% probability means it happened 70% of the time historically, not that it will definitely happen 7 out of 10 times going forward.
NQ-Specific Calibration: All statistics are derived from NQ futures data. Market behavior, volatility, and patterns differ across assets.
Hour-Specific Behavior: Different hours show dramatically different statistics. For example, the 9 AM EST hour (market open) shows much higher sweep probabilities (80%+) than the 5 PM EST hour (30-50%) due to differing liquidity and volatility conditions.
No Guarantee of Execution: While a 90% retracement probability is high, it means 10% of the time, price did NOT retrace. Always use proper risk management.
Technical Notes
The indicator uses hourly timeframe data via request.security() to determine previous hour values
Sweep detection occurs in real-time on the chart's timeframe
Statistics are hardcoded from the comprehensive backtested analysis (not calculated on-the-fly)
The indicator stores static values at the start of each hour to ensure consistency as the hour progresses
All percentage values are rounded to one decimal place for clarity
This indicator provides a statistically-grounded framework for understanding hourly price behavior in NQ futures. By combining real-time pattern detection with comprehensive historical analysis, it offers traders probabilistic insights to inform decision-making process within the specific context of each trading hour.

Statistcal Daily Profile & Ranges# Statistical Daily Profile & Ranges - TradingView Publication Guide
## Overview
The **Statistical Daily Profile & Ranges** indicator is a comprehensive tool designed to analyze intraday session behavior and daily range characteristics. It combines Average Daily Range (ADR) projection levels with detailed session-by-session statistics and probability-based trading insights derived from historical price action patterns.
## What This Indicator Does
This indicator provides traders with three core analytical components:
1. **ADR Projection Levels** - Dynamic support/resistance levels based on historical daily ranges
2. **Session Range Analysis** - Visual boxes and statistical breakdowns for four key trading sessions
3. **Dynamic Probability Display** - Real-time probability statistics based on overnight session relationships
## How It Works
### Average Daily Range (ADR) Calculation
The indicator calculates the average daily range over a user-defined lookback period (default: 10 days) and projects this range from each day's opening price. This creates two key levels:
- **ADR High**: Opening price + average daily range
- **ADR Low**: Opening price - average daily range
- **ADR Median**: The opening price (middle of the projected range)
These levels are recalculated at the start of each trading day and extend forward, providing dynamic support and resistance zones based on recent volatility characteristics.
### Session Tracking & Statistics
The indicator monitors four distinct trading sessions (times in Eastern Time):
1. **Asia Session** (8:00 PM - 2:00 AM)
2. **London Session** (2:00 AM - 8:00 AM)
3. **NY Open** (8:00 AM - 9:00 AM)
4. **NY Initial Balance** (9:30 AM - 10:30 AM)
For each session, the indicator:
- Draws a colored box showing the session's high-to-low range
- Tracks the opening price, high, and low
- Stores historical data for statistical analysis
- Calculates average ranges by day of week (Monday through Friday)
The session statistics are displayed in a customizable table showing average point ranges for each session across different weekdays, helping traders identify which sessions and days typically produce the most movement.
### Dynamic Probability System
The indicator analyzes the relationship between the Asia and London sessions to determine the current market setup. After the London session closes, it automatically detects one of four possible conditions:
**1. London Engulfs Asia**
- London session breaks both above Asia's high AND below Asia's low
- This indicates strong momentum during the European session
- Most common occurrence pattern
**2. Asia Engulfs London**
- Asia session range completely contains the London session range
- Indicates consolidation during London hours
- Relatively rare pattern (occurs approximately 5.36% of the time)
**3. London Partially Engulfs Upwards**
- London breaks above Asia's high but stays above Asia's low
- Suggests bullish momentum continuation from Asia into London
**4. London Partially Engulfs Downwards**
- London breaks below Asia's low but stays below Asia's high
- Suggests bearish momentum continuation from Asia into London
Once a condition is detected, the indicator displays a probability table showing historically observed outcomes for that specific setup, including:
- Probability of NY session taking out key levels (Asia high/low, London high/low)
- Probability of NY session engulfing the entire overnight range
- Directional bias for NY Cash session (9:30 AM - 4:00 PM)
## How to Use This Indicator
### Initial Setup
1. Add the indicator to your chart (works on any intraday timeframe below Daily)
2. Adjust the **ADR Days** setting (default: 10) to control the lookback period for range calculation
3. Adjust the **Session Lookback Days** setting (default: 50) to determine how much historical data feeds the statistics tables
### Reading the ADR Levels
- Use the **ADR High** and **ADR Low** lines as potential profit targets or areas where price may encounter resistance
- The **ADR Median** line represents the opening price and can act as a pivot point for intraday directional bias
- If price reaches the ADR High early in the session, it suggests strong bullish momentum; conversely for ADR Low
- These levels adapt daily based on recent volatility, making them more responsive than static levels
### Interpreting Session Boxes
- **Session boxes** visually highlight when each trading session is active and its price range
- Larger boxes indicate higher volatility during that session
- Compare current session ranges to the statistical averages shown in the table
- Sessions that are unusually quiet or active relative to historical averages may signal compression or expansion
### Using the Session Statistics Table
- The table shows average point ranges for each session broken down by weekday
- Identify which sessions typically produce the most movement on specific days
- For example, if London on Thursdays averages 40 points while Mondays average 25 points, you can adjust position sizing or expectations accordingly
- The **Total** column shows the overall average across all days
- Sample sizes (shown in brackets if enabled) indicate data reliability
### Trading with the Probability Table
The probability table updates dynamically after the London session closes and shows statistically probable outcomes based on 12 years of NQ futures data.
**Important Limitations:**
- **These probabilities are derived from NQ (Nasdaq E-mini futures) data only**
- **Do NOT apply these probability statistics to other instruments** (ES, stocks, forex, etc.)
- The probabilities represent historical frequencies, not guarantees
- Always combine with your own analysis, risk management, and market context
**How to Apply the Probabilities:**
When **London Engulfs Asia**:
- Watch for NY session to take out London's extremes (72.33% probability for high, 71.12% for low)
- Slight bullish bias in NY Cash session (54.80% vs 45.20%)
- Lower probability of complete overnight engulfment (44.13%)
When **Asia Engulfs London** (rare - 5.36% occurrence):
- Higher probability NY takes Asia's high (75.86%)
- Moderately high probability NY takes Asia's low (65.52%)
- Slight increase in bullish bias (58.42% vs 41.58%)
- Recognize this as an unusual setup
When **London Partially Engulfs Upwards**:
- Very high probability NY takes London high (81.51%)
- Strong probability NY takes London low (64.45%)
- Moderate probability NY takes Asian low (53.16%)
- Slight bullish bias (55.52%)
When **London Partially Engulfs Downwards**:
- Very high probability NY takes London low (75.29%)
- Strong probability NY takes London high (68.80%)
- Moderate probability NY takes Asian high (56.44%)
- Slight bullish bias maintained (52.99%)
### Practical Trading Applications
**Scenario 1: Range Projection**
If the ADR is 500 points and the market opens at 25,000:
- ADR High: 25,500 (potential resistance/target)
- ADR Low: 24,500 (potential support/target)
- Monitor how price interacts with these levels throughout the day
**Scenario 2: Session-Based Trading**
Using the statistics table, you notice London on Wednesdays averages 35 points. During a Wednesday London session:
- If London has already moved 30 points, the session may be exhausting its typical range
- If London has only moved 15 points with an hour remaining, there may be expansion potential
- Adjust stop losses and targets based on typical session behavior
**Scenario 3: Probability-Based Setup**
It's 8:05 AM ET and the indicator shows "London Partially Engulfs Upwards":
- You now know there's an 81.51% historical probability NY will take out London's high
- There's a 53.16% probability NY will reach down to Asia's low
- The NY Cash session has a slight bullish bias (55.52%)
- Consider this alongside your technical analysis for directional bias and level targeting
## Customization Options
### Visual Settings
- **Line Width**: Adjust thickness of ADR levels
- **ADR Color/Style**: Customize appearance of ADR projection lines (solid, dashed, dotted)
- **Median Line**: Toggle visibility and customize appearance separately
- **Session Box Colors**: Customize each session's box color independently
- **Show Session Boxes**: Toggle session box visibility on/off
### Label Settings
- **ADR Labels**: Show/hide labels for ADR High and ADR Low, adjust size
- **Median Label**: Separate control for median line label
- **Session Labels**: Show/hide session name labels, adjust size
- **Label Colors**: Customize text colors for all labels
### Table Settings
- **Session Stats Table**: Position (9 locations available), size (Tiny to Huge), toggle on/off
- **Sample Sizes**: Show/hide the number of historical samples used for each calculation
- **Probabilities Table**: Separate position and size controls, toggle on/off
### Session Times
- Each session's time range can be customized to fit different markets or preferences
- All times are in Eastern Time (America/New_York timezone)
## Technical Notes
### Data Requirements
- The indicator requires sufficient historical data based on your lookback settings
- Minimum recommended: 50+ days of intraday data for reliable statistics
- Works on any timeframe below Daily (1-minute, 5-minute, 15-minute, etc.)
### Calculation Methodology
- **ADR Calculation**: Simple average of absolute daily high-low ranges
- **Session Statistics**: Mean average of ranges for each session filtered by day of week
- **Condition Detection**: Boolean logic comparing session high/low relationships
- All calculations update in real-time as new bars form
### Probability Data Source
The probability statistics displayed in the dynamic table are derived from:
- **Dataset**: 12 years of NQ (Nasdaq E-mini futures) historical data
- **Methodology**: Frequency analysis of outcomes following specific setup conditions
- **Time Period**: Multiple market cycles including various volatility regimes
**Critical Warning**: These probabilities are specific to NQ and reflect that instrument's behavior patterns. Market microstructure, participant behavior, and volatility characteristics differ significantly across instruments. Do not apply these NQ-derived probabilities to other markets (ES, RTY, YM, individual stocks, forex, commodities, etc.).
## Best Practices
1. **Combine with Other Analysis**: Use this indicator as one component of a complete trading methodology, not a standalone system
2. **Respect Risk Management**: Probabilities are not certainties; always use proper position sizing and stop losses
3. **Context Matters**: High-impact news events, holiday trading, and extreme volatility can invalidate typical patterns
4. **Verify Statistics**: Monitor your own results and compare to the displayed probabilities
5. **Adapt Session Times**: If trading instruments with different active hours, adjust session times accordingly
6. **Regular Calibration**: Periodically review if the session averages and probabilities remain relevant to current market conditions
## Understanding Originality
This indicator is original in its approach to combining three analytical frameworks into a single tool:
1. **Dynamic ADR Projection**: Unlike static pivot points, these levels adapt daily based on recent volatility
2. **Session-Specific Statistics**: Goes beyond simple volume profiles by quantifying average ranges for specific time windows across weekdays
3. **Conditional Probability Display**: Automatically detects overnight session relationships and displays relevant probability data rather than showing all scenarios simultaneously
The conditional logic system that determines which probability set to display is a key differentiator—traders only see the statistics relevant to the current market setup, reducing information overload and improving decision-making clarity.
## Summary
The **Statistical Daily Profile & Ranges** indicator provides traders with a comprehensive framework for understanding daily range potential, session-specific behavior patterns, and probability-based setup analysis. By combining ADR projection levels with detailed session statistics and dynamic probability displays, traders gain multiple perspectives on potential price movement within the trading day.
The indicator is most effective when used to:
- Set realistic profit targets based on average daily range
- Identify which sessions typically produce movement on specific weekdays
- Understand probability-weighted outcomes for different overnight setup conditions (NQ only)
- Visualize session ranges and compare them to historical averages
Remember that all statistical analysis reflects historical patterns, and market behavior can change. Always combine indicator signals with sound risk management, proper position sizing, and your own market analysis.

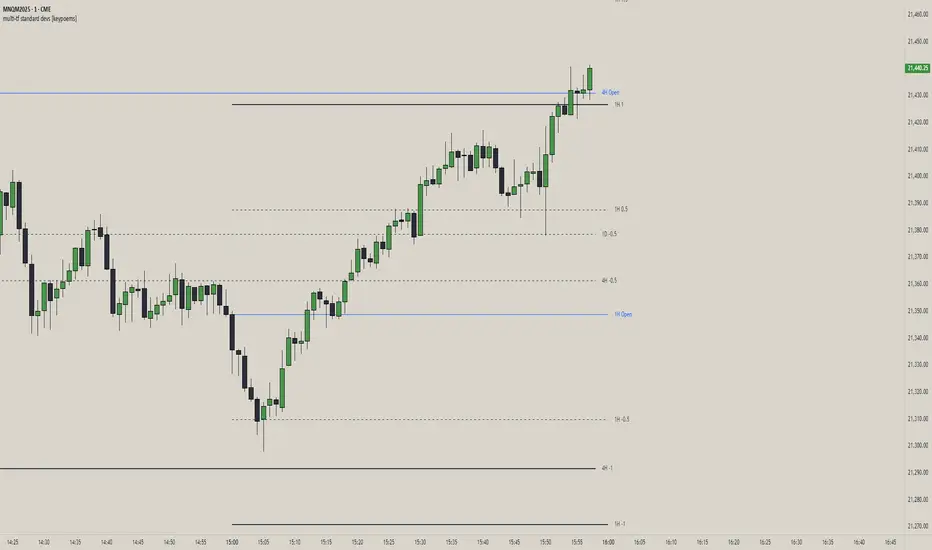
multi-tf standard devs [keypoems]Multi-Timeframe Standard Deviations Levels
A visual map of “how far is too far” across any three higher time-frames.
1. What it does
This script plots dynamic price “rails” built from standard deviation (StDev)—the same math that underpins the bell curve—on up to three higher-time-frames (HTFs) at once.
• It measures the volatility of intraday open-to-close increments, reaching back as far as 5000 bars (≈ 20 years on daily data).
• Each HTF can be extended to the next session or truncated at session close for tidy dashboards.
• Lines can be mirrored so you see symmetric positive/negative bands, and optional background fills shade the “probability cone.”
Because ≈ 68 % of moves live inside ±1 StDev, ≈ 95 % inside ±2, and ≈ 99.7 % inside ±3, the plot instantly shows when price is statistically stretched or compressed.
3. Key settings
Higher Time-Frame #1-3 Turn each HTF on/off, pick the interval (anything from 1 min to 1 year), and decide whether lines should extend into the next period.
Show levels for last X days Keep your chart clean by limiting how many historical sessions are displayed (1-50).
Based on last X periods Length of the StDev sample. Long look-backs (e.g. 5 000) iron-out day-to-day noise; short look-backs make the bands flex with recent volatility.
Fib Settings Toggle each multiple, line thickness/style/colour, label size, whether to print the numeric level, the live price, the HTF label, and whether to tint the background (choose your own opacity).
4. Under-the-hood notes
StDev is calculated on (close – open) / open rather than absolute prices, making the band width scale-agnostic.
Watch for tests of ±1:
Momentum traders ride the breakout with a target at the next band.
Mean-reversion traders wait for the first stall candle and trade back to zero line or VWAP.
Bottom line: Multi-Timeframe Standard-Deviations turns raw volatility math into an intuitive “price terrain map,” helping you instantly judge whether a move is ordinary, stretched, or extreme—across the time-frames that matter to you.
Original code by fadizeidan and stats by NQStats's ProbableChris.