Trend Trading with Currency Strength MeterThis is a trend trading strategy designed mainly for forex made of two big components:
First we have the currency meter, which is made of taking TSI of different INDEXes such as EUR, USD, GBP, JPY, NZD, AUD , CHF and CAD.
Once we establish which one is the weakest and most powerful, we pair them together and we go on that chart.
Lastly we check with the EMA 200 to confirm our direction.
We can see in this example for the USDJPY chart, that USD is the strongest, JPY is the weakest and ema confirm our bullish trend.
For timeframe in general I recommend big timeframes, 1-4h+ , and as a mentality a swing trading mentality, we can stay in trade for days/weeks.
For exit in general I recommend to exit when either one of the pairs losses/gain power or when the EMA is crossing with current candle
If you have any questions, let me know !
NZDUSD

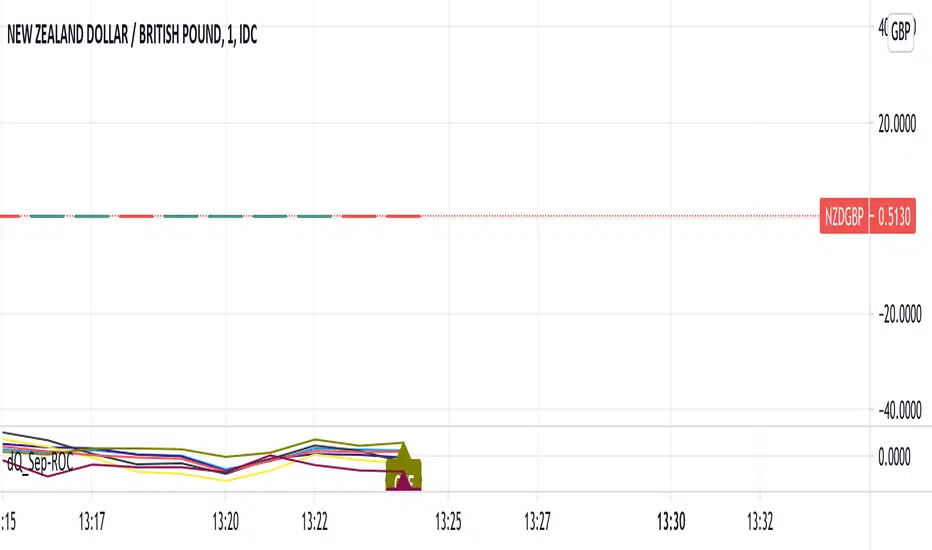
ROC of Majors against the USD (Label)Version 2 of the ROC study that now puts them as a label on the same chart.
ROC of Majors against the USDA simple study that shows the majors against the USD Rate of Change.
Allows you to pick opposing strength pairs to trade.
There are different ROC calculations for people to play with as I am not sure which way the ( ) should be so feedback is welcome.
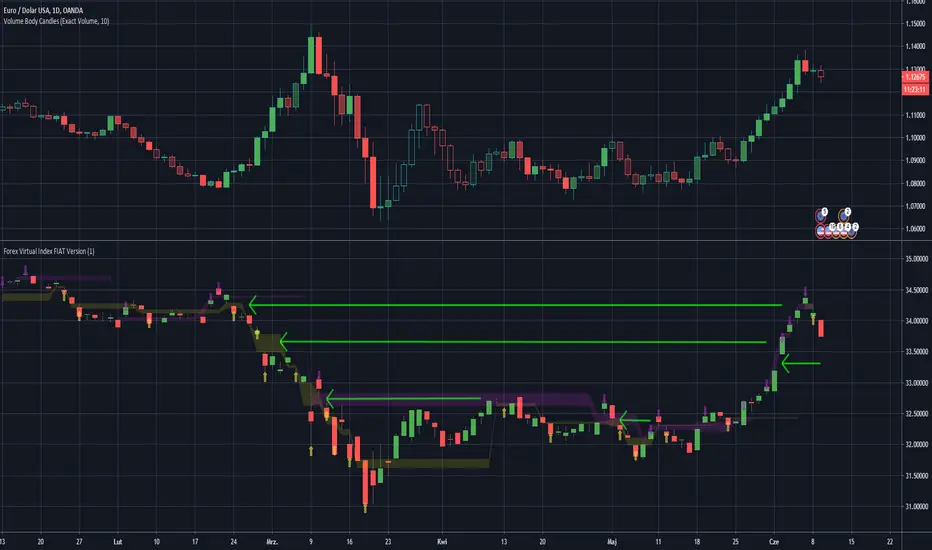
Forex Virtual Index FIAT VersionThis is virtually created FX Fiat pairs index based on OANDAs data.
Pairs are: EUR/USD , AUD/USD , GBP/USD , NZD/USD , AUD/JPY , EUR/JPY , GBP/JPY , USD/JPY , USD/CAD , USD/PLN
Be awared that some pairs like USD/CAD , have reversed correlation to the index.
You may look at the gaps as on standard S/R levels.
ps. Take look inside the scirpt's settings.
ps2. This script is invite-only for the members of our trading group (info in signature, group is free of charge).

Forex CorrelationsA utility tool to find linear relationships between different currency pairs and
specified symbols. This is another private indicator of mine.
Features
37 well known Forex pairs
3 correlation display modes ( Positive and Negative , Positive , Negative )
Ability to specify any symbol to see correlations
Ability to specify a preferred timeframe
Readable and optimized code
Supported pairs
USDCAD
USDMXN
USDBRL
USDCHF
USDRUB
USDTRY
USDZAR
USDJPY
USDCNY
USDHKD
CADCHF
CADJPY
EURUSD
EURCAD
EURGBP
EURCHF
EURRUB
EURTRY
EURJPY
EURCNY
EURAUD
EURNZD
GBPUSD
GBPCAD
GBPJPY
GBPCNY
GBPAUD
GBPNZD
AUDUSD
AUDCAD
AUDCHF
AUDJPY
AUDCNY
AUDNZD
NZDUSD
NZDJPY
NZDCNY

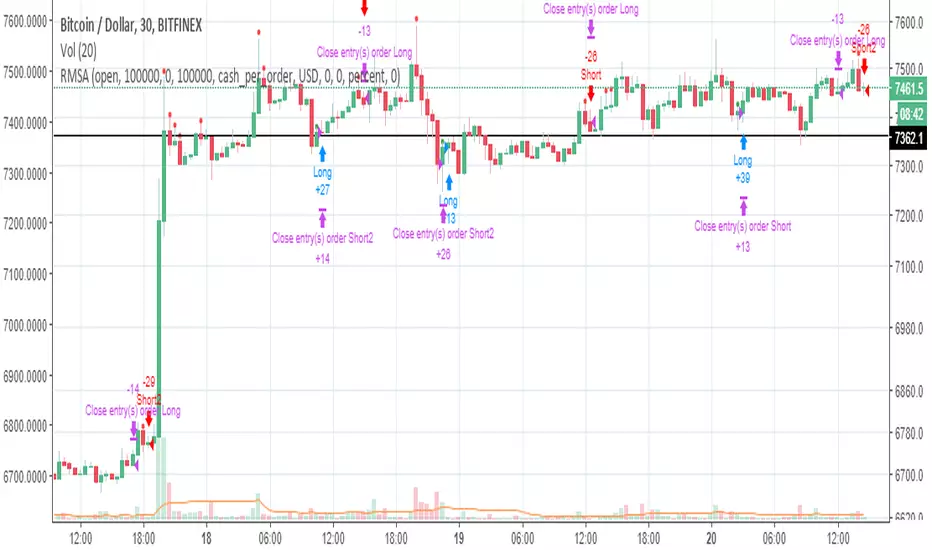
RMSA - Strategy - BTC/IOT/BCH/EOS - no repaintHey just build this strategy that uses multiple indicators to set buy and sell orders. If you want access just write a comment.
I tested only BTCUSD, IOTUSD, BCHUSD, EOSUSD and EOSBTC. Use the checkbars to select the pair, only 1 checkbar should be used.
Works only in 30 Min.
2 Strategys for BTC und IOT available.
If you want other pairs wirte a comment I'll try to get some good parameters.
Have fun trading and testing.
By the way its not using indicators of higher timeframes, so its not repainting.
HL2 - 22 EMA Cross for RenkoEURUSD
This is a simple strategy to use for those who like Renko bars. I ONLY use it on Renko.
Basic idea is that when the Renko bar closes above or below the 22 EMA, you go long or short.
However, some of the frustrations I've had with any strategy shared in Tradingview is so few folks put in the ability to set a stop or a profit target or the ability to set a specific time to trade. I have added those to this strategy. (And I for the life of me can not remember where I got the code for the the time, I need to find you!).
Special note: If you have never used the Renko bars in Tradingview, make sure you click the Format option next to whatever pair you are looking at and change it from Traditional to ATR. You can set it for a static pip amount if you want. But ATR at first will help you decide which amount of pips you should throw in.
This is my first published strategy so if I screwed up on anything or didn't explain it very well, please let me know!!

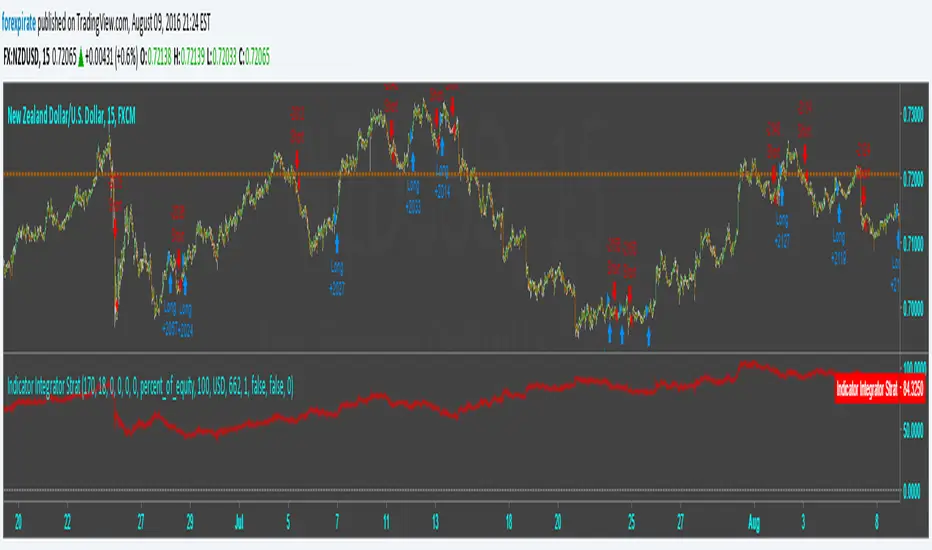
Indicator Integrator Strat <<<<<< Updated again, second2nd patch
Found an error in the orders. Script was making double orders at times. I fixed it. It is tuned as such:
NZDUSD
15 min chart
starting $USD to show 1000 contracts for minicontract with FXCM (start date 3-18 $633 ** see note)
Indicator plots Starting equity-trade gain and loses-number of trades time spread = net money
** with 1:50 leverage it requires $16 for one 1,000 contract.
$84 net vs $16 initial balance is 456% in 109 days.
* If you find errors please comment.
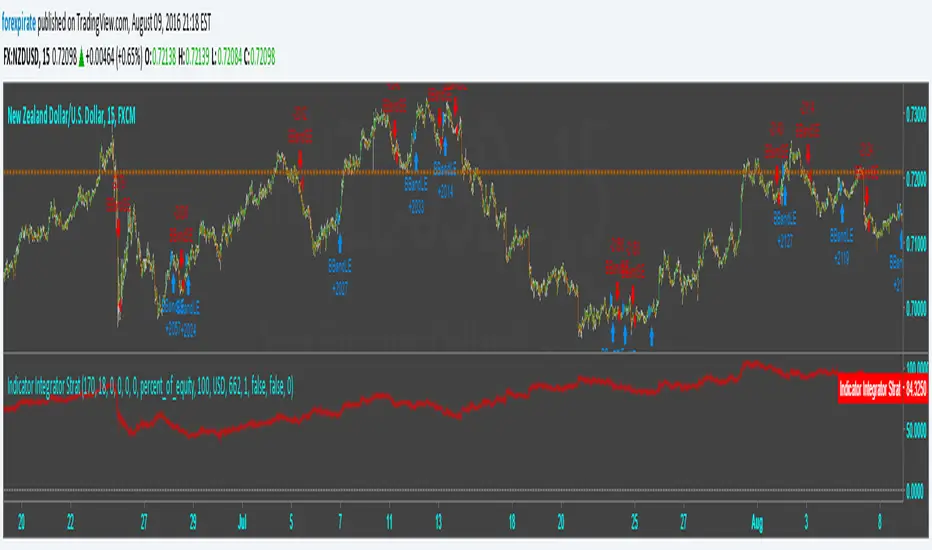
Indicator Integrator Strat <<<<<< UPDATED with CorrectionFound an error in the orders. Script was making double orders at times. I fixed it. It is tuned as such:
NZDUSD
15 min chart
starting $USD to show 1000 contracts for minicontract with FXCM (start date 3-18 $633 with 1:50 leverage)
Indicator plots ==> Starting equity - (trade gain and loses) - (number of trades) * (spread) = true balance estimate
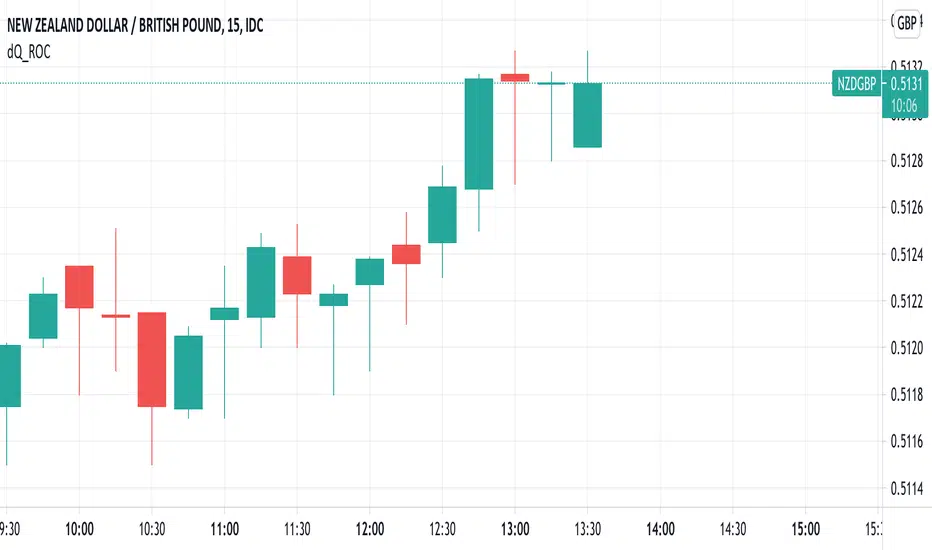
Indicator Integrator StratThis strategy is based on my Indicator Integrator. The code sums the distances from the close of the price to an SMA (200 in example) with a summation period of the last 29 bars. I tuned this to NZDUSD 15min chart using 200SMA and 29 period sum. If I am reading strat tester correctly this hits a 39% gain since Mar-13 or 104 days. It has the ability to set stops and limits which they are not set at this point. There is no repainting or HA charts and other tricks of boosting a false gain. My codes are built for autotrading with some oversight, i.e stopping the autotrading prior to extreme news events on the economic calendar. I pick pairs that have low volatility so that the code does not have to act through heavy price changes.
Comments welcome

Double Bollinger Bands StrategyDouble Bollinger Strategy. Price crosses inner BB (with increasing outer BB) long is placed. Long is closed when price closes below outer BB. Reversed for short. The numbers are tuned for NZDUSD 15min chart.
Pbin = percent on inner BB
Pbout = percent on outer BB
There are all kinds of other inputs, trailing stop, limit, etc.
Errors, questions, suggestions are wanted, thank you

Single SMA cross with BB StrategyThis is a light weight code and strategy. I tuned it for NZDUSD on a 15 min chart. NZDUSD is a slow moving low volatility pair. A single SMA cross over + crossing a .9 BB + the single SMA is increasing. I will be manually trading this with alerts and once I have LUA down I will set it free with FXCM and see what it can do on it own.
** I use BB as a means of seeing momentum to continue gaining not as a reversal signal.
Please contact me with issues/questions

