Options Liquidity Meter (OLM)❓ The question behind this indicator
When trading options, it is common to experience situations where price moves in the expected direction, yet the option contract does not increase in value as anticipated.
This typically happens when one or more of the following conditions is missing:
Insufficient liquidity participation
Lack of volatility expansion
Weak or passive order flow
Options Liquidity Meter (OLM) was created to address this specific question:
“If price moves from here, are there conditions for option premiums to actually expand?”
🎯 What this indicator does
Options Liquidity Meter is a context tool, not a trading system.
It evaluates whether the current market environment is favorable for option premium expansion , based on three core engines:
Liquidity (Relative Volume)
Measures whether price movement is supported by meaningful participation.
Volatility State
Identifies compression, release, and expansion phases, where options tend to respond differently.
Order Flow Activity (OBV-based)
Acts as a proxy for active vs. passive participation, helping filter hollow moves.
These components are combined into a single, easy-to-read options context.
🟢🟡🔴 Options Context Output
The indicator displays one consolidated state:
RED — NO EXPANSION
Price may move, but option premiums often do not respond.
YELLOW — BUILDING
Liquidity or volatility is developing. Conditions are improving but not fully aligned.
GREEN — EXPANSION LIKELY
Liquidity, volatility expansion, and active flow are aligned.
This is a favorable environment for option premium expansion.
The same logic is reflected visually through the background color and summarized in the dashboard.
📊 How to read the dashboard
The dashboard shows:
Liquidity: LOW / OK / HIGH
Volatility: COMPRESSED / RELEASED / EXPANDING
Order Flow: FLAT / ACTIVE
Options Context: NO EXPANSION / BUILDING / EXPANSION LIKELY
Below, a Background Color Meaning section explains what each color represents, making the indicator intuitive and educational.
📍 Where to apply this indicator
Options Liquidity Meter must be applied to the underlying asset chart, such as:
Indices (SPY, SPX, QQQ, etc.)
Stocks
Futures
ETFs
It is not designed to be applied to option contracts themselves.
The indicator evaluates the market conditions of the underlying, which are the drivers that influence option premium behavior.
Contract selection (strike, delta, gamma, expiration) remains the trader’s responsibility.
🧠 How to use it
Use your own methodology to define:
Direction
Structure
Entries and exits
Use Options Liquidity Meter to evaluate:
Whether the current environment supports option premium expansion
If the context is RED, be cautious — price may move without rewarding options.
If the context is GREEN, the environment is statistically more favorable for options responsiveness.
🔗 Complementary tools
Options Liquidity Meter is designed to complement, not replace, other tools.
It works well alongside:
Opening Path Selector (EMA200 Context Tool)
For deciding which asset offers the cleanest directional context.
Multi-Tool VWAP + EMAs (Multi-Timeframe) + Key Levels
For in-chart structure, bias, and reference levels.
Each tool addresses a different stage of the decision process and can be used independently.
⚠️ Important notes
This indicator provides context only
It does not generate trading signals
No indicator guarantees results
Use at your own risk.
Obv-m

Adaptive ATR% Grid + SuperTrend + OrderFlipDescription:
This indicator combines multiple technical analysis tools to identify key price levels and trading signals:
ATR% Grid – automatic plotting of support and resistance levels based on current price and volatility (ATR). Useful for identifying potential targets and entry/exit zones.
SuperTrend – a classic trend indicator with an adaptive ATR multiplier that adjusts based on average volatility.
OrderFlip – identifies price reversal points relative to a moving average with ATR-based sensitivity, optionally filtered by OBV and DMI.
MTF Confirmation – multi-timeframe trend verification using EMA to reduce false signals.
Signal Labels – "LONG" and "SHORT" labels appear on the chart with an offset from the price for better visibility.
JSON Alerts – ready-to-use format for automated alerts, including price, SuperTrend direction, Fair Zone, and ATR%.
Features:
Fully compatible with Pine Script v6
Lines and signals are fixed on the chart, do not shift with new bars
Configurable grid, ATR, SuperTrend, and filter parameters
Works with MTF analysis and classic indicators (OBV/DMI)
Usage:
Best used with additional indicators and risk management strategies. ATR% Grid is ideal for both positional trading and intraday setups.
перевод на русский
Описание:
Этот индикатор объединяет несколько методов технического анализа для выявления ключевых уровней цены и сигналов на покупку/продажу:
Сетка ATR% (ATR% Grid) – автоматическое построение уровней поддержки и сопротивления на основе текущей цены и волатильности (ATR). Позволяет видеть потенциальные цели и зоны входа/выхода.
SuperTrend – классический трендовый индикатор с адаптивным множителем ATR, который корректируется на основе средней волатильности.
OrderFlip – определение моментов разворота цены относительно скользящей средней с учетом ATR, с возможностью фильтрации по OBV и DMI.
MTF-подтверждение – проверка направления тренда на нескольких таймфреймах с помощью EMA, чтобы снизить ложные сигналы.
Сигнальные метки – на графике появляются "LONG" и "SHORT" с отступом от цены для наглядности.
JSON Alerts – готовый формат для автоматических уведомлений, включающий цену, направление SuperTrend, Fair Zone и ATR%.
Особенности:
Поддержка Pine Script v6
Линии и сигналы закреплены на графике, не двигаются при обновлении свечей
Настраиваемые параметры сетки, ATR, SuperTrend и фильтров
Совместимость с MTF-анализом и классическими индикаторами OBV/DMI
Рекомендации:
Используйте в сочетании с другими индикаторами и стратегиями управления риском. Сетка ATR% отлично подходит для позиционной торговли и интрадей.
ATR% Grid – automatic plotting of support and resistance levels based on current price and volatility (ATR). Useful for identifying potential targets and entry/exit zones.
SuperTrend – a classic trend indicator with an adaptive ATR multiplier that adjusts based on average volatility.

Volume Rotor Clock [hapharmonic]🕰️ Volume Rotor Clock
The Volume Rotor Clock is an indicator that separates buy and sell volume, compiling these volumes over a recent number of bars or a specified past period, as defined by the user. This helps to reveal accumulation (buying) or distribution (selling) behavior, showing which side has superior volume. With its unique and beautiful display, the Volume Rotor Clock is more than just a timepiece; it's a dynamic dashboard that visualizes the buying and selling pressure of your favorite symbols, all wrapped in an elegant and fully customizable interface.
Instead of just tracking price, this indicator focuses on the engine behind the movement: volume. It helps you instantly identify which assets are under accumulation (buying) and which are under distribution (selling).
---
🎨 20 Pre-configured Templates
---
🧐 Interpreting the Clock Display
The interface is designed to give you multiple layers of information at a glance. Let's break down what each part represents.
1. The Main Clock Hands (Current Chart Symbol)
The clock hands—hour, minute, and second—are dedicated to the symbol on your current active chart .
Minute Hand: Displays the base currency of the current symbol (e.g., USDT, USD) at its tip.
Hour Hand: Displays the percentage of the winning volume side (buy vs. sell) at its tip.
Color Gauge: The color of the text characters at the tip of both the hour and minute hands acts as your primary volume gauge for the current symbol.
If buy volume is dominant , the text will be green .
If sell volume is dominant , the text will be red .
Tooltip: Hovering your mouse over the text at the tip of the hour or minute or other spherical elements hand will reveal a detailed tooltip with the precise Buy Volume, Sell Volume, Total Volume, Buy %, and Sell % for the current chart's symbol.
2. The Volume Scanner: Bulls & Bears (Symbols Inside the Clock) 🐂🐻
The circular symbols scattered inside the clock face are your multi-symbol volume scanner. They represent the assets you've selected in the indicator's settings.
Green Circles (Bulls - Upper Half): These represent symbols from your list where the total buy volume is greater than the total sell volume over the defined "Lookback" period. They are considered to be under bullish accumulation. The size of the circle and its text grows larger as the buy percentage becomes more dominant. The percentage shown within the circle represents the buy volume's share of the total volume, calculated over the 'Lookback (Bars)' you've set.
Red Circles (Bears - Lower Half): These represent symbols where the total sell volume is greater than the total buy volume. They are considered to be under bearish distribution or selling pressure. The size of the circle indicates the dominance of the sell-side volume. The percentage shown within the circle represents the sell volume's share of the total volume, calculated over the 'Lookback (Bars)' you've set.
3. The Bullish Watchlist (Symbols Above the Clock) ⭐
The symbols arranged neatly along the top edge of the clock are the "best of the bulls." They are symbols that are not only bullish but have also passed an additional, powerful strength filter.
What it Means: A symbol appears here when it shows signs of sustained, high-volume buying interest . It's a way to filter out noise and focus on assets with potentially significant accumulation phases.
The Filter Logic: For a bullish symbol (where total buy volume > total sell volume) to be promoted to the watchlist, its trading volume must meet specific criteria based on this formula:
ta.barssince(not(volume > ta.sma(volume, X))) >= Y
In plain English, this means: The indicator checks how many consecutive bars the `volume` has been greater than its `X`-bar Simple Moving Average (`ta.sma(volume, X)`). If this count is greater than or equal to `Y` bars, the condition is met.
(You can configure `X` (Volume MA Length) and `Y` (Consecutive Days Above MA) in the settings.)
Why it's Useful: This filter is powerful because it looks for consistency . A single spike in volume can be an anomaly. However, when an asset's volume remains consistently above its recent average for several consecutive days, it strongly suggests that larger players or a significant portion of the market are actively accumulating the asset. This sustained interest can often precede a significant upward price trend.
---
⚙️ Indicator Settings Explained
The Volume Rotor Clock is highly customizable. Here’s a detailed walkthrough of every setting available in the "Inputs" tab.
🎨 Color Scheme
This group allows you to control the entire aesthetic of the clock.
Template: Choose from a wide variety of professionally designed color themes.
Use Template: A simple checkbox to switch between using a pre-designed theme and creating your own.
`Checked`: You can select a theme from the dropdown menu, which offers 20 unique templates like "Cyberpunk Neon" or "Forest Green". All custom color settings below will be disabled (grayed out and unclickable).
`Unchecked`: The template dropdown is disabled, and you gain full control over every color element in the sections below.
🖌️ Custom Appearance & Colors
These settings are only active when "Use Template" is unchecked.
Flame Head / Tail: Sets the start and end colors for the dynamic flame effect that traces the clock's border, representing the second hand.
Numbers / Main Numbers: Customize the color of the regular hour numbers (1, 2, 4, 5...) and the main cardinal numbers (3, 6, 9, 12).
Sunburst Colors (1-6): Controls the six colors used in the gradient background for the "sunburst" effect inside the clock face.
Hands & Digital: Fine-tune the colors for the Hour/Minute Hand, Second Hand, central Pivot point, and the digital time display.
Chain Color / Width: Customize the appearance of the two chains holding the clock.
📡 Volume Scanner
Control the behavior of the multi-symbol scanner.
Show Scanner Labels: A master switch to show or hide all the bull/bear symbol circles inside the clock.
Lookback (Bars): A crucial setting that defines the calculation period for buy/sell volume for all scanned symbols. The calculation is a sum over the specified number of recent bars.
`0`: Calculates using the current bar only .
`7`: Calculates the sum of volume over the last 8 bars (the current bar + 7 historical bars).
Symbols List: Here you can enable/disable up to 20 slots and input the ticker for each symbol you want to scan (e.g., BINANCE:BTCUSDT , NASDAQ:AAPL ).
⭐ Bullish Watchlist Filter
Configure the criteria for the elite watchlist symbols displayed above the clock.
Enable Watchlist: A master switch to turn the entire watchlist feature on or off.
Volume MA Length: Sets the lookback period `(X)` for the Simple Moving Average of volume used in the filter.
Consecutive Days Above MA: Sets the minimum number of consecutive days `(Y)` that volume must close above its MA to qualify.
Symbols Per Row: Determines the maximum number of watchlist symbols that can fit in a single row before a new row is created above it.
Background / Text Color: When not using a template, you can set custom colors for the watchlist symbols' background and text.
📏 Position & Size
Adjust the clock's placement and dimensions on your chart.
Clock Timezone: Sets the timezone for the digital and analog time display. You can use standard formats like "America/New_York" or enter "Exchange" to sync with the chart's timezone.
Radius (Bars): Controls the overall size of the clock. The radius is measured in terms of the number of bars on the x-axis.
X Offset (Bars): Moves the entire clock horizontally. Positive values shift it to the right; negative values shift it to the left.
Y Offset (Price %): Moves the entire clock vertically as a percentage of your screen's price pane. Positive values move it up; negative values move it down.

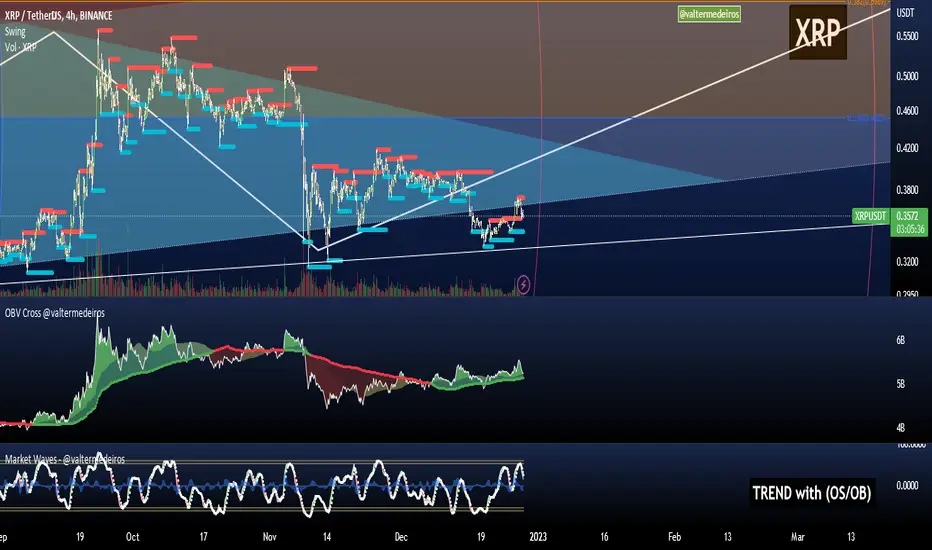
OBV Divergence Indicator [TradingFinder] On-Balance Vol Reversal🔵 Introduction
The On-Balance Volume (OBV) indicator, introduced by Joe Granville in 1963, is a powerful technical analysis tool used to measure buying and selling pressure based on trading volume and price.
By aggregating trading volume—adding it on positive days and subtracting it on negative days—OBV creates a cumulative line that reflects market volume pressure, making it valuable for confirming trends, identifying entry and exit points, and forecasting potential price movements.
Divergences between price and OBV often provide significant signals. A bearish divergence occurs when the price forms higher highs while the OBV line forms lower highs. This discrepancy indicates that upward momentum is weakening, increasing the likelihood of a downward trend.
In contrast, a bullish divergence happens when the price makes lower lows, but the OBV line forms higher lows. This suggests increasing buying pressure and the potential for an upward trend reversal.
For instance, if the price is rising but the OBV trendline is falling, it may signal a bearish divergence, warning of a possible price decline. Conversely, if the price is falling while the OBV line is rising, this could signal a bullish divergence, indicating a possible price recovery. These signals are particularly useful for identifying market turning points.
OBV often acts as a leading indicator, moving ahead of price changes. For example, a rising OBV alongside stable or declining prices can signal an impending upward breakout.
Conversely, a declining OBV with rising prices may indicate that the current uptrend is losing strength. Traders using this strategy often consider entering positions at breakout levels while setting stop losses near recent swing highs or lows to manage risk effectively.
This integration highlights how OBV divergences can provide actionable insights for predicting price movements and managing trades efficiently.
Bullish Divergence :
Bearish Divergence :
🔵 How to Use
The OBV indicator, as a cumulative tool, assists analysts in comparing volume and price changes to identify new trends and key levels for entering or exiting trades. Beyond confirming existing trends, it is particularly effective in analyzing positive and negative divergences between price and volume, providing valuable signals for trading decisions.
🟣 Bullish Divergence
A bullish divergence occurs when the price continues its downward or stable trend, but the OBV line starts rising, forming a higher low compared to its previous low. This suggests increasing volume on up days relative to down days and often signals a reversal to the upside.
For instance, if an asset's price stabilizes near a support level but the OBV line shows an upward trend, this divergence could present an opportunity to enter a long position.
🟣 Bearish Divergence
A bearish divergence occurs when the price forms higher highs, but the OBV line declines, creating lower highs compared to previous peaks. This indicates decreasing volume on up days relative to down days and often acts as a warning for a reversal to the downside.
For example, if an asset’s price approaches a resistance level while OBV starts declining, this divergence may signal the beginning of a downtrend and could indicate a good time to exit long trades or enter short positions.
🔵 Setting
Period : The "Period" setting allows you to define the number of bars or intervals for "Periodic" and "EMA" modes. A shorter period captures more short-term movements, while a longer period smooths out the fluctuations and provides a broader view of market trends.
You can enable or disable labels to highlight key levels or divergences and tables to show numerical details like values and divergence types. These options allow for a customized chart display.
🔵 Table
The following table breaks down the main features of the oscillator. It covers four critical categories: Exist, Consecutive, Divergence Quality, and Change Phase Indicator.
Exist : If divergence is detected, a "+" will appear in this row.
Consecutive: Shows the number of consecutive divergences that have formed in a short period.
Divergence Quality : Evaluates the quality of the divergence based on the number of occurrences. One is labeled "Normal," two are "Good," and three or more are considered "Strong."
Change Phase Indicator : If a phase change is detected between two oscillation peaks, this is marked in the table.
🔵 Conclusion
The OBV (On Balance Volume) indicator is a simple yet effective tool in technical analysis that combines volume and price changes to provide a comprehensive view of market buying and selling pressure. By identifying positive and negative divergences, OBV enables analysts to detect early signs of trend reversals and refine their trading strategies.
Divergences in OBV often precede price changes, making it a leading indicator for predicting market movements. Using OBV alongside other technical tools can enhance decision-making accuracy and help traders identify better entry and exit points. However, it is essential to consider the limitations of OBV, such as the potential for signal errors and the impact of sudden news events.
Ultimately, OBV serves as a complementary tool in technical analysis, aiding in trend identification, signal confirmation, and risk management. A thoughtful application of this indicator, in combination with other analytical tools, can create valuable opportunities for profiting in financial markets.

On Balance Volume CrossoversCheck on balance volume but with crossover. You can choose the smoothing method, which is set by default to use the Volume Weighted Moving Average (bringing volume to the equation is always a good idea) but you can change to SMA, MA, EMA, ...
Hope you guys enjoy it and don't forget to rate it up! :)
I plan to include % from 0-100 OBV in here later! Stay tuned.
Feedback is cool.
Volume RSIThis is an indicator that shows the inflow and outflow of volume into a financial instrument. Volume is likely one of the most underrated source of data in trading unfortunately so there seems to be a lack of studies on it. The size of the candle is related to the strength of the move. The calculations for this are: cumulative sum of +volume if open < close OR -volume if open > close. This has been now transformed into an rsi style indicator to give a distinct advantage (or atleast thats the idea). The idea is that we take rsi of candles so we might as well take the rsi of volume candles. As far as I can tell it is faster/its own thing compared to regular rsi. I ave also added a smoothing option. Dont forget you can change the settings and you wont die. Thank you for your interest in this release I hope you find great piles of money with it.
link to the script I used to make this

RSI+OBVthis strategy works on the basis of crossovers of RSI at different period and OBV at different periods (separately). I am using it for Nifty and Bank Nifty. Entry for long can be taken when green bar appears; and exit has to be done when it disappears. Entry for short has to be taken when red bar appears; and exit has to be done when it disappears.
With little help from price action good results can be achieved.

On Balance Volume Trend© 2022, CryptoNaut1000
An extension to "On Balance Volume Momentum (OBV Momentum)".
"OBV Trend" is a trend strength indicator, that can be used to identify strong trends and also trend changes based on volume.
High positive values indicate strong volume on the buy side, high negative values indicate strong volume on the sell side.
An increasing OBV trend indicates a strengthening buy trend or a weakening sell trend,
decreasing OBV trend indicates a strengthening sell trend or weakening buy trend.
OBV trend is calculated by plotting a short vs. a long moving average and filling the difference in volume.
OBV trend metric is absolute volume.

On Balance Volume MomentumA combination of "On Balance Volume (OBV)" and "Volume Oscillator".
"OBV Momentum" is a trend momentum indicator, that can be used to identify strong trends and also trend changes based on volume.
High positive values indicate strong volume on the buy side, high negative values indicate strong volume on the sell side.
An increasing OBV momentum indicates a strengthening buy trend or a weakening sell trend,
decreasing OBV Momentum indicates a strengthening sell trend or weakening buy trend.
OBV Momentum is calculated by comparing a short vs. a long moving average and plotting the difference in volume.
OBV Momentum metric is absolute volume.

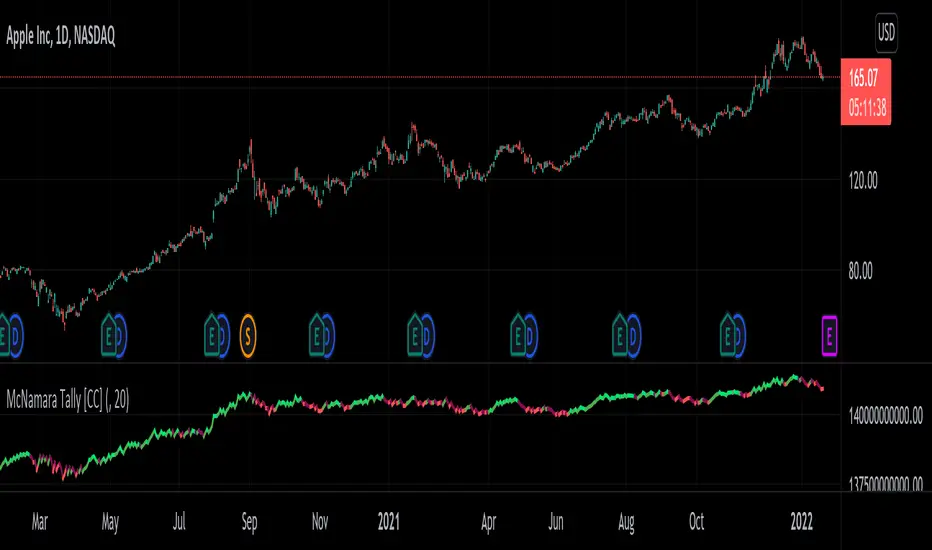
McNamara Tally [CC]The McNamara's Tally was created by Nolan McNamara (Stocks and Commodities Feb 2022 pgs 44-45) and this aims to fix the issues with both the On Balance Volume and the Accumulation/Distribution Line by using a variation of Wilder's True Range to keep track of volume flow to better differentiate between bullish volume and bearish volume. I added a signal line to this indicator to provide clear buy and sell signals since the original didn't' have any so feel free to experiment and see if you come up with a better signal system. Buy when the indicator line turns green and sell when it turns red. I have included strong buy and sell signals in addition to normal ones so stronger signals are darker in color and normal signals are lighter in color.
Let me know if there are any other indicators or scripts you would like to see me publish!
OBV High / LOW (On-Balance Volume )This is a simple application of OBV indicator (On-Balance Volume ), to visually determine when a given stock current obv is near the highest or lowest based on the number of lookback bars.
Indicator examples:
### OBV value is near an all-time high ##
breakthrough , stock value could set new all-time highs.
rejection , stock value could come down or consolidate.
Example
Inputs
OBV High Lookback -> numbers of bars to look back for the obv high.
OBV LowLookback -> numbers of bars to look back for the obv low.
OBV EMA Length -> Ema length
Notes:
This script also comes with an ema indicator based on obv for smoothing the obv signal since it gets noise at lower timeframes (by default comes disabled)
OBV information
www.investopedia.com
Comments:
This is my first script any ideas, suggestions, or detected errors (language/script) don´t hesitate to send a message.
Best regards, Mauro.

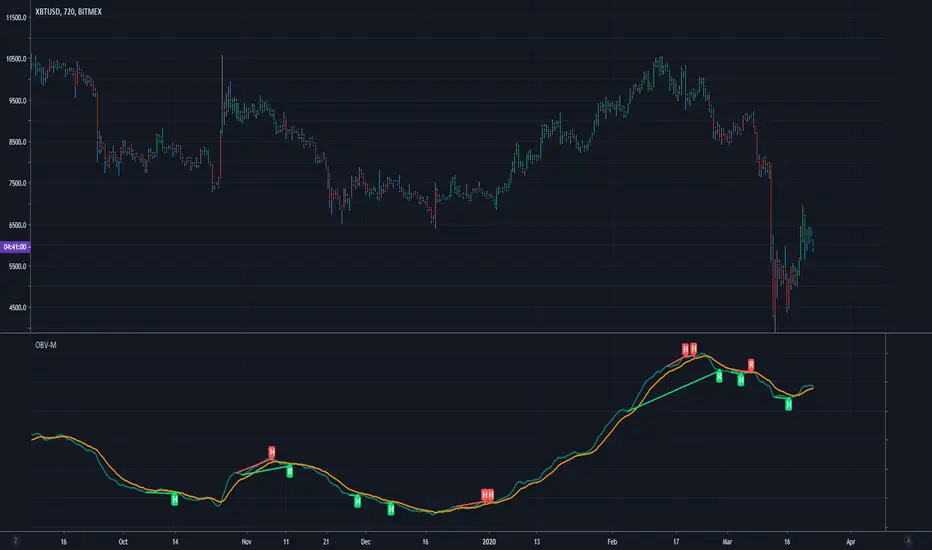
Modified OBV w/ Divergence Detection by CryptorhythmsApirine OBV-M Modified OBV w/ MA Selection by Cryptorhythms
Intro
Released in the April 2020 issue of TASC, and created by Vitali Apirine.
Description
OBV-M is of course based on the classic indicator on balance volume originally developed by Joe Granville. Apirine then smooths the calculation and adds a signal line to help denote entry and exit points.
As the author points out uts also great at showing divergences!
Extras
As usual when porting indicators to the library here on tradingview, I like to add some extra flare!
💠MA selection to allow you to experiment with alternate settings
💠Bar coloration based on trade state for easy visual at a glance chart checking
💠Divergence Detection and plotting thanks for Ricardo Santos' script
Enjoy!
👍 We hope you enjoyed this indicator and find it useful! We post free crypto analysis, strategies and indicators regularly. This is our 78th script on Tradingview!
Divergence OBV RSI[mado]Divergence screener for OBV RSI
Regular Bullish: "D" navy label
Hidden Bullish: "H" navy label
Regular Bearish: "D" red label
Hidden Bearish: "H" red label

OBV Divergence +This study Plots Divergences for OBV along with 2 MA's
Choose between standard type of OBV and OBV Accumulation / Distribution thanks to spacetrader which seems to be a truer reading
Divergence Alerts are provided so that you dont have to stare at your screen all day

On Balance Volume Oscillator Strategy [QuantNomad]Looking for the way to use OBV Oscillator in a strategy.
Here is my first try. I just enter to position of a cross of 2 emas based on OBV.
Here is my original oscillator indicator:
