Candle Range Trading (CRT) with Alerts
📌 Description:
The Candle Range Trading (CRT) indicator identifies potential reversal or continuation setups based on specific two-candle price action patterns.
It analyzes pairs of candles to detect Bullish or Bearish CRT patterns and provides visual signals (triangles) and alert notifications to support scalp or swing trading strategies.
🔍 How It Works:
🔻 Bearish CRT Pattern:
Candle 1 is bullish
Candle 2 is bearish
Candle 2's high > Candle 1's high
Candle 2 closes within Candle 1’s range
🔺 Red triangle above candle
🔺 Bullish CRT Pattern:
Candle 1 is bearish
Candle 2 is bullish
Candle 2's low < Candle 1's low
Candle 2 closes within Candle 1’s range
🔻 Green triangle below candle
📈 Visual Features:
🔺 Red triangle = Bearish CRT
🔻 Green triangle = Bullish CRT
📏 Optional box showing CRT High and CRT Low
🔔 Built-in Alerts:
Bullish CRT Alert: "Bullish CRT Pattern Detected"
Bearish CRT Alert: "Bearish CRT Pattern Detected"
Set alerts to get notified instantly when a pattern is detected.
⚠️ Note:
Use in conjunction with trend filters, support/resistance, or volume for best results.
Ideal for scalping or short-term trades.
Avoid trading in choppy or low-volume markets.
⚠️ Disclaimer:
This script was generated with the assistance of ChatGPT by OpenAI and is intended for educational and informational purposes only.
All strategies, alerts, and signals derived from this indicator should be thoroughly backtested and validated before using in live trading.
Trading involves substantial risk, and past performance is not indicative of future results. The author and ChatGPT bear no responsibility for any trading losses or financial decisions made using this script.
Users are solely responsible for the risks associated with their trading actions. Always apply proper risk management and perform your own due diligence before making any financial decisions.
Olhc

Open High Low StrategyThis is a very simple, yet effective and to some extend widely followed scalping strategy to capture the underling sentiments of the counter whether it will go up or down.
What is it?
This is Open-High-Low (OLH) strategy.
As you already aware of Candlestick patterns, there is patterns called as Marubozu patterns where the sell wick or buy wick either ceases to exists (or very small). This is exactly in the same principle.
In OLH strategy: The buy signal appears when the Open Price is the Low Price. It means if you draw the candlestick, there is no bottom wick. So after the opening of the candle, the demand drives the price up to the level, some selling may or may not come and closes in green. This indicates a strong upward biasness of the underlying counter.
Similarly, a sell signal appears when the Open price is the High Price. It means there is no upper wick. So there is no buying pressure, since the opening of the candle, sellers are in force and pulls down the price to a closing.
This strategy generates the signal at the close of the candle (technically barstate.isconfirmed). Because until the bar is real-time there is no option to know the final closing or high. So you will see the bar on which it generates the buy or sell signal is actually indicates the previous bar as OLH bar.
To determine the Stop-Loss, it uses the most widely known SL calculation of:
For buy signal, it takes the low of the last 7 candles and substract the ATR (Average True Range) of 14-period.
For sell signal, it takes the high of the last 7 candles and add it to the ATR (Average True Range) of 14-period.
One can plot the SL lines as dotted green and red lines as well to see visually.
Default Risk:Reward is 1:2, Can be customizable.
What is Unique?
Of course the utter simplistic nature of this strategy is it's key point. Very easy and intuitive to understand.
There are awesome strategies in this forum that talks about the various indicators combinations and what not.
Instead of all this, in a 15m NSE:NIFTY chart, it generates a good ~ 47% profit-factor with 1:2 Risk Reward ratio. Means if you loose a trade you will loose 1% of account and if you win you will gain 2%. Means 3 trades (2 profits and 1 loss) in a trading session result 3% overall gain for the day. (Assuming you are ready with 1% draw down of your account per trade, at max).
Disclaimer:
This piece of software does not come up with any warrantee or any rights of not changing it over the future course of time.
We are not responsible for any trading/investment decision you are taking out of the outcome of this indicator.

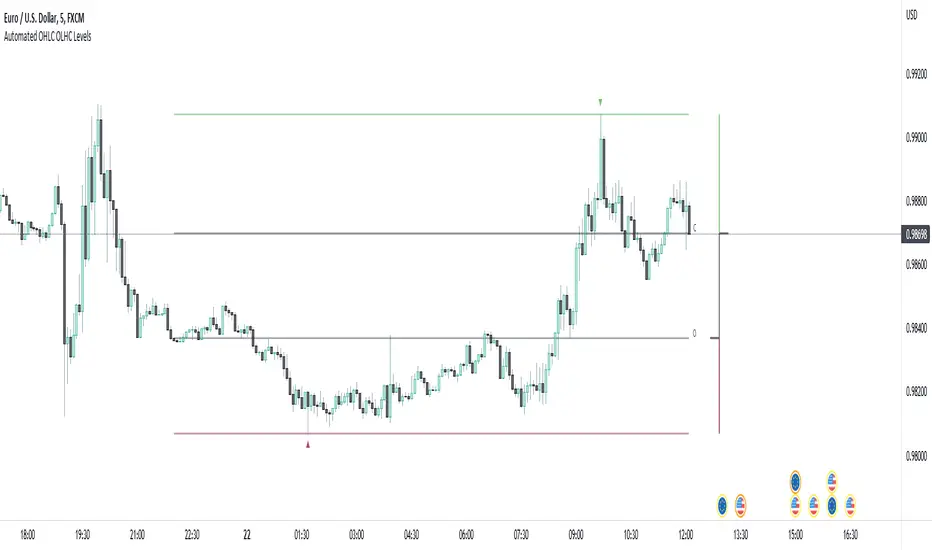
Automated OHLC OLHC LevelsA simple, clean, effective visualization tool, for the OHLC or OLHC of a chosen candle/timeframe.
Apply this indicator using a higher timeframe, in conjunction with other levels and the directional bias, to easily recognize trading opportunities at lower timeframes.