Daily lines (UTC)This is a simple script to add highlighted lines on the daily open.
It uses UTC as timezone.
Open

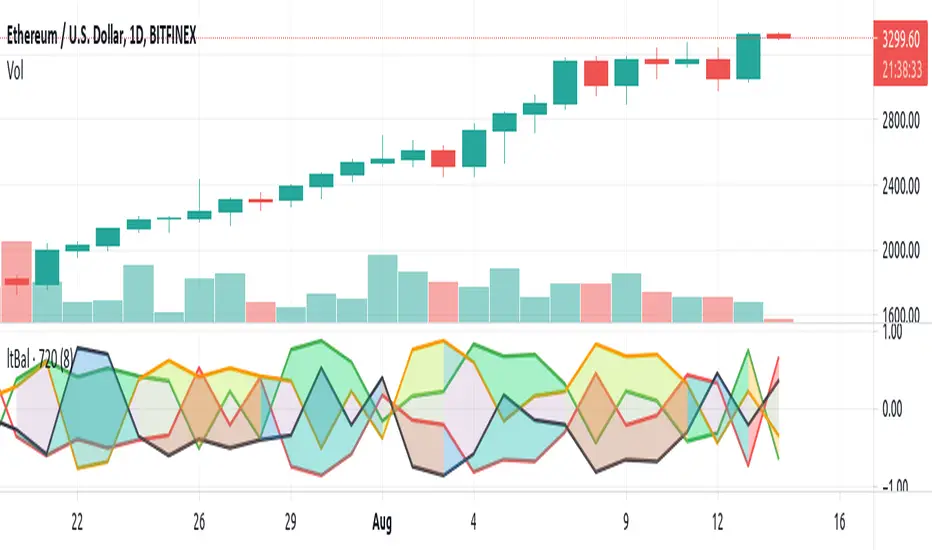
Light BalanceThe script is simple, going for a color scheme logic which tenderly avoids rigorous signals processing.
For the script to remain simple, logical derivatives are also out; as such, there are no secondary relations built off of primary ones. And it also ignores (unless you do this yourself) the logic in a varying order of lines.
Coloring has been done according to a limited set of relations between the four (4) plotted lines.
Quite a bit of information is capture, as you'll see when looking at line order, crossings, and transparency transitions and their patterns.
The approach makes the relations ones which can be learned over time; you become the algorithm to sort out signals. Ha ha. I know that sounds like a cop out doesn't it. Did I mention it's a simple script?
One thing you might want to play with right away are fills having red and green, and lime and fuchsia. It would be cool to reduce it all down to two (2) colors, but all the boolean relations might have to be listed, and it also may not be possible to cumulatively combine transparency overlays of the same value. Visually, that approach may not result to awaken a useful feature anyway. Also, fill() has its limitations in that it cannot be in a local scope; this includes function wrapped calls to fill(), or calls made using branching logic statements if/elseif, iff(), and var = (cond) ? t_val/exp : f_val/exp. So, to my knowledge, a fill() can not be made to be logically on/off.
Please, enjoy getting some use out of it.
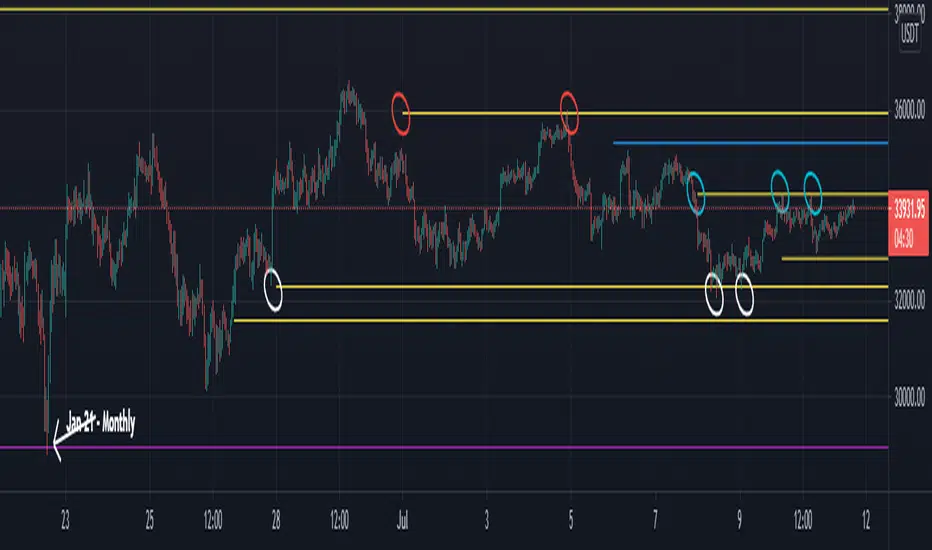
MTF Key Levels - Support and ResistanceThis indicator shows how to Multi Time Frame (MTF) interpret levels:
Watch how price acts around these levels and how they can act as support/resistance and can be used as great confluence levels for your technical analysis.
This indicator displays:
VWAP Levels
Daily / Weekly / Monthly / Yearly
Within the chart above I have marked out how displaying these VWAP levels can provide support and resistance levels to be aware of.
Daily – Weekly - Monthly – Yearly Levels
O = Open / H = High / L = Low
pO = Previous Open / pH = Previous High / pL = Previous Low / pEQ = Previous Equlibrium
Having previous Low/High levels makes you aware of Swing Failure Patterns (SFP). Also the daily/weekly/monthly opening and previous opening can assist with the trend.
Daily Open: Gives you an idea who is in control for the day. This level very often acts as strong support or resistance.
Weekly Open: Indicates where the price is within the higher timeframe.
Monthly Open & Yearly Levels: Overview of direction for the whole month without looking at a monthly chart and Yearly chart
Line Options
Within the line options you can choose to have a clean chart and display a “short line”. These line length can be adjusted by the user.
Line just to the right.
Line across the screen.
Disclaimer: The Monthly and Yealy VWAP will only show on higher timeframes this is due to restriction of how many candles can be shown on the chart. The candles displayed need to go back to either the start of the month of year to be able to calculate their VWAPs.

Daily Open Horizontal LineThis script draws a horizontal line that starts in the daily open (00:00 UTC)
Basically I did this since lots of times price come back down/up to the daily open and then bounces, meaning we can take trades based on this.
Hope you enjoy it.
PD: Took the code from infernix, all the credits to him, I know shit about coding.
Infernix TDV Profile: tradingview.com/u/infernixx
Naked - Daily Weekly MonthlyUser request for Naked Daily Weekly Monthly Opens.
This indicator plots the Daily Weekly Opens (the day after day after creation), they then will stay on the chart until a candle close is completed on the other side of the plot.
In the above chart picture you can see how previous monthly and daily opens have acted as support and resistance.
Thanks go to:
StackOverFlow Bjorn Mistiaen
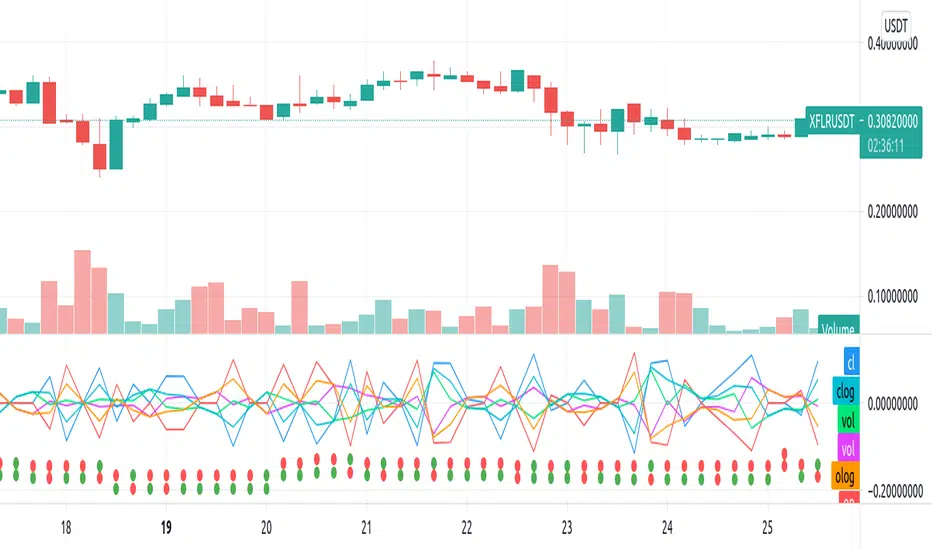
Repulsion: Price & Volume 1Repulsion: Price & Volume 1
www.quantamagazine.org
Proof of concept using the above link and comparisons of price and volume, and one of a series stemming from the so-called Repulsion Engine, now also open sourced, and other indicators from the workbench.
Traffic lights are not accurate.
Like it if you use it, drop a line if you update it -- or if you have comments about how to improve it.
Open Close Cross Strategy plus ExplorerOpen Close Cross Strategy plus Explorer
V 1.0
There is a code that can control sensitivity. try to change 'ATR Multiplier' menu
There is a code for prevent 'repaint'. If you want it check 'Forces Non-Repainting' menu
thanks to
PMax Explorer STRATEGY & SCREENER KivancOzbilgic
Open Close Cross Strategy R5 revised by JustUncleL JustUncleL

NSDT Daily Key LevelsSimple script to show key levels of current day and previous day. Labels can be turned on and off as needed. Line colors, thickness and style can be changed. Modified the "M/W/D Level" script from paaax. Credit for original code goes to him. Link to script and profile posted in code of this script.

Initial Balance Markets Time ZonesThe below script is based on Initial Balance.
Initial Balance is based on the highest and lowest points of Price Action (PA) within the first 60 minutes of trading. There is so much information available online, reference Initial Balance, that I have not provided a reference.
Most indicators I have seen have been solely based on UTC 0000 Initial Balance. My aim with this indicator was to be able to visualize how other time zones market openings Initial Balance affect PA.
The three market openings I chose to code in are:
London 0800 to 0900
New York 1430 to 1530
Asia 0000 to 0100
Within the script I have given the user the option to select to see with a green or red background when PA is above all zones Initial Balance high (green) or PA is below all zones Initial Balance low (red).
Alerts are also coded in, to prompt the user that PA has gone above or below as per above.
The Initial Balance high and lows also offer another form of areas of confluence.
Below are some examples of IB in action:
LTC
NULS
UNFI
DEXE

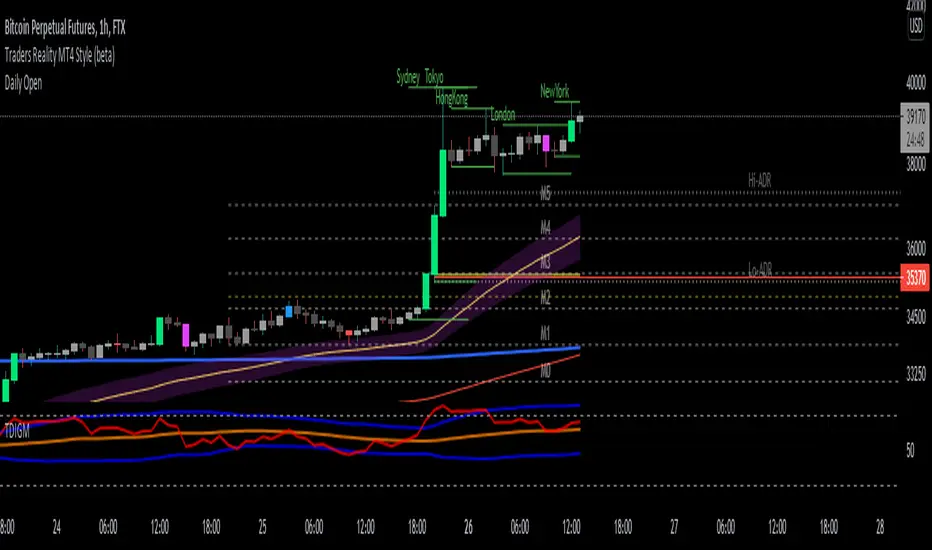
Pre and Market OpeningsPre and Market Openings is to enable you to quickly visualize the opening markets and how they could influence trading.
The below script has used the market time data from the below links:
Tokyo/Asia www.tradinghours.com
London www.tradinghours.com
New York www.tradinghours.com
The below script aims to plot:
Daily Asia Open
Weekly Asia Open
Daily London Open
Weekly London Open
Daily New York Open
Weekly New York Open
Using background colour it also shows market sessions (pre-market) for London and New York and regular for London, New York and Asia.
There is also plotted text for days of the week and sessions.
As you can see from the picture below that these market openings can act as support and resistance:
BTC
ETH

VFFVFluctuations to Volume desired to change the price.
to identifying which parameter of ask/bid (Technical ) or News (fundamental) parameters are changing the market I think this formula is enough !!!!
thanks for use and share your comments
Trading Ideas - Chart Champions Value - Points of Interest Trading Ideas is based on having visual Points of Interest.
The indicator displays:
- dOpen : Daily Open
- dPOC: Developing Point of Control
- pdPOC : Previous Day Point of Control
- dbyPOC : Day Before Yesterday Point of Control
Initial Balance (High, low, mid points for the first hour (UTC 0000)
- IB High : Initial Balance High
- IB Mid : Initial Balance Middle
- IB Low : Initial Balance Low
Chart Champions Value ( CCV ) is based on Daniel - Chart Champions theory explained in his educational videos.
That if the previous day is a range day and price action (PA) closes:
Above the previous days Value Area High (pdVAH) then there is an 80% chance of it retracing back to previous days Value Area Low (pdVAL)
Below the previous days Value Area Low (pdVAL) then there is an 80% chance of it going back up to the previous days Value Area High (pdVAH)
The CCV check can be ticked on and off for a quick visual to see if the setup could potentially be in play (if green then CCV could be play for that day).
Settings/Configuration
The calculated Value Area (VA) can be amended.
It is recommend to change the resolution to that of your symbol. For example BTC resolution 1, XRP resolution 0.00001.
As seen below having key Points of Interest can make you think twice before going into a trade:
My thanks go to:
ahancock for allowing usage of his script.
AnyDozer and Bjorn Mistiaen on Stack Overflow for all their assistance.
Any feedback will be gratefully received.

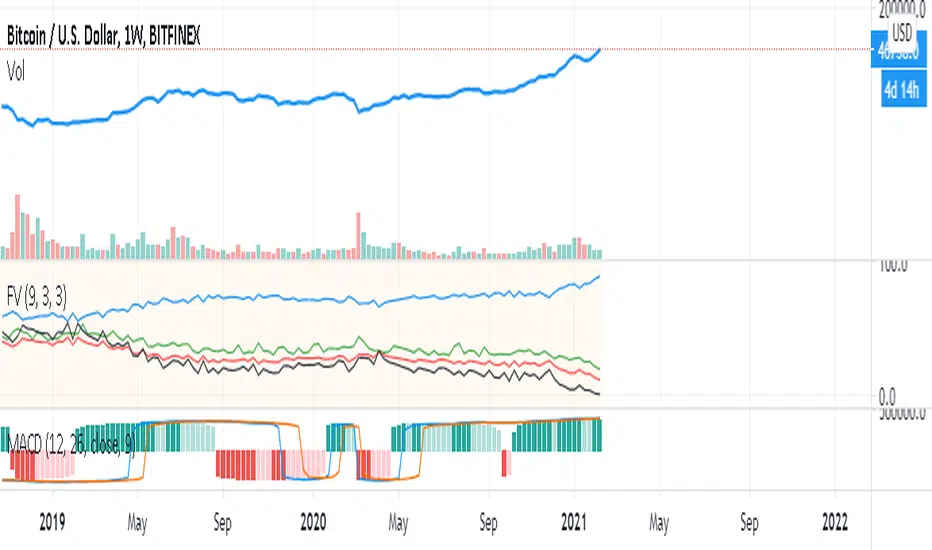
Combo VIX and DXYHello traders
It's been a while :)
I wanted to share a cool script that you can use for any asset class.
The script isn't really special - though what it displays is super helpful
Volatility Index $VIX
(Source: Wikipedia)
VIX is the ticker symbol and the popular name for the Chicago Board Options Exchange's CBOE Volatility Index, a popular measure of the stock market's expectation of volatility based on S&P 500 index options.
It is calculated and disseminated on a real-time basis by the CBOE, and is often referred to as the fear index or fear gauge.
I consider that a $VIX above 30% is a very bearish signal.
Above 30% translating investors selling in masse their assets. #blood #on #the #street
Dollar Index $DXY
(Source: Wikipedia)
The U.S. Dollar Index (USDX, DXY, DX, or, informally, the "Dixie") is an index (or measure) of the value of the United States dollar relative to a basket of foreign currencies, often referred to as a basket of U.S. trade partners' currencies.
The Index goes up when the U.S. dollar gains "strength" (value) when compared to other currencies.
The index is designed, maintained, and published by ICE (Intercontinental Exchange, Inc.), with the name "U.S. Dollar Index" a registered trademark.
It is a weighted geometric mean of the dollar's value relative to following select currencies:
Euro (EUR), 57.6% weight
Japanese yen (JPY) 13.6% weight
Pound sterling (GBP), 11.9% weight
Canadian dollar (CAD), 9.1% weight
Swedish krona (SEK), 4.2% weight
Swiss franc (CHF) 3.6% weight
In "bear markets", the $DXY usually goes up.
People are selling their hard assets to get some $USD in return - pumping the $DXY higher
Corollary
I'm not sure which one happens first between a bearish $DXY or bearish $DXY... though both are usually correlated
If:
- $VIX goes above 30%, usually $DXY increases and assets versus the good old' $USD drop
- $VIX goes below 30%, usually $DXY decreases and assets versus the good old' $USD increases
This is a nice lever effect between both the $VIX, $DXY and the assets versus the $USD
That's being said, I don't only use those 2 information to enter in a trade.
It gives me though a strong confirmation whenever I'm long or short
Imagine I get a LONG signal but the combo $VIX + $DXY is bearish... this tells me to be cautious and to:
- enter at a pullback
- protect my position quickly at breakeven
- take my profit quick
For a mega bull market (some called it hyperinflation), you want your fiat to drop in value for the counter-asset to increase in value.
And before you ask.... yes I look at what $DXY is doing before taking a trade on $BTCUSD :)
In other words, $DXY going down is quite bullish for Bitcoin.
Settings and Alerts
The settings by default are the ones I use for my trading.
The background colors will be colored whenever the COMBO is bullish (green) or bearish (red)
Alerts are enabled using the brand new alert function published last week by @TradingView
That's it for today, I hope you'll like it :)
PS: In this chart above, I'm using the Supertrend indicator from @KivancOzbilgic
Dave

Key Levels SpacemanBTC IDWMKey levels, plotted automatically
Additional timeframes can be added on request
Useful for seeing strength of the trend in the market


Yesterday's open, high, low and closeA very simple script to plot the yesterday's OHLC, to be used in an intraday graph.
There were other scripts like this, but their code was ugly, filthy, smelly, and WET, so I did this.

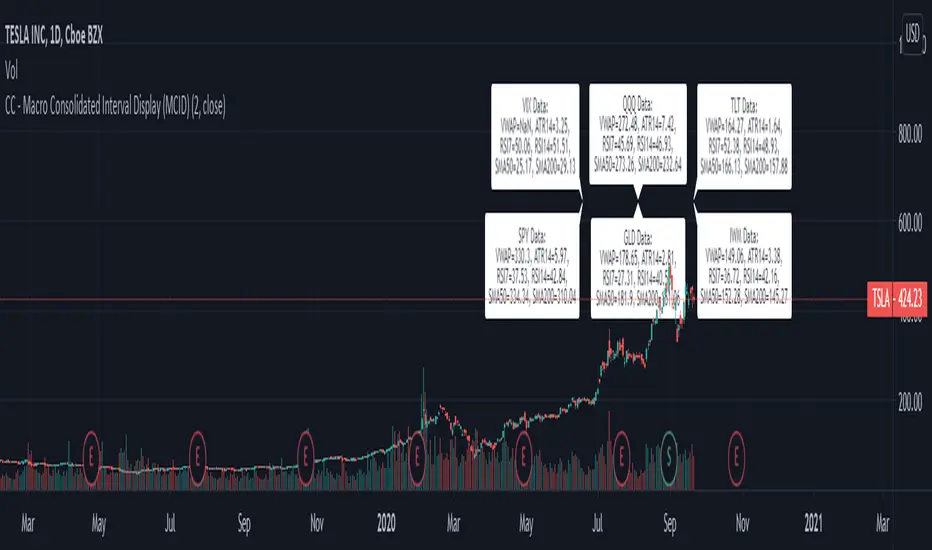
CC - Macro Consolidated Interval Display (MCID)Ever wish you didn't have to rapidly flip between 6 different tickers to get the full picture?
Yeah, me too. Do you also wish that you kind of understood how the shift / unshift function works for arrays?
Yeah, I did too. Both of those birds are taken care of with one stone!
The Macro Consolidated Interval Display uses the new Array structure and security to display data for VIX, GLD, TLT, QQQ, SPY and IWM (at a 1D interval) SIMUTANEOUSLY! Regardless of which ticker you're looking at you can get the full picture of macro futures data without flipping around to get it.
This is my first script trying to use arrays. It basically shows the following a 1d interval:
ATR14, RSI7, RSI14, SMA50, SMA200 and VWAP for VIX.
ATR14, RSI7, RSI14, SMA50, SMA200 and VWAP for GLD.
ATR14, RSI7, RSI14, SMA50, SMA200 and VWAP for TLT.
ATR14, RSI7, RSI14, SMA50, SMA200 and VWAP for QQQ.
ATR14, RSI7, RSI14, SMA50, SMA200 and VWAP for SPY.
ATR14, RSI7, RSI14, SMA50, SMA200 and VWAP for IWM
To make it more or less busy, I've allowed you to toggle off any of the levels you wish. I've also chosen to leave this as open source, as it's nothing too experimental, and I hope that it can gain some traction as an Array example that the public can use! If you don't like the different values that are shown, use this source code example as a spring-board to put values that you do care about onto the labels.
If this code has helped you at all please drop me a like or some constructive criticism if you do not think it's worth a like.
Good luck and happy trading friends. This should be compatible with my CID as well:
If this gets traction, I will post something similar for a dynamic combination of tickers and intervals that you can set yourself.
Highs Lows and OpensThis script is an update to a lovely script by BURSATRENDBANDCHART
There original script gave Daily, Weekly and Monthly Highs but I loved the format
I required
Previous Days Highs and Lows
Previous Week High and Low
Previous Day Open
Previous Week Open
Hope this can be of use

Static + Dynamic LevelsShows static and dynamic levels which can act as support/resistance. These are important as there is a lot of users who are interested in buying/selling at these prices.
Static Levels include -
Daily/Weekly/Monthly/Yearly Open (changes color depending on if below or above price)
Previous Daily/Weekly/Monthly/Yearly Open
Previous day's High/Low
Dynamic Levels include -
100/200 Daily MA
100/200 Weekly MA

ICT Killzone For Crypto Markets.Adjusted for Crypto 24/7 markets
Adjusted for UTC
i have hidden the asian open range and daily bars on my charts , you can choose to have them on
Less screen clutter
London Open 8:00 - 4:30 - Killzone 7:00 - 9:00
NewYork Open 9:30 - 4:00 Killzone 8:00 - 10:00
Shanghai open 9:15 Killzone 8:00 - 10:00
NOT MY ORIGINAL SCRIPT. JUST MODIFIED VERSION

NSDT Daily Gap RangeSimple script that plots the range between the previous day close and the current day open. This makes it easier to reference the gap up or gap down zone throughout the day.

Yearly OHLplots Yearly Open, High, Low levels
Interesting interactions to note at previous yearly opens

Custom Time ranges. Daily price ranges.Addition to previous time range script, now containing daily ranges. You can select a day of the week, and have it show the high, low, mid, and open of that day.
For the time bands:
Monday = 2
Tuesday = 3
Wednesday = 4
Thursday = 5
Friday = 6
Saturday = 7
Sunday = 1
Example 1:
1500-1800:2
This will colour the background between 3pm and 6pm on Mondays.
Example 2:
0000-0600:247
This will colour the background between midnight and 6am on Mondays, Wednesdays, and Saturdays.
For the Daily price ranges:
Just select the tick-box forthe day, and then the price levels you'd like to see.
I want to add specific weekly levels to this, for example: week 06 of year 2020, but I've not figured out how to do it yet. If anyone knows, I'd appreciate it if you let me know. I'll then update this script.
As always, any questions you may have, please leave in comments below and I'll respond when I have time.
If you notice anything good with this indicator, let me know. We are all in this to make money after all! ;)
