Opening Candle Zone with ATR Bands by nkChartsThis indicator highlights the opening range of each trading session and projects dynamic ATR-based zones around it.
Key Features
Plots high and low levels of the opening candle for each new daily session.
Extends these levels across the session, providing clear intraday support and resistance zones.
Adds ATR-based offset bands above and below the opening range for volatility-adjusted levels.
Customizable colors, ATR length, and multiplier for flexible use across markets and timeframes.
Adjustable session history limit to control how many past levels remain on the chart.
How to Use:
The opening range high/low often acts as strong intraday support or resistance.
The ATR bands give an adaptive volatility buffer, useful for breakout or mean-reversion strategies.
Works on any market with clear session opens.
This tool is designed for traders who want to combine session-based price action with volatility insights, helping identify potential breakouts, reversals, or consolidation areas throughout the day.
⚠️ Disclaimer: This indicator is for educational purposes only. It does not provide financial advice or guarantee profits. Always perform your own analysis before making trading decisions.
Opening-range-breakout

CP Strat ORBnew york opening range breakout and retest allows you to enter a trade with a better clarity if the price comes back and retest the range

Katalyst's Opening Range BreakoutKatalyst's Opening Range Breakout + No Trade Zone
📜 Overview:
This indicator allows traders to visualize the high and low of the opening range for a user-selected timeframe (e.g., 30s, 1m, 5m, 15m). It features fully customizable lines, labels, and an optional **No Trade Zone** fill to help you identify breakout levels with ease.
---
🎯 Key Features:
1. **Customizable Opening Range**:
- Select your preferred opening range duration: **30 seconds, 1 minute, 2 minutes, 5 minutes, 10 minutes, or 15 minutes**.
- The indicator calculates and plots the **high** and **low** of the selected opening range.
2. **Dynamic Line Styling**:
- Choose the **line color**, **transparency**, and **style**: **Solid, Dashed, or Dotted**.
- Lines extend to the right of the chart for clarity.
3. **No Trade Zone** *(Optional / Disabled by default)*:
- When enabled, fills the area between the high and low lines with a customizable **color and transparency**.
- Helps visually identify consolidation areas where trading might be avoided.
4. **Labels for Precision**:
- Clearly displays the **Opening Range High** and **Low** values.
- Labels are color-coded and positioned dynamically for easy interpretation.
5. **Clean and Efficient Updates**:
- The indicator deletes old lines, labels, and fills before creating new ones, ensuring a clutter-free chart.
---
⚙️ How to Use:
1. **Select Your Timeframe**:
- From the settings, choose your desired opening range duration: 30s, 1m, 2m, 5m, 10m, or 15m.
2. **Customize the Visuals**:
- Adjust line color, style, and transparency.
- Enable the **No Trade Zone** for a transparent background fill between the high and low lines.
3. **Interpret the Breakout**:
- Watch for price movements above or below the **opening range** to identify potential breakout opportunities.
---
🛠 Settings:
Opening Range Duration: Select the timeframe for the opening range (30s, 1m, 2m, 5m, 10m, 15m).
Line Color: Set the color of the range lines.
Line Transparency: Adjust the transparency of the lines (0 = solid, 100 = invisible).
Line Style: Choose line style: Solid, Dashed, or Dotted.
Label Colors: Customize the label colors for the high and low values.
Enable No Trade Zone: Fill the area between high and low lines with a transparent color.
No Trade Zone Color: Set the fill color for the no trade zone.
No Trade Zone Transparency: Adjust the transparency of the no trade zone fill.
---
📈 Ideal For
Day traders and scalpers looking to trade **breakouts**.
Traders who want to identify areas of consolidation visually.
Anyone who relies on the **opening range** for their trading strategy.
---
🔍 Example Usage:
Set the opening range to **5 minutes** and enable the **No Trade Zone** with a light red fill.
Watch for price to break above or below the high/low lines to signal potential trade opportunities.
---
✨ Why Use This Indicator?
This script simplifies your breakout strategy by providing a clear, visually appealing representation of the opening range. The flexible customization options and the optional **No Trade Zone** make it a powerful tool for identifying high-probability trades.
---
Let me know if you need any additional tweaks or clarifications for this description. It's all set to help traders understand and use your powerful script! 🚀📈

Fibonaci Opening Range Candle
Fibonacci Opening Range it is 50% and 0.61% of 5 min or 30min or 1 hour opening candle
search buying opportunities below 0.61
and selling opportunities above 0.50
Also acts as good support and resistance in intraday
BEST RESULTS IN INDEXES
Thanks & Best Regards
Marella Ganesh

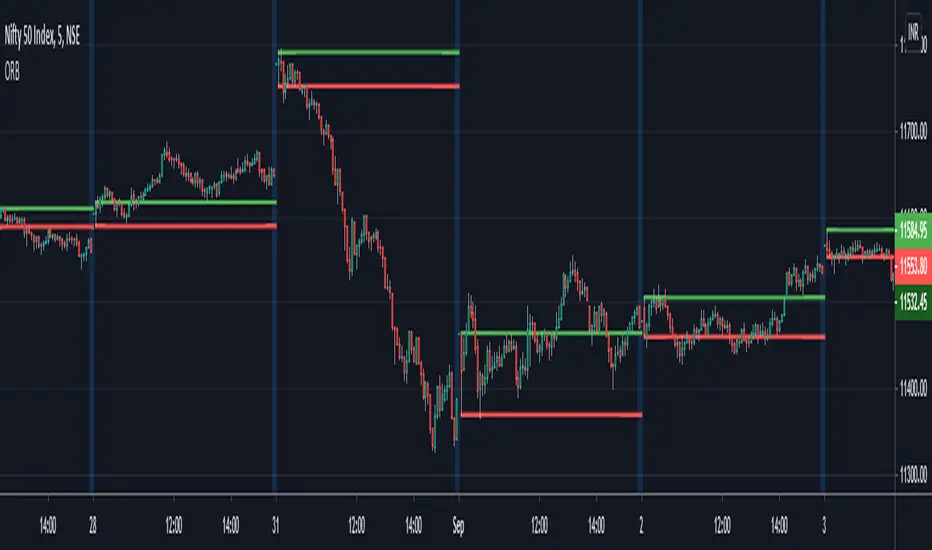
ORB - Opening Range BreakoutThis script plots the high/low of any custom session and extends it until the daily close. It does not show on the timeframe higher than the length of custom opening session by default.
The time period of opening range & the max timeframe to display it on can be adjusted from the settings.
So for eg. if want to use 5m ORB to trade, then set "ORB total time" as 5min & "Session Time" as whatever is the opening 5mins time period of ticker that are trading.
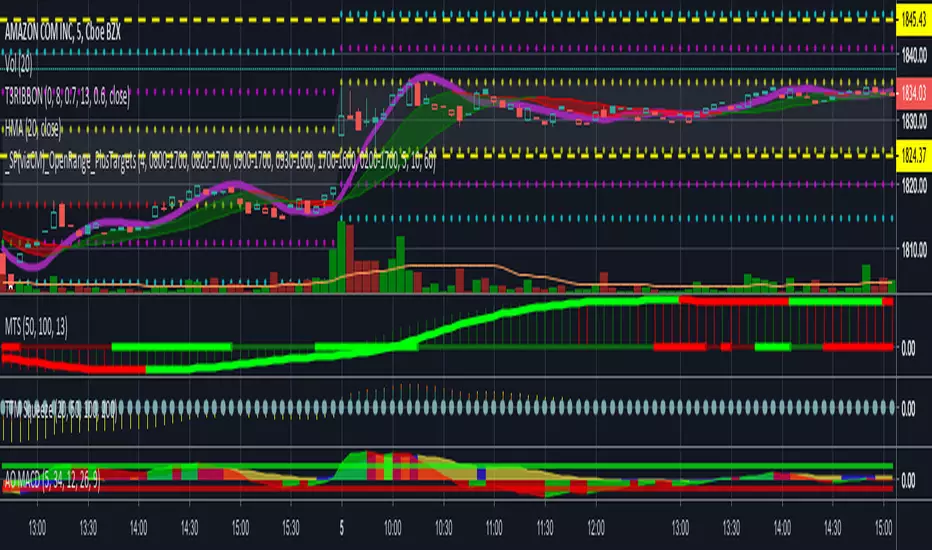
_SP(viaCM)_Opening-Range-FinalChris Moody's script. I just lessened the line/circle width, got rid of the highlighting overall, and reduced the highlighting between OR high and OR low.
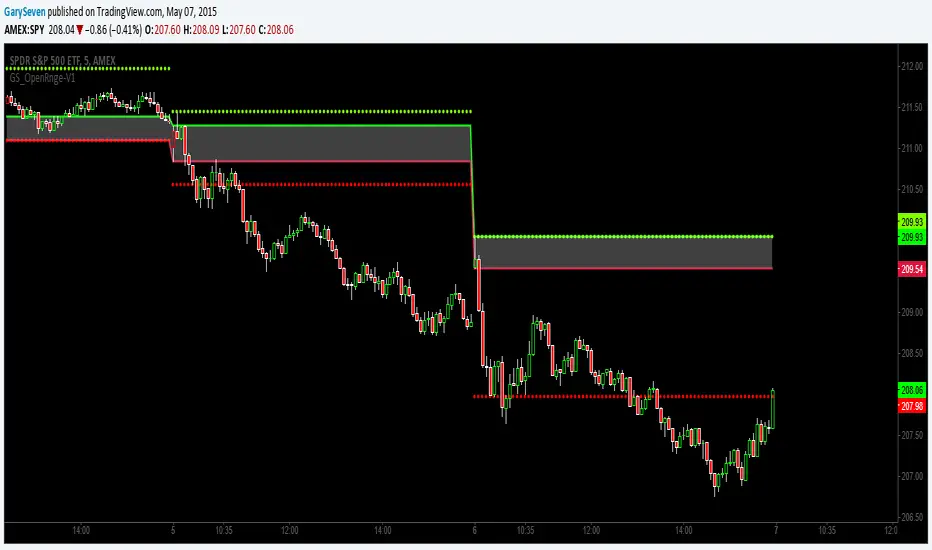
GS_Opening-Range-V1ORB Opening Range Breakout 5 and 3O Minute Indicator
Kudos to Chris Moody for the inspiration to create my first indicator.
The 5 and 30 run together at times but the scalp would be when the equity breaks the 5 go long or short for the scalp and when it breaks the 30 go for the swing trade.