Call Bear Spread indicatorCall bear spread indicator developed by Chobotaru Brothers.
You need to have basic knowledge in option trading to use this indicator!
This spread is a CREDIT SPREAD.
The indicator shows P&L lines of the options strategy. Use only for stocks since the mathematical model of options for Future instruments is different from stocks. Plus, the days' representation in futures is also different from stocks (stocks have fewer days than futures ).
***Each strategy in options is based on different mathematical equations, use this indicator only for the strategy in the headline.***
What does the indicator do?
The indicator is based on the Black-Scholes model, which uses partial differential equations to determine the option pricing. Due to options non-linear behavior, it is hard to visualize the option price. The indicator calculates the solutions of the Black-Scholes equation and plots them on the chart so traders can view how the option pricing will behave.
How the indicator does it?
The indicator uses five values (four dominants and one less dominant) to solve the Black-Scholes equation. The values are stock price, the strike price of the option, time to expiration, risk-free interest rate, and implied volatility .
How the indicator help the users?
-View the risks and rewards so you can know the profit targets in advance which means you can compare different options in different strikes.
-View the volatility change impact so you can know the risk and the P&L changes in case of a change in the volatility over the life of the option before you enter the trade.
-View the passage of time impact so you can know where and when you could realize a profit.
-Multi-timeframes so you can stay on the same chart (Daily and below).
All these features are to help the user improve his analysis while trading options.
How to use it?
The user needs to obtain from the “option chain” the following inputs:
- Call spread price (Credit): The credit received for one unit of options strategy.
-Instrument price when entered spread: the stock price when you enter the options strategy.
-Upper strike price: the upper strike price of the options strategy.
-Lower strike price: the lower strike price of the options strategy.
-Interest rate: find the risk-free interest rate from the U.S. DEPARTMENT OF THE TREASURY. Example: for 2% interest rate, input: 0.02.
-Days to expire: how many days until the option expires.
-Volatility: the implied volatility of the option bought/sold. Example: for 45% implied volatility , input: 0.45.
-Day of entry: A calendar day of the month that the option bought/sold.
-Month of entry: Calendar month the option bought/sold.
-Year of entry: Calendar year the option bought/sold.
-% of Max Profit/Loss: Profit/loss line defined by the user. Minimum input (-0.95) ; maximum input (0.95).
Example: In this spread, -0.95 means, 95% of the options strategy maximum loss is reached and, 0.95 means, 95% of the options strategy maximum profit is reached.
After entering all the inputs, press Ok and you should see “Calculation Complete” on the chart.
The user should not change the entry date and days to expire inputs as time passes after he entered the trade.
How to access the indicator?
Use the link below to obtain access to the indicator
Option

Call bull spread indicatorCall bull spread indicator developed by Chobotaru Brothers.
You need to have basic knowledge in option trading to use this indicator!
This spread is a DEBIT SPREAD.
The indicator shows P&L lines of the options strategy. Use only for stocks since the mathematical model of options for Future instruments is different from stocks. Plus, the days' representation in futures is also different from stocks (stocks have fewer days than futures ).
***Each strategy in options is based on different mathematical equations, use this indicator only for the strategy in the headline.***
What does the indicator do?
The indicator is based on the Black-Scholes model, which uses partial differential equations to determine the option pricing. Due to options non-linear behavior, it is hard to visualize the option price. The indicator calculates the solutions of the Black-Scholes equation and plots them on the chart so traders can view how the option pricing will behave.
How the indicator does it?
The indicator uses five values (four dominants and one less dominant) to solve the Black-Scholes equation. The values are stock price, the strike price of the option, time to expiration, risk-free interest rate, and implied volatility .
How the indicator help the users?
-View the risks and rewards so you can know the profit targets in advance which means you can compare different options in different strikes.
-View the volatility change impact so you can know the risk and the P&L changes in case of a change in the volatility over the life of the option before you enter the trade.
-View the passage of time impact so you can know where and when you could realize a profit.
-Multi-timeframes so you can stay on the same chart (Daily and below).
All these features are to help the user improve his analysis while trading options.
How to use it?
The user needs to obtain from the “option chain” the following inputs:
- Call spread price (Debit): The debit paid for one unit of options strategy.
-Instrument price when entered spread: the stock price when you enter the options strategy.
-Upper strike price: the upper strike price of the options strategy.
-Lower strike price: the lower strike price of the options strategy.
-Interest rate: find the risk-free interest rate from the U.S. DEPARTMENT OF THE TREASURY. Example: for 2% interest rate, input: 0.02.
-Days to expire: how many days until the option expires.
-Volatility: the implied volatility of the option bought/sold. Example: for 45% implied volatility , input: 0.45.
-Day of entry: A calendar day of the month that the option bought/sold.
-Month of entry: Calendar month the option bought/sold.
-Year of entry: Calendar year the option bought/sold.
-% of Max Profit/Loss: Profit/loss line defined by the user. Minimum input (-0.95) ; maximum input (0.95).
Example: In this spread, -0.95 means, 95% of the options strategy maximum loss is reached and, 0.95 means, 95% of the options strategy maximum profit is reached.
After entering all the inputs, press Ok and you should see “Calculation Complete” on the chart.
The user should not change the entry date and days to expire inputs as time passes after he entered the trade.
How to access the indicator?
Use the link below to obtain access to the indicator

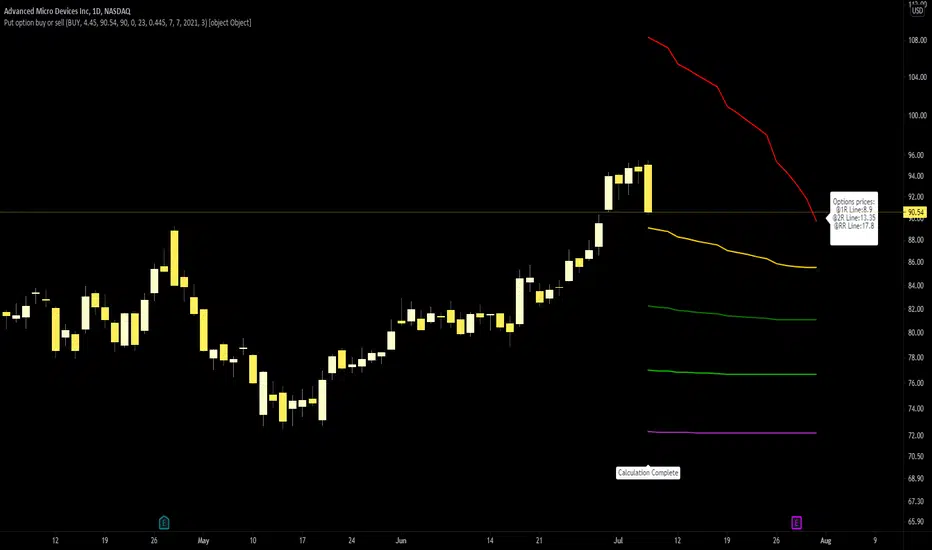
Put option buy or sell indicatorPut option indicator developed by Chobotaru Brothers.
You need to have basic knowledge in option trading to use this indicator!
The indicator shows P&L lines of the options strategy. Use only for stocks since the mathematical model of options for Future instruments is different from stocks. Plus, the days' representation in futures is also different from stocks (stocks have fewer days than futures ).
***Each strategy in options is based on different mathematical equations, use this indicator only for the strategy in the headline.***
What does the indicator do?
The indicator is based on the Black-Scholes model, which uses partial differential equations to determine the option pricing. Due to options non-linear behavior, it is hard to visualize the option price. The indicator calculates the solutions of the Black-Scholes equation and plots them on the chart so traders can view how the option pricing will behave.
How the indicator does it?
The indicator uses five values (four dominants and one less dominant) to solve the Black-Scholes equation. The values are stock price, the strike price of the option, time to expiration, risk-free interest rate, and implied volatility .
How the indicator help the users?
-View the risks and rewards so you can know the profit targets in advance which means you can compare different options in different strikes.
-View the volatility change impact so you can know the risk and the P&L changes in case of a change in the volatility over the life of the option before you enter the trade.
-View the passage of time impact so you can know where and when you could realize a profit.
-Multi-timeframes so you can stay on the same chart (Daily and below).
All these features are to help the user improve his analysis while trading options.
How to use it?
The user needs to obtain from the “option chain” the following inputs:
-Buy or sell (the strategy)
-The option price bought: at what price did you bought/sold one option.
-Instrument price when bought: the stock price when you bought/sold the option.
-Strike price: the strike price of the option.
-Interest rate: find the risk-free interest rate from the U.S. DEPARTMENT OF THE TREASURY. Example: for 2% interest rate, input: 0.02.
-Days to expire: how many days until the option expires.
-Volatility: the implied volatility of the option bought/sold. Example: for 45% implied volatility , input: 0.45.
-Day of entry: A calendar day of the month that the option bought/sold.
-Month of entry: Calendar month the option bought/sold.
-Year of entry: Calendar year the option bought/sold.
-Risk to reward: Profit/loss line defined by the user. Minimum input (-0.95) ; maximum input (3).
Example: If an option was bought, -0.95 means, 95% of the option value is lost (unrealized). If an option was bought, 3 means, the risk to reward is 3.
After entering all the inputs, press Ok and you should see “Calculation Complete” on the chart.
The user should not change the entry date and days to expire inputs as time passes after he entered the trade.
How to access the indicator?
Use the link below to obtain access to the indicator
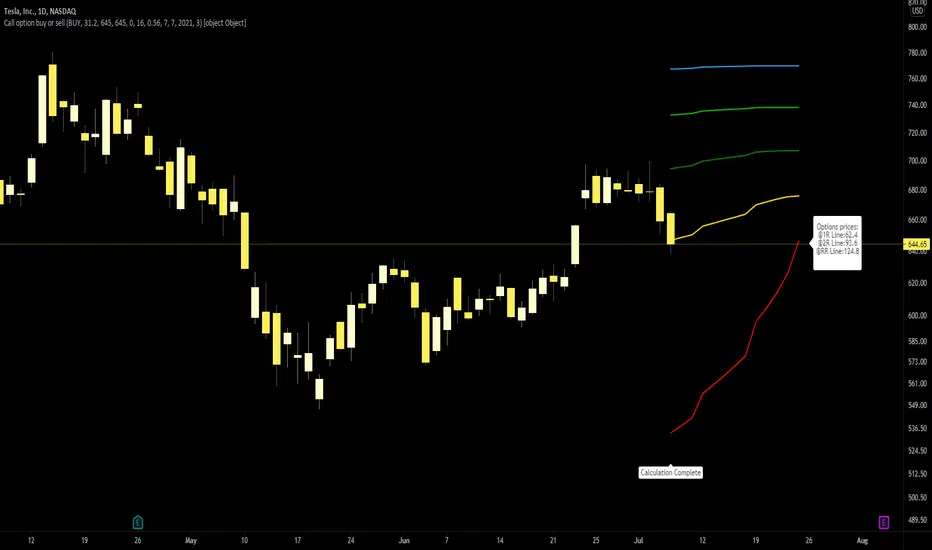
Call option buy or sell indicatorCall option indicator developed by Chobotaru Brothers.
You need to have basic knowledge in option trading to use this indicator!
The indicator shows P&L lines of the options strategy. Use only for stocks since the mathematical model of options for Future instruments is different from stocks. Plus, the days' representation in futures is also different from stocks (stocks have fewer days than futures ).
***Each strategy in options is based on different mathematical equations, use this indicator only for the strategy in the headline.***
What does the indicator do?
The indicator is based on the Black-Scholes model, which uses partial differential equations to determine the option pricing. Due to options non-linear behavior, it is hard to visualize the option price. The indicator calculates the solutions of the Black-Scholes equation and plots them on the chart so traders can view how the option pricing will behave.
How the indicator does it?
The indicator uses five values (four dominants and one less dominant) to solve the Black-Scholes equation. The values are stock price, the strike price of the option, time to expiration, risk-free interest rate, and implied volatility .
How the indicator help the users?
-View the risks and rewards so you can know the profit targets in advance which means you can compare different options in different strikes.
-View the volatility change impact so you can know the risk and the P&L changes in case of a change in the volatility over the life of the option before you enter the trade.
-View the passage of time impact so you can know where and when you could realize a profit.
-Multi-timeframes so you can stay on the same chart (Daily and below).
All these features are to help the user improve his analysis while trading options.
How to use it?
The user needs to obtain from the “option chain” the following inputs:
-Buy or sell (the strategy)
-The option price bought: at what price did you bought/sold one option.
-Instrument price when bought: the stock price when you bought/sold the option.
-Strike price: the strike price of the option.
-Interest rate: find the risk-free interest rate from the U.S. DEPARTMENT OF THE TREASURY. Example: for 2% interest rate, input: 0.02.
-Days to expire: how many days until the option expires.
-Volatility: the implied volatility of the option bought/sold. Example: for 45% implied volatility , input: 0.45.
-Day of entry: A calendar day of the month that the option bought/sold.
-Month of entry: Calendar month the option bought/sold.
-Year of entry: Calendar year the option bought/sold.
-Risk to reward: Profit/loss line defined by the user. Minimum input (-0.95) ; maximum input (3).
Example: If an option was bought, -0.95 means, 95% of the option value is lost (unrealized). If an option was bought, 3 means, the risk to reward is 3.
After entering all the inputs, press Ok and you should see “Calculation Complete” on the chart.
The user should not change the entry date and days to expire inputs as time passes after he entered the trade.
How to access the indicator?
Use the link below to obtain access to the indicator
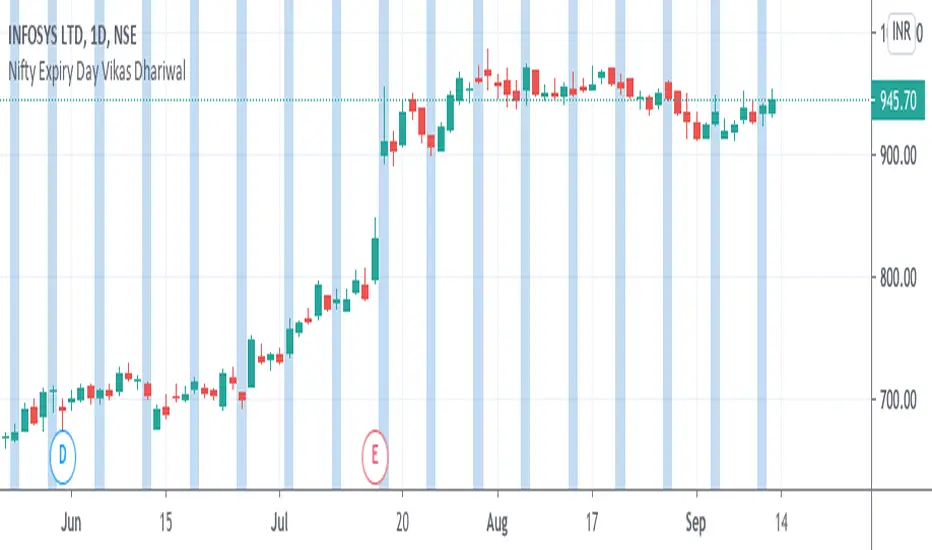
Nifty Expiry Day Vikas DhariwalStrategy for Expiry day plan
Here you can find easy expiry day of nifty and bank nifty
mark Thursday with color to find that day for test any expiry strategy plan
thanks call for more updated 8287335651
HV/IV Options Indicator - Muthu SThis HV/IV indicator helps you to select an opt Option Strategy. It creates 5 areas & each area defines the present status of the option premium, which varies from Very Low to Very High. From the bottom, (Option Premium is)
Area 1. Very Low
Area 2. Low
Area 3. Fair
Area 4. High
Area 5. Very High
Find which area, current Implied Volatility (User Input) belongs in & choose the option strategy accordingly. Implied Volatility is marked in Black colour circles.
Kindly note, Prior knowledge of Options, Volatility (Historical & Implied) is mandatory to use this indicator. This is shared for education purpose only.

Historical exponential volatilityIndicator of Historical volatility according to the exponential model with an additional moving average for CME , NYMEX futures
Window - the number of periods for calculating HV
WindowAdg - the number of periods for calculating the moving average for HV
Индикатор исторической волатильности по экспоненциальной модели с дополнительной скользящей средней. Оптимизирован под фьючерсы CME , NYMEX
Window - количество периодов расчета HV
WindowAdg - количество периодов расчета скользящей средней для HV

Commercial Short IndexThis script takes the hedger (commercial short) from the COT report and normalize the chart for configurable time frames (e.g. 26 weeks, 152 weeks and 260 weeks).
Based on the "Commercial Index-Buschi" script by MagicEins.

UCS-Probability to BounceHey All,
This is an indicator I was developing over the last year. Over some extreme testing and good test results. I am confident to add this to the pool of my indicators.
Yes, this is a protected script. Contains some intensive research.... and every value here is manipulated to fit a general context. Therefore, treat this just like any of my indicator.
If you want to know further about how i use. comment below......

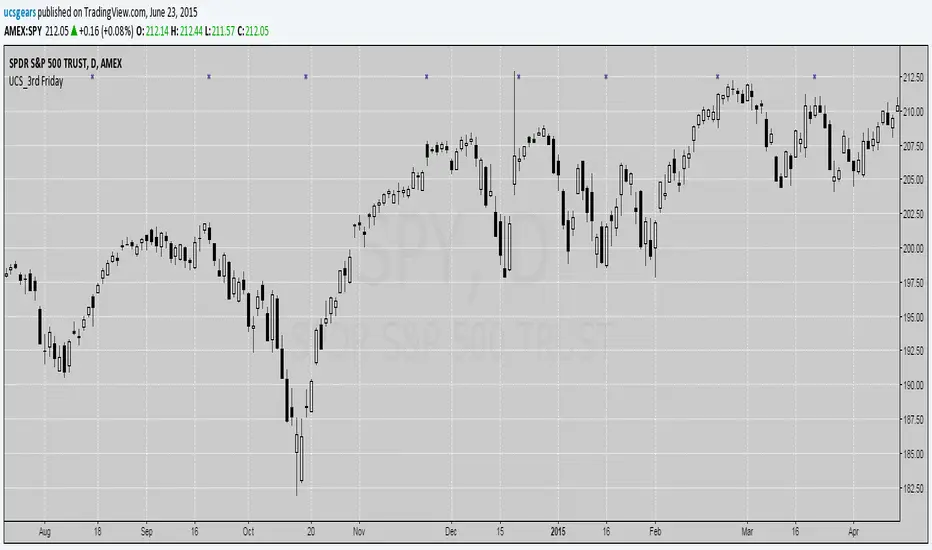
UCS_3rd FridaySimple script to show you a way to find 3rd Fridays (Monthly Options Expiry)
If that friday is a holiday, then it doesn't generate a signal. Futures & Forex trader need not to worry. I will fix it for the stock traders as well. Time is all I need.
as usual Good Luck for those who believe in it. Practice for those who believe in hard work. Think for those who believe in smart work. ;)
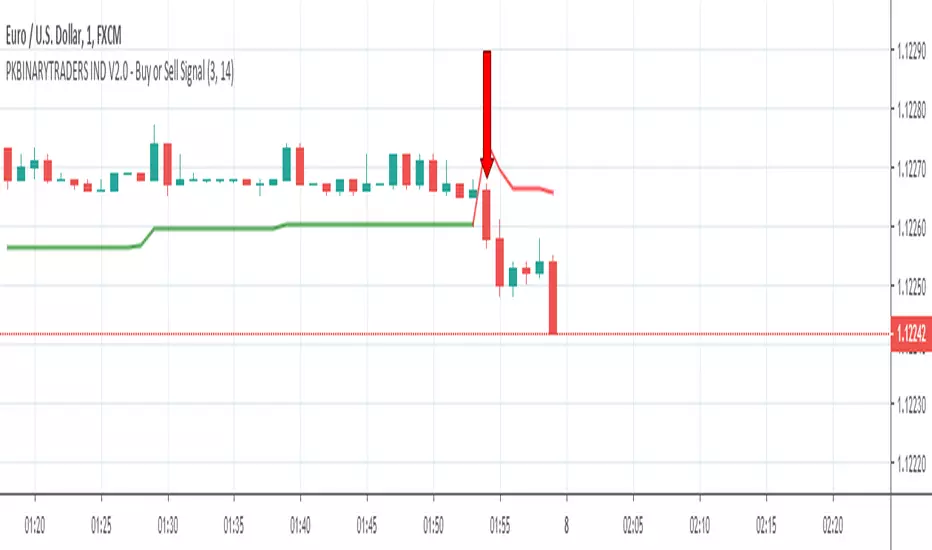
Binary Option Arrows (example) [TheMightyChicken]An example of binary option arrows for candlestick patterns bearish and bullish harami. With results as colored background and an option to choose your expiration (one candle by default). It's just an example for those who has their own strategy and wants to make nice arrows in their chart. All you need to do is rewrite piece of script in lines 9:13 - feel free to ask me for any help, but I believe it's all clear.
Disclaimer: It's just an example how to script arrows for binary option and I am not responsible for any loss of money by using this particular strategy.
I wish happy and successful trading! ;)

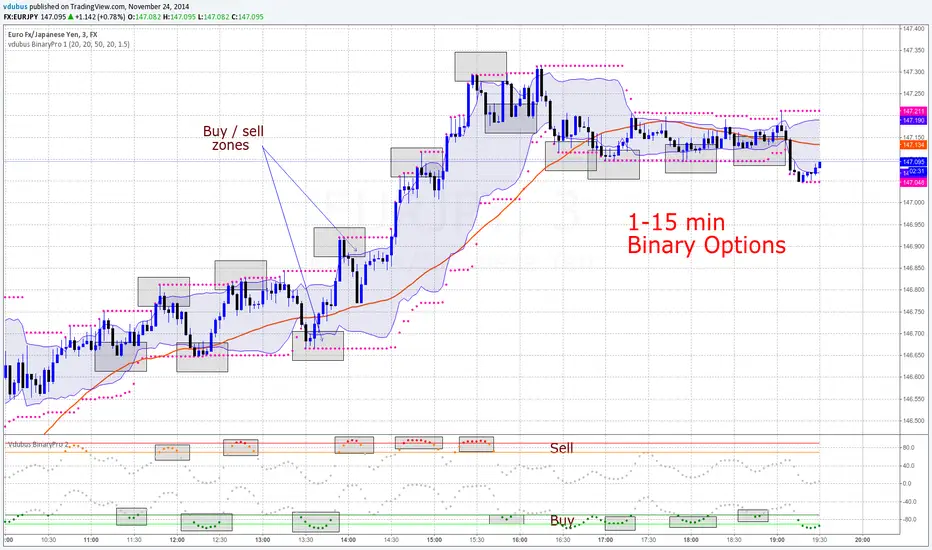
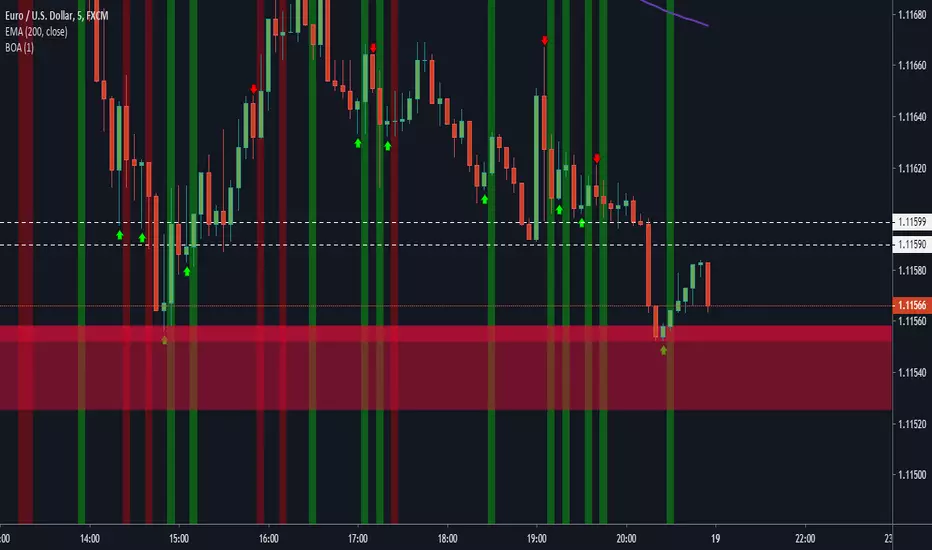
vdubus BinaryPro - Indicators 1 & 2For both scripts - Go to 'MAKE IT MINE'
Modified scripts for Binary trading 1- 3 min charts / 5 -15 min intervals
vdubus BinaryPro 1
Vdubus BinaryPro 2
------------------------------
Vdubus BinaryPro Money Management Strategy: $10 - $50,000 in 15 trades
Tip * break consecutive trades down to lots of 5 compounded / repeat to build up a solid equity foundation., then move on the the next 5 x 3 = 15
if you lose one trade out of the 5, restart the proses. You only ever lose the initial trade size you started with * DOUBLE YOUR WINNINGS NOT YOUR LOSSES !
If you struggle to win 5 compounded trades in a row, compound 2 or 3 trades at a time
drive.google.com