AlgoIndex - All Stages (AM & Mid-Day Long/Short)Scope (read first)
ES1! on 5-minute only. The strategy backtests ES fills; alerts can post JSON messages to a Webhook URL you configure. Exits are target-based with ITTC - if ES touches target intra-bar, an exit alert is sent immediately. No fixed ES stop-loss. Positions can also exit at scheduled time-based safety closes (session end, holiday/half-day, or expiration end). You can always close manually.
What this is
One intraday engine with four session presets (“Stages”). Stages only change session windows, trade side, and a few risk/confirmation governors—the core logic is the same. Single invite-only listing; not a multi-post suite.
How it trades
Opening Range (OR): Each Stage begins with a short OR at its session start; that Stage won’t take entries until its OR closes.
VWAP alignment: Trade with flow. Price must align with VWAP (simple pass/fail; optional gap offset).
Real breakouts only: A composite “impulse” check looks for volume expansion, recent momentum, ATR-scaled range, body/range quality, and a clean OR break (or a gap-aware extension).
Entry & target: Entries occur on the signal bar’s close; targets are set in underlying (ES) units.
ITTC (close on touch): If ES touches target intra-bar, ITTC sends a one-shot exit.
Adds (preset by Stage): S1/S2/S3 allow up to two adds on defined ES retraces; S4 disables adds. Adds use a fixed scale-out policy handled internally—no user input required.
Time-based safety closes: At the configured session end (and on holiday/half-day or expiration when applicable), any open position is closed. These are time exits, not price stops.
Why traders use it
A progressive filter for intraday continuity: OR context → VWAP alignment → authentic breakout (impulse) → ITTC to sync ES triggers with options execution. Stage-governed adds keep scaled positions coherent from open to close.
Stages (session templates; one engine)
S1 — 09:30–11:20 NY, Long-only. Standard impulse; adds ON.
S2 — 09:30–11:30 NY, Short-only. Tighter breakout standard; adds ON.
S3 — 11:15–15:15 NY, Long-only. Trade-protection ON; slightly lower underlying target; adds ON.
S4 — 11:30–14:30 NY, Short-only. Alternative trigger governor; slightly lower underlying target; adds OFF.
You can replicate any Stage via session times, side, and thresholds; presets exist for convenience and auditability.
Public inputs (what you can adjust)
Contracts (order size)
TP (Underlying) and TP (Options)
Trade Limiter (toggle) + Max profitable trades per session
Session settings: Exchange Day Session times, optional Custom Time Zone, Session 1 times, optional Session 2, and day-of-week checkboxes
Visual overlays (display-only): VWAP, Prior-Day High/Low, Session High/Low, Round Numbers, Bias Banner, Trade Markers
Display: Inputs in status line
Alerts (how to use)
Create an alert on this strategy and select “Any alert() function call.” (Optional) add a Webhook URL you control to receive the JSON the script sends. Leave Message empty.
Backtest vs options (read carefully)
Backtests show ES fills on 5-minute bars; options pricing (IV, DTE, spreads, partial fills) isn’t simulated. Because live execution uses options, ES PnL is a directional proxy only.
Evaluate quality via: trade count (target ≥100), win rate, average time-in-trade, MAE/MFE, and holding-time distribution. Do not read ES $ PnL as expected options returns—actual options outcomes depend on strike/DTE, IV regime, spreads, and execution.
Defaults used in this publication (match these before interpreting results)
Dataset: last 12–24 months of ES1! 5-minute RTH (to ensure ≥100 trades)
Initial capital: $25,000
Commission: $1.00 per order per contract (≈ $2 round-trip)
Slippage: 1 tick
Order size: 1 contract; pyramiding only for Stage-governed adds
No fixed ES stop-loss; exits are target-based with ITTC and scheduled safety closes
Operating notes
ES1! symbol only; 5-minute resolution only
You can run multiple Stages in parallel via separate tabs/alerts; if you want a single net position across Stages, enforce it in your own tooling (e.g., ignore new orders while a position is open)
Use a clean chart when publishing (only this strategy active)
Keep results separate by using four TradingView tabs (one per Stage)
Disclosures
Educational research tool, not financial advice. Past or hypothetical performance does not guarantee future results. Trading involves risk, including the risk of loss. Test thoroughly and use at your own discretion.
Optionsstrategies

ChopFlow ATR Scalp StrategyA lean, high-velocity scalp framework for NQ and other futures that blends trend clarity, volume confirmation, and adaptive exits to give you precise, actionable signals—no cluttered bands or lagging indicators.
⸻
🔍 Overview
This strategy locks onto rapid intraday moves by:
• Filtering for directional momentum with the Choppiness Index (CI)
• Confirming conviction via On-Balance Volume (OBV) against its moving average
• Automatically sizing stops and targets with a multiple of the Average True Range (ATR)
It’s designed for scalp traders who need clean, timely entries without wading through choppy noise.
⸻
⚙️ Key Features & Inputs
1. ATR Length & Multiplier
• Controls exit distances based on current volatility.
2. Choppiness Length & Threshold
• Measures trend strength; only fires when the market isn’t “stuck in the mud.”
3. OBV SMA Length
• Smoothes volume flow to confirm genuine buying or selling pressure.
4. Custom Session Hours
• Avoid overnight gaps or low-liquidity periods.
All inputs are exposed for rapid tuning to your preferred scalp cadence.
🚀 How It Works
1. Long Entry triggers when:
• CI < threshold (strong trend)
• OBV > its SMA (positive volume flow)
• You’re within the defined session
2. Short Entry mirrors the above (CI < threshold, OBV < SMA)
3. Exit uses ATR × multiplier for both stop-loss and take-profit
⸻
🎯 Usage Tips
• Start with defaults (ATR 14, multiplier 1.5; CI 14, threshold 60; OBV SMA 10).
• Monitor signal frequency, then tighten/loosen CI or OBV look-back as needed.
• Pair with a fast MA crossover or price-action trigger if you want even sharper timing.
• Backtest across different sessions (early open vs. power hours) to find your edge.
⸻
⚠️ Disclaimer
This script is provided “as-is” for educational and research purposes. Always paper-trade any new setup extensively before deploying live capital, and adjust risk parameters to your personal tolerance.
⸻
Elevate your scalp game with ChopFlow ATR—where trend, volume, and volatility converge for clear, confident entries. Happy scalping!

Support Resistance Pivot EMA Scalp Strategy [Mauserrifle]A strategy that creates signals based on: pivots, EMA 9+20, RSI, ATR, VWAP, wicks and volume.
The strategy is developed as a helper for quick long option scalping. This strategy is primarily designed for intraday trading on the 2m SPY chart with extended hours. However, users can adapt it for use on different symbols and timeframes. These signals are meant as a helper rather than fully automated trading bots.
One of the key elements is its pivot-based calculation, driven by my integrated indicator "Support and Resistance Pivot Points/Lines ". It enables multi-timeframe pivot calculations which are used to generate the signals and offers customizability, allowing you to define rounding methods and cooldown periods to refine pivot levels. The pivots, in combination with EMA crossovers, VWAP trend, and additional filters (RSI, ATR, VWAP, wicks and volume), create an entry and exit strategy for scalping opportunities that is useful for 0/1 DTE options with an average trade time of six minutes with the default setup for SPY. Option trading should be done outside TradingView. At this moment of release there is no option trading support.
All parameters used in the strategy are tweaked based on deep backtests results and real-time behavior. Be mindful that past performance does not guarantee future results.
The strategy is designed for intermediate and advanced users who are familiar intraday option scalping techniques.
How It Works
The strategy identifies entries based on multiple conditions, including: recently above pivot, recent EMA crossovers, RSI range, candle patterns, and VWAP uptrend. It avoids trades below the VWAP lower band due to poor backtesting results in those conditions. It creates a great number of signals when it detects an uptrend, which entails: VWAP and its lower/upper band slopes are going up, and the number of next high pivot points is greater than the number of lower pivot points. This indicates that we hope it will keep going up. In historical testing, this showed favorable results. This uptrend criteria runs on 15m charts max (where up to the VWAP effectiveness is the greatest).
The strategy also checks for candle and volume patterns, identified in backtesting to improve entry levels on historic data. Which include:
A red candle after multiple green ones, hoping to jump on a trend during a small pullback
Zero lower wick
Percentage and volume is up after lower volume candles
Percentage is up and the first and second EMA slopes are going up
Percentage is up, the first EMA is higher than the second, the price low is below the second EMA and price close above it
The VWAP uptrend overrules the candle and volume conditions (thus lots of signals during those moments).
The above is the base for many signals. There is a strict mode that adds extra checks such as:
not trading when there is no next low or high pivot
requiring a VWAP uptrend only
minimum candle percentages
This mode is for analyzing history and seeing performance during these conditions. It is worth it to create a separate alert for strict mode so you are aware of these conditions during trading.
When no stop has been defined, exits will always happen on pivot crossunder confirmations. If a stop is defined (default config), the strategy exits a position when:
the position is negative or no trail has been set
at least 1 bar has past
OR no stop has been defined (overrules previous)
trail has not been activated
The second exit condition happens when the close is below first EMA(9 by default) and when:
the position has been above first EMA
the gap between close and last pivot isn't small
the position is negative or no trail has been set
OR no stop has been defined (overrules above)
trail has not been activated
There are some more variations on this but the above are the most common. These exit conditions are a safety net because the strategy heavily relies on and favors stops. The settings allow changing stops, profit takers and trails. You can configure it to always sell without the conditions above.
The script will paint the pivot lines, trailing activation/stops, EMAs and entry/exits; with extra information in the data panel. For a complete view add VWAP and RSI to your chart, which are available from TradingView official indicator library. The strategy will not rely on those added indicators since VWAP and RSI are programmed in. You can add them to track the behavior of the signals based on these filters you have configured and have a complete view trading this strategy.
As mentioned earlier, the default settings are built for SPY 2m charts, with extended hours and real-time data. Open the strategy on this chart to study how all input parameters are used. If you don't have real-time data you need to adjust the minimum volume settings (set it to 0 at first).
The backtest
The default backtest configuration is set up to simulate SPY option trading.
Start capital is set to 10,000 and we risk around 5% of that per trade (1 contract)
Commission is set to 0.005%. The reason: at the time of this publication the SPY index price is approximately $580. Two ITM 0/1 DTE options contracts, each priced around $280, which is approximately $560. The typical commission for such a trade is around $3. To simulate this commission in the backtest on the SPY index itself, a commission of 0.005% per trade has been applied, approximating the options trading costs.
Slippage of 3 is set reflecting liquid SPY
The bar magnifier feature is turned on to have more realistic fills
Trading
In backtesting, setting commission and slippage to 0 on the SPY 2m chart shows many trades result around breaking even. Personally, I view them as an opportunity and safety net to help manage emotional decisions for exits. The signals are designed for short option scalps, allowing traders to take small profits and potentially re-enter during the strategy’s position window. It's advisable to take small potential profits, such as 4%, whenever the opportunity arises and consider re-entering if the setup still looks favorable, for example price still above ema9. Exiting a long position below ema9 is a common strategy for 2m scalping.
The average trade duration is approximately 6 minutes (3 bars). The choice between ITM (in-the-money), ATM (at-the-money), or OTM (out-of-the-money) options will depend on your trading style. Personally, I’ve seen better results with ITM options because they tend to move more in sync with the underlying index, thanks to their higher delta.
It’s important to note that the signals are designed to be a helper for manual trading rather than to automate a bot. Users are encouraged to take small profits and re-enter positions if favorable conditions persist. Be mindful that past performance does not guarantee future results.
For the default SPY setup the losses will mostly be 4-10% for ITM options. Be mindful of extreme volatile conditions where losses may reach 30% quickly, especially when trading ATM/OTM options.
The following settings can be changed:
8 pivot timeframes with left/right bars and days rendered
Here you can configure the timeframes for the pivots, which are crucial. The strategy wants that a crossover has happened recently (so it might enter after a crossunder if the crossover was recent) or the price is still above the crossed pivot.
When you decide to use a pivot timeframe higher than your chart, make sure it aligns the same starting point as the chart timeframe. As stated in the 43000478429 docs, there is a dependency between the resolution and the alignment of a starting point:
1–14 minutes — aligns to the beginning of a week
15–29 minutes — aligns to the beginning of a month
from 30 minutes and higher — aligns to the beginning of a year
This alignment also affects the setting of rendered days. I recommend a max value of 5 days for 1-14 minutes timeframes.
Also make sure a higher pivot timeframe can be divided by the lower. For instance I had repaint issues using 3m pivots on a 2m chart. But 4m pivots work fine.
Please look up docs 43000478429 to make sure this information is still up to date.
Pivot rounding
The pivot rounding option is used to add pivots based on a rounded price and limit the number of pivots. While this feature is disabled by default it can be useful with tweaking strategy variations, because many orders are placed at rounded levels and tend to act as strong price barriers.
There are multiple rounding methods: round, ceil/floor, roundn (decimal) and rounding to the minimal tick.
The next feature is a powerful extension called "Cooldown rounding":
Pivot cooldown rounding
This rounds new pivot levels for a cooldown period to keep the previous pivot line instead of adding a new line when they match the rounded value within the cooldown period. The existing line will be extended. This feature is useful because it makes sure the initial line is added to the exact high/low pivot level but any future lines within the rounding will just extend the existing line. This limits the number of pivots while still having precise levels (which normal rounding lacks) and allows more precise pivot trading.
This feature also helps ensure that the number of rendered lines will not exceed 500 too much, which is the render limit on TradingView.
You can set a maximum minutes for the cooldown. The default is 3 years which will enable the cooldown rounding permanently on the intraday (due to the max bar limit).
Pivot always added when new higher/lower pivot
When using cooldown rounding, one may find it useful to override this behavior when a new lower or higher pivot level has been reached. When enabled the new level will be added despite the fact that they may be rounded the same in the cooldown check. This is a good balance between limiting pivots but also allowing preciser trading.
VWAP bands multiplier
This is used to tweak the inner VWAP working for the upper and lower band. The default VWAP multiplier (0.9) is set based on backtesting since it performed better on historic data (the strategy does not trade below the lowerband). When you add the VWAP indicator from the TradingView library to the chart, make sure it uses the same multiplier setting as within this strategy so you have a correct view of the conditions the strategy acts on.
ATR EMA smoothing length
Used to tweak the ATR EMA smoothing. By default it is set up to 4 based on deep backtesting historic data.
EMA lengths
Changing the EMA length allows you to fine tune the EMA crossing behavior. By default the strategy is set up to EMA 9 and 20 which are considered commonly used values on the 2-minute chart.
Trading intraday time restrictions
For intraday charts you can configure when the strategy starts trading after market open and when it stops, including a hard sell. This makes sure there are no open positions left for the day during backtesting and can also aid in your trading style. For example some scalpers will not trade in the first two hours. Having no signals during this time can be beneficial. It is possible to configure these settings based on the number of bars or minutes.
Not trading on days the market closes earlier
By default the strategy does not trade on days the market closes earlier in the US. This makes sure there are no open positions left open during backtesting. Make sure to change it when using it on such a day. The days are: day before independence day, day after thanksgiving, Christmas eve and new years eve.
Not trading below VWAP lowerband
Backtesting has shown poor performance when trading below the VWAP lowerband but you are free to allow it to trade in such conditions. Past performance does not guarantee future results.
Minimum volume
A minimum volume can be set up. The current value is based on better deep backtest results for SPY using real-time data (48000). When you do not have a data plan for SPY, please set it to 0 and tweak based on backtests.
Minimum ATRP
The strategy has shown during my trading that it is sensitive to higher ATRP values and more volatile market conditions. There is more chance the index moves and we can profit from this during option scalping (if it moves in your favor). The default is based on SPY backtesting (0.04%), as a balance to have a lot of trades but also capture minimal movement.
RSI range
A RSI range can be set using a minimum and maximum value so we can limit trading during overbought/oversold conditions. Backtesting for SPY has shown the strategy performs better on historic data within a tighter range, so a default range has been set to 40-65.
Allow orders on every tick (no effect on stop/profit/trail)
This setting is used to allow orders on every tick. The strategy has been developed without trading on every tick but you can change this, for example when you have configured a setup different than the default configuration that you know works well with this. The default setup will not work well with it due to too many constant signals.
Stop percentage + ATRP threshold
One of the most important settings for managing the risk. I recommend setting a stop percentage first and later the ATRP threshold where the stop is calculated based on the current ATRP value. The calculated value will only be in effect when it is greater than the normal stop--the normal stop acts as baseline. The default stop is low (0.03). With a default ATRP threshold stop of 1.12, the calculated value overrules the normal stop when the value is greater. 0.03 acts as a minimum value but in reality the stop will most likely be higher on average for SPY with the default ATRP threshold.
For the default SPY setup the losses will be around 4-10% for ITM options. Be mindful of extreme volatile conditions where losses may reach 30% quickly, especially when trading ATM/OTM options.
Profit taker percentage + ATRP threshold
Same principles as the stop percentage above, but for profit taking. There is a very high ATRP threshold of 4 set by default. Backtests showed that trailing stops perform better on historic data.
Trailing stop
Used to set up a trailing stop. A useful feature to secure profit after a run-up, or get out with a small loss after initial activation. It is important to not use too tight values because they will give unrealistic backtest results and trigger too fast in real-time. Both the trail activation level and trail stop itself can be configured with a percentage value and ATRP value. I recommend setting up the ATRP last. By default the values are 0.05 for activation and 0.03 for the stop based on SPY real-time behavior.
Always sell on pivot crossunder confirmation
The strategy includes pivot crossunder confirmations as sell condition. By default it will not sell on every crossunder confirmation but checks for different conditions (explained in detail earlier in this description). You can change this behavior.
Always sell below first EMA when position has been above
The strategy sells below the first EMA when the position has been above it. By default it will not always sell but checks for different conditions (mentioned earlier in this description). You can change this behavior.
Buy modes pivot
By default the strategy buys between pivots as long as there has been a pivot crossover and EMAs crossover recently or price is still above it. You can change the behavior so it only buys on pivot crossovers or pivot crossover confirmations. Backtesting on the default setup shows decreased performance but for other strategy variations and pivot setups this feature can be useful since many scalpers do not buy between pivots.
Strict mode
There is a strict mode that adds extra checks such as not trading when there is no next low or high pivot, requiring a VWAP uptrend only and minimum candle percentages. This mode is for analyzing history and seeing performance during these conditions. It is worth it to create a separate alert for strict mode so you are aware of these conditions during trading. The deep backtests improved with these setting but past performance does not guarantee future results.
In the strict mode section you can override the stop, minimum ATRP, set up a minimum percentage, only trade VWAP uptrends and to not trade candles without a wick.
A summary and some extra detail
At the time of release only long trades are supported
The strategy is meant for quick scalping but one might find other uses for it
Enable extended hours on intraday charts so it captures more pivots
It does not trade extended hours (pre and post market) since options do not trade during those times
real-time data is recommended and required if a symbol has delayed data by default
You can configure that it trades minutes after market open and hard sells minutes after market open
The entries have a specific label text, example: "833 LE1 / 569.71 / P:569.8". This means: / / . The condition number is only for development/debug purposes for me when you have an issue.
The strategy cannot be tweaked to work on multiple symbols and timeframes with a single config. So you will have to make a config for every timeframe and symbol. I recommend using the Indicator Templates feature of TradingView. This way you can save the settings per timeframe and symbol
The strategy is per default config very dependent on (trailing) stops because it trades between pivots too. It wants that a pivot and EMA crossover has happened more recently than a crossunder. But you can change this behavior to always force crossover buys and crossunder sells.
It’s recommended to set up alerts to notify you of entry and exit signals. Watching the chart alone might cause you to miss trades, especially in fast-moving markets.
Only a max of 500 lines can be rendered on the chart, but the strategy will function with more under the hood. When you exceed 500 you will notice the beginning of the chart has no pivots, but beneath everything functions for backtesting.
Changing settings
Changing the settings for a different symbol and/or timeframe can be a challenging task. Here's a how-to you could use the first time to help you get going:
Set commission and slippage to 0. I prefer to do this so it is more clear whether you are balancing on break-even trades
Enable the pivot timeframe equal or above your chart timeframe. Avoid repainting as discussed earlier by choosing timeframes that align with the same timeframe
Set all volume, ATR, stop, profit takers and trail values to 0
Make sure strict mode is disabled at the bottom of the settings
You now have a clean state and you should see the backtest results purely based on pivot and EMA conditions
Tweak the stop and profit taker, beginning with the simple values and then ATRP threshold
At the last moment tweak the trailing stops. Tight trailing stops create an unrealistic backtest so you will need to tweak them based on real-time behavior of the symbol you're using which you will have to monitor during signals while the market is open. The default values are low (2m intraday SPY). Only with the bar magnifier feature it is somewhat possible to tweak realistic with history data. The tighter they are, the more unrealistic your backtest results. As a starting point, set the trailing stop low and find the highest activation level that doesn't change the results drastically, then increase the stop to the value you think reflects real-time behavior.
Keep refining by testing it during real-time behavior. Does it exit too early according to your own judgment? You need to increase the stop and maybe the activation level.
I hope you will find this useful!
DISCLAIMER
Trading is risky & most day traders lose money. This indicator is purely for informational & educational purposes only. Past performance does not guarantee future results.

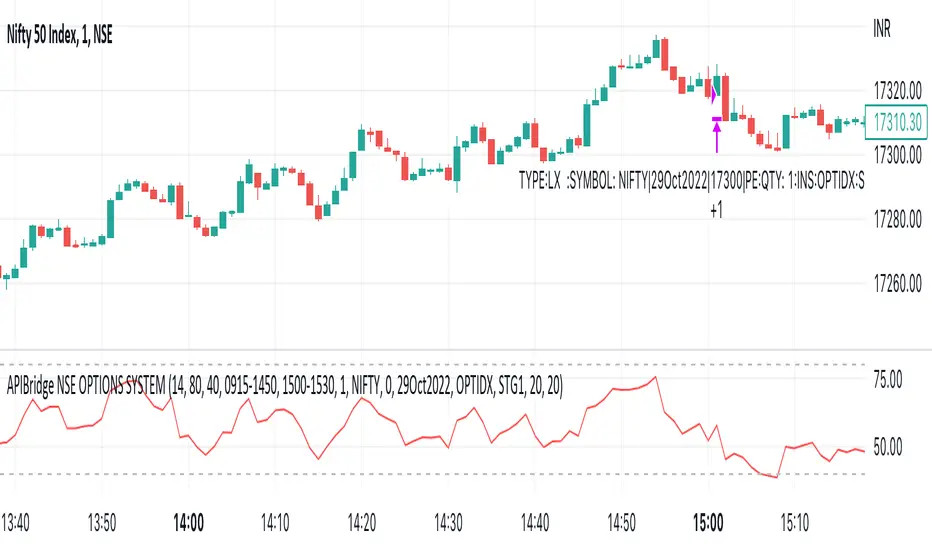
APIBridge Nifty Options Algo StrategyUsing Pinescript, we will use charts of Cash/Future to trade in Options. Note this strategy works well with even the free version of TradingView.
The Relative Strength Index ( RSI ). Is a momentum oscillator that measures the speed and change of price movements. The RSI oscillates between zero and 100. Increasing RSI shows increasing bullish momentum. Decreasing RSI shows increasing bearish momentum. We take RSI upper bound as 80 to indicate bullish momentum and RSI lower bound as 20 to indicate bearish momentum.
We use the above premise to create options buy-only strategy which trades in ATM strikes by default. This strategy requires very less margin (Minimum Rs . 15000).
Since this strategy uses underlying data (cash/future) to place trades in Options, please ignore the backtest of this strategy given by TradingView. TradingView does not provide options data but this strategy bypasses it.
Strategy Premise
The Relative Strength Index (RSI) is a momentum oscillator that measures the speed and change of price movements. The RSI oscillates between zero and 100. Increasing RSI shows increasing bullish momentum. Decreasing RSI shows increasing bearish momentum. We take RSI upper bound as 80 to indicate bullish momentum and RSI lower bound as 20 to indicate bearish momentum.
We use the above premise to create options buy-only strategy which trades in ATM strikes by default. This strategy requires very less margin (Rs. 15000 should be sufficient).
NSE Options Algo Strategy Logic
Long Entry: When RSI goes above 80, send LE in an auto-calculated option strike Call. When RSI goes below 20, send LE in auto-calculated option strike Put.
Long Exit: When we hit Stop loss or Target. In case SL/TGT does not hit and reverse RSI goes above 80 send Long Exit in auto-calculated option. Put as per last trade; RSI goes below 20, send LX in auto-calculated option call as per last trade.
For Long and Short entry the order is fired in the option buying side with auto strike price selection.
Option Strategy Parameters for TraingView Charts
RSI Length(Mandatory): Number of bars used to calculated RSI.
Upper Band(Mandatory): To specify upper band of RSI.
Lower Band(Mandatory): For specifying lower band of RSI.
Use reversal from Upper Band (Optional): This will enable short entry when RSI is falling below 80 from upper band. Recommended to keep unchecked initially.
Use reversal from Lower Band (Optional): This will enable long entry when RSI is raising above 20 from lower band. Recommended to keep unchecked initially.
Quantity: We use this specify the trade quantity (for Nifty min 75)
Custom Stop Loss in Points: Movement in chart price against the momentum which will trigger exit in options positions
Custom Target in Points: Movement in chart price against the momentum which will trigger exit in options positions
Base symbol: This is the base instrument symbol like NIFTY or BANK NIFTY.
Strike distance from ATM: Our default strike selection is considered as first ATM option (with nearest distance, only 100s are considered ). This strike distance allows to calculate ATM options which are at fixed distance.
Expiry: Expiry of option. Weekly and monthly both expiry are allowed.
Instrument: For index instrument will be OPTIDX, for stock instrument will be OPTSTK
Strategy Tag: The Strategy of Nifty options configured in Api bridge.
Setting Up Alert
Before setting up the alert make sure that you have selected desired script, time frame, strategy settings, and APIbridge configuration. Click in settings add alert and paste {{strategy.order.comment}} in message box.
Important: Do not change any settings during live trading. It may break the sequence of exit for the correct call/put.
TICK Scalping strategy, SPY 1 min1 min chart scalping version of my other TICK strategy with adjusted parameters and additional entry and exit conditions better suited for 1 min SPY chart. Please refer to my original TICK strategy for explanation.
Important notes:
1. This strategy is designed for same day SPY option scalping on the 1 min chart . All profit shown in back testing report is based on Profit/Loss (P/L) estimates from trading options with approximately 6 weeks of data. By default, it is set to 10 option contracts. By default the initial capital is set to $5000. Pyramiding is set to 3.
2. This strategy works better with non-extended market data .
3. This strategy is mainly developed for SPY trading on 1 min chart, it probably will not be very profitable with other tickers or time frame without tweaking all the parameters first.
Cheers and enjoy~! Let's all make money~!!
