Daily Bias Trade Manager [MarkitTick]💡 The Daily Bias Trade Manager is a sophisticated technical analysis suite designed to automate the identification of high-probability intraday setups based on liquidity concepts and structural shifts. By synthesizing Previous Day High/Low (PDH/PDL) interactions with momentum confirmation and strict risk management protocols, this tool assists traders in navigating the "Daily Bias." It moves beyond simple signal generation by offering a complete trade management visualization system, projecting entries, stop losses, and take-profit levels directly onto the chart in real-time.
✨ Originality and Utility
This script distinguishes itself by integrating institutional price action theory—specifically Liquidity Sweeps and Change in State of Delivery (CISD)—with mechanical filtering. While many indicators simply highlight highs and lows, the Daily Bias Trade Manager validates these levels by analyzing what happens *after* price tests them.
It solves a common problem for intraday traders: "Analysis Paralysis." By automating the detection of structure breaks (MSS) and Fair Value Gaps (FVG) following a sweep of daily liquidity, it provides an objective framework for entry. Furthermore, the built-in "Position Box" feature removes the guesswork from trade execution by instantly calculating risk-to-reward ratios and visualizing them, allowing traders to see the feasibility of a trade before execution.
🔬 Methodology and Concepts
The core logic operates on a sequential detection model:
Liquidity Identification: The script first plots the Previous Day High (PDH) and Previous Day Low (PDL). These are critical institutional reference points where stop-loss orders (liquidity) often reside.
The Sweep: A "Sweep" is confirmed when price breaches a PDH/PDL but fails to sustain the breakout, closing back inside the previous day's range. This suggests a "Fake-out" or liquidity grab, often a precursor to a reversal.
Change in State of Delivery (CISD): Following a sweep, the script monitors local market structure. It looks for a decisive close past a recent swing point (Swing High for shorts, Swing Low for longs) within a user-defined bar window. This confirms that the counter-trend move has momentum.
Confluence Filtering: To reduce false positives, the engine applies optional filters:
RVOL (Relative Volume): Ensures the sweep occurred on significant volume (Climax behavior).
RSI Momentum: Verifies that momentum supports the reversal direction.
Trend Filter: Uses a long-term EMA to ensure trades align with the broader market direction.
Entry Model: Upon validation, the script calculates an entry at the close (or optionally at a Fair Value Gap), places a Stop Loss at the sweep extreme, and projects three Take Profit targets based on configurable R:R ratios.
🎨 Visual Guide
The indicator uses a distinct color-coded system to keep the chart clean yet informative:
● Liquidity Levels & Sweeps
Orange/Blue Lines: Represent the PDH (Previous Day High) and PDL (Previous Day Low).
Teal Shaded Zones: Indicate a "Buy-Side Sweep" (Price took highs and rejected).
Red Shaded Zones: Indicate a "Sell-Side Sweep" (Price took lows and rejected).
● Position Management Boxes
When a signal triggers, a structured box appears:
Solid Gray Line: The theoretical Entry Price.
Solid Red Line: The Stop Loss (SL), typically placed at the swing high/low of the sweep.
Dashed Blue Lines: Represent TP1, TP2, and TP3 targets based on Reward-to-Risk settings.
Labels: Data tags on the right side of the box show exact price coordinates for Entry, SL, and Targets.
● Signals & Clouds
Green "BUY" Labels: Appear below the bar when a bullish sweep and structural shift are confirmed.
Red "SELL" Labels: Appear above the bar when a bearish sweep is validated.
Yellow Clouds: Highlight Fair Value Gaps (FVG) used for entry confluence or retests.
● Multi-Timeframe (MTF) Dashboard
A panel (default: Top Right) displays the status of up to three higher timeframes.
Trend: Shows "BULL" or "BEAR" based on EMA alignment.
Liquidity: Indicates if the timeframe is "Taking Buy Liq", "Taking Sell Liq", or "Inside Range".
📖 How to Use
● Bullish Reversal Setup
Wait for price to drop below the Blue PDL Line.
Look for a Red Sell-Side Sweep Zone to form, indicating price has rejected lower prices.
Wait for the Green BUY Signal . This confirms a shift in structure (CISD) back to the upside.
Observe the Position Box. If the Risk/Reward is favorable (targets are within reasonable reach), consider the trade.
Optional: Use the "Dynamic Targets" setting to target the previous swing high instead of a fixed ratio.
● Bearish Reversal Setup
Wait for price to rally above the Orange PDH Line.
Look for a Teal Buy-Side Sweep Zone .
Wait for the Red SELL Signal confirming the rejection.
Ensure the dashboard shows alignment (e.g., Higher Timeframe Trend is Bearish) for higher probability.
● Trade Management
Enable the "ATR Trailing Stop" in settings to have the Stop Loss line dynamically adjust as price moves in your favor, locking in potential gains.
⚙️ Inputs and Settings
● General & Display
Show Daily Liquidity: Toggles the PDH/PDL lines.
Max Signals/Zones: Limits the visual clutter by restricting historical shapes.
● Detection Logic
Swing Detection Length: Controls the sensitivity of pivot points. Higher numbers = fewer, more significant swings.
CISD Window: How many bars after a sweep are allowed for the structure shift to occur.
Use FVG Entry: If true, the signal waits for a retest of a gap rather than entering immediately at the close.
● Filters
Volume (RVOL): Requires the sweep candle volume to be X times larger than average.
Trend Filter: Only allows Buy signals above the EMA and Sell signals below it.
Session Filter: Restricts signals to specific hours (e.g., New York Killzone).
● Targets & Management
Target R:R: Sets the multiplier for TP1, TP2, TP3 relative to the stop loss distance.
Use Dynamic Targets: Targets structural liquidity (Previous Highs/Lows) instead of fixed math ratios.
ATR Trailing Stop: Activates the trailing stop mechanism.
🔍 Deconstruction of the Underlying Scientific and Academic Framework
This indicator is grounded in the principles of Market Microstructure and Mean Reversion theory .
1. Liquidity Pools & Stop Runs:
Academic literature on market microstructure suggests that order flow clusters around obvious visual references (PDH/PDL). Large market participants often utilize this "resting liquidity" to fill large block orders with minimal slippage. The "Sweep" logic detects this absorption phase.
2. Volatility Breakout vs. Fake-out:
The script differentiates between a genuine breakout and a mean-reverting "fake-out" by analyzing the Close relative to the Range . A close back within the prior day's range after a breach signifies a failure of auction in the new territory, statistically increasing the probability of a reversion to the mean (equilibrium).
3. Momentum Validation (RSI & RVOL):
By integrating Relative Volume (RVOL) and RSI, the script applies statistical significance testing to the price action. High volume at a range extreme without price progress (the sweep) indicates "Stopping Volume" or absorption, a key concept in Volume Spread Analysis (VSA).
🙏 Gratitude
I would like to express my gratitude to harry040708 for sharing the insightful idea that made this script possible.
⚠️ Disclaimer
All provided scripts and indicators are strictly for educational exploration and must not be interpreted as financial advice or a recommendation to execute trades. I expressly disclaim all liability for any financial losses or damages that may result, directly or indirectly, from the reliance on or application of these tools. Market participation carries inherent risk where past performance never guarantees future returns, leaving all investment decisions and due diligence solely at your own discretion.
Orderflowtrading

Order Flow IndicatorThe Order Flow Indicator is an advanced order flow analysis tool that processes lower timeframe (LTF) tick-level data to reveal the underlying buying and selling dynamics behind price movement. Using custom scoring formulas and proprietary weighting algorithms, this indicator transforms raw tick data into actionable visualizations that help traders understand market microstructure, detect potential institutional activity, and identify shifts in buying and selling pressure.
Unlike standard volume indicators that only show total volume per bar, this indicator analyzes every individual tick within each chart bar—potentially hundreds or thousands of data points—to calculate directional pressure, volume absorption, and large order detection with far greater precision.
-------------------------------------------------------------------
Core Features
1. Institutional Buyer Histogram
The institutional buyer histogram identifies and displays large orders that likely represent institutional or professional trading activity. The indicator uses a proprietary classification system with an adaptive algorithm to detect which orders are the most important, automatically calibrating to different instruments and market conditions without manual adjustment.
Large orders are classified by direction:
Buy Orders (green, above zero) : Large orders where price moved up
Sell Orders (red, below zero) : Large orders where price moved down
Neutral Orders (white, split across zero) : Large orders with no directional impact
The tiered filtering system allows you to adjust sensitivity:
Tier 1 Only : Shows only the absolute largest, most significant orders
Tier 1 & 2 Only : Shows very large orders (default setting)
Tier 1, 2 & 3 Only : Shows large orders with more frequency
All Tiers : Shows all significant orders above normal retail size
Use Order Size Filter Only : Bypass the adaptive tier system and filter purely by a specific order size threshold
An optional Size Filter can be enabled to set an absolute minimum order size in addition to tier filtering, allowing for precise control over which orders are displayed.
2. Buy & Sell Pressure Histogram
Visualizes the total directional pressure within each bar using a proprietary scoring system that weights volume by price impact. The histogram height represents total pressure intensity, while the color gradient—ranging from neutral gray to green (buying) or red (selling)—indicates how one-sided the activity was. Bars with strong directional conviction display more saturated colors, while mixed or balanced activity remains closer to neutral.
The color intensity is determined by custom adaptive algorithms that compare current activity against recent historical context, providing meaningful visual feedback about the strength and conviction of each bar's order flow.
3. Absorption Histogram
Detects when significant volume occurs without proportional price movement. High absorption readings suggest that large orders may be getting filled without moving the market, potentially indicating institutional activity, strong support/resistance levels, or an active battle between buyers and sellers. This can mean a reversal is coming or that the move is exhausted.
The indicator uses proprietary efficiency calculations and adaptive normalization to compare current absorption against recent historical context, automatically adjusting to different market conditions and volatility.
4. Neutral Volume Histogram
Displays cumulative volume where price remained unchanged between ticks. Elevated neutral volume may indicate consolidation, indecision, or large orders being executed at a single price level without directional impact. These are typically limit orders where institutional buyers were trying to get their orders filled without moving the markets.
5. Order Flow Trend Line & Moving Averages
Tracks cumulative directional order flow over time, resetting at user-defined intervals (hourly, daily, weekly, etc.). Two calculation methods are available:
Basic : Raw cumulative volume delta (up volume minus down volume)
Advanced : Uses the proprietary scoring system for volume-weighted directional measurement
Three time-based moving averages (default: 15min, 1H, 4H) provide trend context. Unlike traditional bar-based MAs, these automatically calculate the appropriate length based on your chart timeframe, ensuring consistent time periods across different charts. Optional color-filled areas show when the trend line is above or below each MA for quick visual reference.
-------------------------------------------------------------------
How To Read The Indicator
Institutional Histogram Interpretation:
Green spikes above zero = Large buying orders detected
Red spikes below zero = Large selling orders detected
White spikes above and below zero = Large neutral orders detected
Simultaneous buy and sell spikes = Two-sided institutional activity (potential reversal zone or high-interest price level)
The identification table on your chart shows which tier filter is active and any size filter threshold
Pressure Histogram Interpretation:
Tall bars with saturated green = Strong, mostly one-sided buying pressure
Tall bars with saturated red = Strong, mostly one-sided selling pressure
Shorter or gray-tinted bars = Lower conviction or balanced activity from buyers and sellers
Absorption Histogram Interpretation:
Tall bright bars = High volume absorbed without moving price (potential reversal or exhaustion of the move)
Low/absent bars = Volume efficiently moving price as expected
Neutral Volume Histogram Interpretation:
Large neutral volume signals clusters of limit orders from large buyers and sellers looking to fill their orders without moving the market. This can signal a potential reversal, or intention to support price from that area.
Trend Line Interpretation:
Rising trend line (green) = Cumulative buying pressure increasing
Falling trend line (red) = Cumulative selling pressure increasing
Trend crossing above/below MAs = Potential shift in order flow momentum
-------------------------------------------------------------------
Trading Applications
Scalping & Intraday Trading : Use the Institutional Histogram to identify when large players are entering the market. Imbalances between institutional buying and selling often precede short-term price movements. Watch for a strong directional bias from large orders and then look for pullbacks to enter positions in the same direction of the large order bias.
Watch for high spikes in absorption after an extended move up or down. This typically represents a reversal is coming or that the move is exhausted and a pullback to fair price areas is likely so trail your stop tightly if you are already in a position or use the absorption spike as a signal to watch for a potential entry near that spike candle.
Support & Resistance Confirmation : High Absorption readings at key price levels may confirm that orders are being absorbed, strengthening the case for support or resistance. Clusters of absorption can help identify accumulation and distribution zones. These often have price reactions that can be scalped for quick profits by trading back towards where price approached the support/resistance level from.
Trend Confirmation : The Order Flow Trend Line can confirm or diverge from price trends. Strong price moves accompanied by aligned order flow provide higher conviction. Divergences between price and cumulative delta may signal weak conviction from traders and indicate a potential reversal is coming.
Institutional Order Detection : Filter for only the largest orders (Tier 1) to see when potential institutional players are most active. These rare, significant orders often precede meaningful price moves. When you see a clear bias in direction from the institutional traders, look for pullbacks and then enter a position in the same direction as the large trader bias.
Volume Analysis : Compare Pressure and Neutral Volume histograms together. High pressure with low neutral volume suggests conviction moves, while high neutral volume with low pressure may indicate consolidation or absorption.
-------------------------------------------------------------------
Settings Overview
Global Settings:
Data Source : Analyze order flow from a different symbol (e.g., ES1! while viewing SPY). Leave empty to use the current chart symbol.
Lower Timeframe : The granularity of tick data analysis (default: 1T for 1-tick). Lower timeframes provide more accurate data but have limited historical depth.
Only Show Data For Confirmed Bars : When enabled, only displays data after bars close to prevent values from updating on open bars.
Institutional Buyer Histogram Settings:
Order Size Tier Filter : Adjust sensitivity from Tier 1 (largest orders only) through All Tiers (broader detection), or use Size Filter Only mode
Only Show Orders Above Filter Threshold : Enable an additional absolute minimum order size filter
Order Size Filter Threshold : Set a specific minimum volume when the size filter is enabled
Color Settings : Customize buy, sell, and neutral order colors
Buy & Sell Pressure Histogram Settings:
Enable/disable and invert the histogram
Customize buy pressure, sell pressure, and base colors for the gradient system
Absorption Histogram Settings:
Enable/disable and invert the histogram
Customize absorption and base colors
Neutral Volume Histogram Settings:
Enable/disable and invert the histogram
Customize the neutral volume color
Order Flow Trend Settings:
Calculation Method : Basic (raw delta) or Advanced (proprietary scoring)
Smoothing Length : Apply SMA smoothing to the trend line (1 = no smoothing)
Reset Period : When cumulative values reset (5min through 1 Year)
MA 1/2/3 Timeframes : Time-based moving average periods (each can be independently enabled)
MA Fill : Optional color fill between trend line and MAs
Identification Table:
Enable/disable the on-chart table showing active features
Customize position, background color, and text color
-------------------------------------------------------------------
Important Notes & Limitations
Lower Timeframe Data Requirements : This indicator is designed to work with tick-level data (1T timeframe) for maximum accuracy. The quality of analysis depends directly on the granularity of data available:
Tick-based intervals require a paid TradingView subscription (Ultimate plan)
Historical tick data is very limited — even on the Ultimate plan, only 40,000 bars of historical tick data is available which can be days worth of data on some charts and only hours worth of data on charts like NQ where there are a large amount of traders constantly buying and selling.
Second-based data requires Premium or Ultimate plans. This will give you more history to work with, but multiple transactions can happen within a single second bar, so the data, especially directional data will not be as accurate as tick level data.
Using higher LTF settings (such as 1-minute) will still work but provides less granular order flow analysis
For complete information on data availability by subscription tier, see the TradingView pricing page.
Volume Data Required : This indicator requires volume data to function. Instruments without volume data (such as some forex pairs from certain brokers) cannot be analyzed with this tool.
Real-Time Updates : Without "Only Show Data For Confirmed Bars" enabled, the current bar's values will update in real-time as new ticks arrive. Enable this setting if you prefer to act only on finalized data that will not change upon bar confirmation.
Instrument Compatibility : While designed primarily for futures trading analysis, this indicator works on any instrument with volume data including stocks, forex, ETFs, and cryptocurrencies.
Using Multiple Instances Of The Indicator : There are multiple different options for you to use on this indicator, but having them on the same pane can be confusing and not obvious when the data overlaps. To fix this, just add a second or third instance of the indicator to your chart and then switch on the specific tool you want to use for that indicator pane. My personal favorite is the absorption on one pane and the institutional buyer histogram on another pane for easy analysis of both.
If you want to combine two histograms onto one indicator pane such as absorption and neutral volume, just enable the inversion setting on one of the tools so you get data on the positive side and negative side of the zero line and reduce how much space your indicator setup consumes of your chart.
Fix Indicator Loading Error: If the indicator fails to load or displays incorrectly, toggle the "Fix Indicator Loading Error" checkbox in settings. This forces TradingView to restart the indicator and typically resolves loading issues. Tradingview charts have issues with parsing tick data sometimes too, so if you see gaps between readings, try refreshing your browser. Most of the time that fixes the issue with gaps in data. If that does not resolve the issue, there may not be any tick data available from the exchange during that time period.
-------------------------------------------------------------------
Default Configuration
Out of the box, the indicator displays:
Institutional Buyer Histogram : Enabled with Tier 1 & 2 filter
Identification Table : Enabled (shows active features and current tier selection)
All other features : Disabled
This provides immediate value by showing large order detection without overwhelming the chart. Enable additional features as needed for your trading style.

NeuraEdge Delta Flow PRO - Institutional Order Flow AnalysisOVERVIEW
Delta Flow Pro is a closed-source order flow analysis indicator that reveals the hidden battle between buyers and sellers. While price shows you what happened, Delta Flow shows you who won the fight.
Traditional volume indicators only measure transaction size - they tell you how much traded, but not the directional conviction behind those trades. Delta Flow Pro uses proprietary price action algorithms to estimate buying versus selling pressure on every bar, exposing institutional accumulation and distribution patterns that remain invisible on standard charts.
The indicator analyzes three critical dimensions:
Bar-by-bar delta (who controlled each candle)
Cumulative Volume Delta (net institutional positioning over time)
Divergence patterns (early warning when pressure shifts before price confirms)
CORE METHODOLOGY
Delta Calculation Approach:
The indicator uses three selectable estimation methods to analyze intra-bar order flow:
Price Action Method - Calculates delta based on where price closes within the bar's range. A close near the high indicates buying pressure; near the low indicates selling pressure. Formula: ((close - low) / range - 0.5) × 2 × volume
Candle Body Method - Weights delta by the body-to-range ratio, emphasizing bars where one side dominated completely. Uses body size as a conviction metric multiplied by directional volume.
Wick Weighted Method - Incorporates upper and lower wick analysis, where large lower wicks indicate buying absorption and large upper wicks indicate selling rejection. Combines base directional bias with wick-derived pressure.
All methods are normalized to a 0-100% scale for consistent interpretation across different instruments and timeframes.
Cumulative Volume Delta (CVD):
The indicator maintains a running cumulative sum of delta values to track net institutional positioning over time. CVD reveals accumulation (rising) or distribution (falling) patterns that may not be visible in price alone. Users can configure auto-reset periods (0-100 bars) to focus CVD on recent activity or disable reset for long-term tracking.
Divergence Detection:
The indicator identifies structural divergences between price pivots and delta pivots using configurable lookback periods (2-15 bars). Bearish divergence occurs when price makes higher highs while delta makes lower highs, suggesting weakening buying pressure. Bullish divergence occurs when price makes lower lows while delta makes higher lows, suggesting weakening selling pressure.
WHY CLOSED SOURCE:
The proprietary calculation methodology represents original research into optimal weighting factors, normalization techniques, and divergence sensitivity calibrations developed through extensive back testing across multiple asset classes. The closed-source protection prevents dilution of the methodology while ensuring consistent signal quality for all users.
Unlike open-source implementations using basic volume × direction formulas, Delta Flow Pro employs:
Adaptive normalization that adjusts to instrument volatility
Multi-method delta estimation with context-aware switching logic
Refined pivot detection algorithms to minimize false divergence signals
Volume-safety protocols to handle zero-volume bars and data gaps
TECHNICAL JUSTIFICATION FOR PAID ACCESS:
While moving averages, RSI, and Bollinger Bands are well-documented public domain concepts, institutional order flow analysis requires:
Proprietary weighting systems to estimate bid/ask imbalance from OHLCV data
Advanced normalization to make delta comparable across vastly different instruments
Custom divergence logic that filters noise while maintaining sensitivity
Extensive calibration to balance false positives against missed signals
Data Feed Alternative:
Traditional order flow analysis requires expensive Level 2 market data subscriptions, DOM (Depth of Market) feeds, or institutional trading terminals (often $100-500+ monthly per exchange). Delta Flow Pro provides order flow insights using standard OHLCV price and volume data, eliminating the need for additional external data feed costs while delivering actionable institutional pressure analysis.
The indicator provides value beyond standard technical analysis tools by offering retail traders proxy access to order flow concepts typically requiring premium market data subscriptions.
VISUAL COMPONENTS
Delta Histogram (Main Panel):
Vertical bars representing normalized delta strength (-100% to +100%)
Green = buying pressure, Red = selling pressure
Brightness indicates conviction (bright = strong delta above threshold)
Allows instant visual identification of pressure shifts
CVD Line (Blue overlay):
Cumulative running total of delta values
Reveals multi-bar institutional positioning trends
Divergence from price indicates potential exhaustion
Divergence Markers:
Green triangles (bottom) = Bullish divergence detected
Red triangles (top) = Bearish divergence detected
Plotted at the pivot bar for precise timing
Real-Time Dashboard:
Current delta state and strength percentage
CVD trend direction
20-bar statistical summary (buy/sell distribution)
PRACTICAL APPLICATION
Delta Flow Pro transforms how you interpret market action by revealing the pressure behind price movements.
Signal Confirmation:
Use delta as a filter for entries from other indicators. If your primary system generates a long signal but delta is strongly negative, it suggests selling pressure may invalidate the setup. Conversely, bullish delta confirms buying conviction behind the move.
Exhaustion Detection:
The most powerful application - spotting when price and pressure diverge. Price making new highs with negative delta indicates weak hands pushing price while institutions sell into strength. Price making new lows with positive delta indicates smart money absorption. These exhaustion patterns often precede major reversals.
Divergence Trading:
Divergence signals often precede reversals by several bars, providing early warning. Wait for price confirmation (structure break, reversal candlestick) before entering based on divergence alone.
Conviction Measurement:
Strong delta (above user-defined threshold, default 70%) indicates high probability the current move continues. Weak delta near zero suggests choppy conditions; consider reducing position size or avoiding entries.
SETTINGS & CUSTOMIZATION
Delta Calculation:
Method selection (Price Action / Candle Body / Wick Weighted)
Smoothing length (1-10 periods)
Cumulative Delta:
Toggle CVD line visibility
Auto-reset period (0 = no reset, 1-100 bars)
Custom line color
Display Options:
Toggle histogram, divergences, dashboard independently
Custom colors for buying/selling/neutral states
Strong delta threshold percentage (50-95%)
Optional threshold reference lines
Divergence Settings:
Pivot lookback length (2-15 bars)
Controls sensitivity vs noise trade-off
Alert System:
Strong buying pressure detected
Strong selling pressure detected
Bullish divergence
Bearish divergence
Delta flip bullish
Delta flip bearish
BEST PRACTICES
Recommended Usage:
Works on all timeframes; most reliable on 15-minute and higher
Best results on liquid instruments (major forex pairs, index futures, high-volume stocks)
Use as confirmation with structure-based or momentum strategies
Monitor CVD trend for bigger-picture context
Limitations:
Not a standalone trading system; designed for confluence
Less reliable on thinly traded instruments with erratic volume
Avoid trading when delta oscillates near zero (indecision)
This is an estimation model, not true tick-by-tick order flow data
IMPORTANT DISCLOSURES
This indicator estimates order flow based on price action and volume. TradingView does not provide the tick-by-tick bid/ask data required for true institutional order flow tracking. Delta Flow Pro serves as a highly effective proxy for pressure analysis within these data limitations.
No indicator guarantees profitable trades. Past performance does not predict future results. This tool is designed for educational purposes and should be used alongside proper risk management. Traders are responsible for their own trading decisions.
INCLUDED MATERIALS:
Access includes a comprehensive user guide (PDF format) explaining setup, interpretation, and integration strategies with common trading methodologies.
HOW TO REQUEST ACCESS:
To request invite access to this indicator, please review the Author's Instructions in the top-right corner of this page.

Smart Money Flow Oscillator [MarkitTick]💡This script introduces a sophisticated method for analyzing market liquidity and institutional order flow. Unlike traditional volume indicators that treat all market activity equally, the Smart Money Flow Oscillator (SMFO) employs a Logic Flow Architecture (LFA) to filter out market noise and "churn," focusing exclusively on high-impact, high-efficiency price movements. By synthesizing price action, volume, and relative efficiency, this tool aims to visualize the accumulation and distribution activities that are often attributed to "smart money" participants.
✨ Originality and Utility
Standard indicators like On-Balance Volume (OBV) or Money Flow Index (MFI) often suffer from noise because they aggregate volume based simply on the close price relative to the previous close, regardless of the quality of the move. This script differentiates itself by introducing an "Efficiency Multiplier" and a "Momentum Threshold." It only registers volume flow when a price move is considered statistically significant and structurally efficient. This creates a cleaner signal that highlights genuine supply and demand imbalances while ignoring indecisive trading ranges. It combines the trend-following nature of cumulative delta with the mean-reverting insights of an In/Out ratio, offering a dual-mode perspective on market dynamics.
🔬 Methodology
The underlying calculation of the SMFO relies on several distinct quantitative layers:
• Efficiency Analysis
The script calculates a "Relative Efficiency" ratio for every candle. This compares the current price displacement (body size) per unit of volume against the historical average.
If price moves significantly with relatively low volume, or proportional volume, it is deemed "efficient."
If significant volume occurs with little price movement (churn/absorption), the efficiency score drops.
This score is clamped between a user-defined minimum and maximum (Efficiency Cap) to prevent outliers from distorting the data.
• Momentum Thresholding
Before adding any data to the flow, the script checks if the current price change exceeds a volatility threshold derived from the previous candle's open-close range. This acts as a gatekeeper, ensuring that only "strong" moves contribute to the oscillator.
• Variable Flow Calculation
If a move passes the threshold, the script calculates the flow value by multiplying the Typical Price and Volume (Money Flow) by the calculated Efficiency Multiplier.
Bullish Flow: Strong upward movement adds to the positive delta.
Bearish Flow: Strong downward movement adds to the negative delta.
Neutral: Bars that fail the momentum threshold contribute zero flow, effectively flattening the line during consolidation.
• Calculation Modes
Cumulative Delta Flow (CDF): Sums the flow values over a rolling period. This creates a trend-following oscillator similar to OBV but smoother and more responsive to real momentum.
In/Out Ratio: Calculates the percentage of bullish inflow relative to the total absolute flow over the period. This oscillates between 0 and 100, useful for identifying overextended conditions.
📖 How to Use
Traders can utilize this oscillator to identify trend strength and potential reversals through the following signals:
• Signal Line Crossovers
The indicator plots the main Flow line (colored gradient) and a Signal line (grey).
Bullish (Green Cloud): When the Flow line crosses above the Signal line, it suggests rising buying pressure and efficient upward movement.
Bearish (Red Cloud): When the Flow line crosses below the Signal line, it suggests dominating selling pressure.
• Divergences
The script automatically detects and plots divergences between price and the oscillator:
Regular Divergence (Solid Lines): Suggests a potential trend reversal (e.g., Price makes a Lower Low while Oscillator makes a Higher Low).
Hidden Divergence (Dashed Lines): Suggests a potential trend continuation (e.g., Price makes a Higher Low while Oscillator makes a Lower Low).
"R" labels denote Regular, and "H" labels denote Hidden divergences.
• Dashboard
A dashboard table is displayed on the chart, providing real-time metrics including the current Efficiency Multiplier, Net Flow value, and the active mode status.
• In/Out Ratio Levels
When using the Ratio mode:
Values above 50 indicate net buying pressure.
Values below 50 indicate net selling pressure.
Approaching 70 or 30 can indicate overbought or oversold conditions involving volume exhaustion.
⚙️ Inputs and Settings
Calculation Mode: Choose between "Cumulative Delta Flow" (Trend focus) or "In/Out Ratio" (Oscillator focus).
Auto-Adjust Period: If enabled, automatically sets the lookback period based on the chart timeframe (e.g., 21 for Daily, 52 for Weekly).
Manual Period: The rolling lookback length for calculations if Auto-Adjust is disabled.
Efficiency Length: The period used to calculate the average body and volume for the efficiency baseline.
Eff. Min/Max Cap: Limits the impact of the efficiency multiplier to prevent extreme skewing during anomaly candles.
Momentum Threshold: A factor determining how much price must move relative to the previous candle to be considered a "strong" move.
Show Dashboard/Divergences: Toggles for visual elements.
🔍 Deconstruction of the Underlying Scientific and Academic Framework
This indicator represents a hybrid synthesis of academic Market Microstructure theory and classical technical analysis. It utilizes an advanced algorithm to quantify "Price Impact," leveraging the following theoretical frameworks:
• 1. The Amihud Illiquidity Ratio (2002)
The core logic (calculating body / volume) functions as a dynamic implementation of Yakov Amihud’s Illiquidity Ratio. It measures price displacement per unit of volume. A high efficiency score indicates that "Smart Money" has moved the price significantly with minimal resistance, effectively highlighting liquidity gaps or institutional control.
• 2. Kyle’s Lambda (1985) & Market Depth
Drawing from Albert Kyle’s research on market microstructure, the indicator approximates Kyle's Lambda to measure the elasticity of price in response to order flow. By analyzing the "efficiency" of a move, it identifies asymmetries—specifically where price reacts disproportionately to low volume—signaling potential manipulation or specific Market Maker activity.
• 3. Wyckoff’s Law of Effort vs. Result
From a classical perspective, the algorithm codifies Richard Wyckoff’s "Effort vs. Result" logic. It acts as an oscillator that detects anomalies where "Effort" (Volume) diverges from the "Result" (Price Range), predicting potential reversals.
• 4. Quantitative Advantage: Efficiency-Weighted Volume
Unlike linear indicators such as OBV or Chaikin Money Flow—which treat all volume equally—this indicator (LFA) utilizes Efficiency-Weighted Volume. By applying the efficiency_mult factor, the algorithm filters out market noise and assigns higher weight to volume that drives structural price changes, adopting a modern quantitative approach to flow analysis.
● Disclaimer
All provided scripts and indicators are strictly for educational exploration and must not be interpreted as financial advice or a recommendation to execute trades. I expressly disclaim all liability for any financial losses or damages that may result, directly or indirectly, from the reliance on or application of these tools. Market participation carries inherent risk where past performance never guarantees future returns, leaving all investment decisions and due diligence solely at your own discretion.

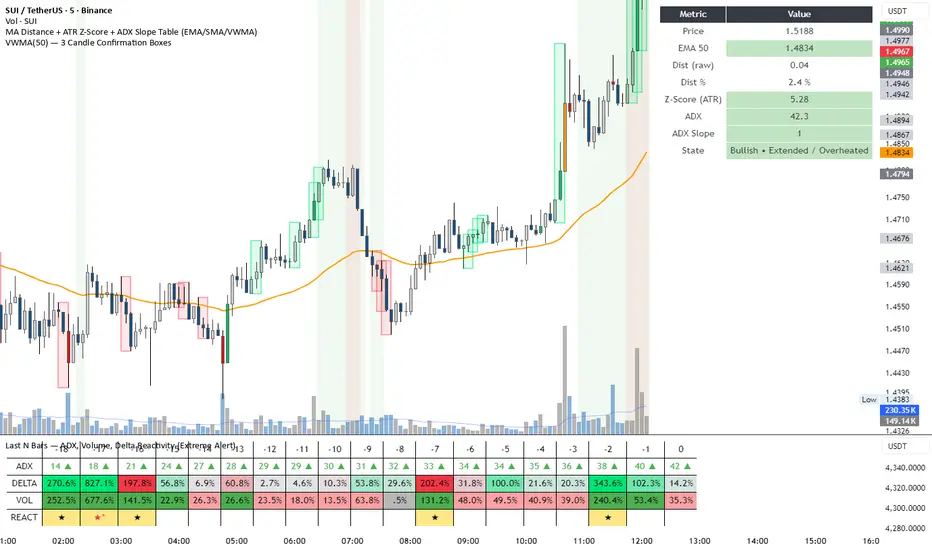
DeltaReact - Volume and Orderflow ReactivityThis indicator is designed to visualise institutional participation and directional pressure using a multi-timeframe blend of volume expansion, delta imbalance, and trend context.
Unlike traditional volume or momentum tools, it focuses on relative change rather than absolute values.
Core Concepts
The script measures:
Volume expansion relative to its own moving baseline
Delta strength derived from directional volume imbalance
Directional agreement between delta, volume, and trend state
Multi-timeframe structure, allowing lower-timeframe signals to be viewed in higher-timeframe context
What Makes This Different
Most volume-based indicators treat volume and delta independently. This tool:
Normalises both metrics into percentage-based strength
Applies contextual filters to reduce noise
Highlights structural shifts rather than raw spikes
Provides clear visual hierarchy for participation intensity
How to Use
Strong delta + volume expansion suggests active participation
Directional alignment improves confidence
Signals are designed for confluence, not standalone entries
Works across assets and sessions without instrument-specific tuning
Access & Availability
This script is published as invite-only to control distribution.
If you would like to request access or learn more about usage, please contact the author via TradingView direct message.
Important Notes
This indicator is not a trading strategy and does not provide buy or sell signals.
It is intended as a decision-support tool to be used alongside risk management and broader market analysis.
BT Aggressionv0.3.1 Beta Release
The BT Aggression Indicator is a high-resolution market sentiment and aggression tool for futures trading. It combines volume delta, volatility normalization, and dynamic smoothing to give traders real-time insight into market pressure.
Detailed description in future release.

VWAP ±2σ Entry Signals (volume Weighted)This indicator builds a session based VWAP and plots the upper and lower 2nd standard deviation bands around it. These bands act as dynamic volatility edges for the session. When price reaches these outer bands, it often represents an extreme stretch away from fair value a place where mean reversion or exhaustion can occur.
The indicator generates trade signals only when price approaches the band from the correct direction, which filters out a lot of noise and reduces false touches.
How It Works
VWAP is calculated from the start of each session.
Standard deviation is computed using volume weighted prices, so the bands expand and contract with real market activity.
The upper and lower 2σ bands form natural "overextended" zones around VWAP.
Most VWAP band strategies fire signals every time price touches a band which produces a lot of junk signals.
This version avoids that by requiring direction based touches, meaning:
If price is already above the band, no sell signal appears.
If price is already below the band, no buy signal appears.

Aggregated Open InterestAggregates Open Interest data across 10 major crypto exchanges: Binance, Bybit, Kraken, MEXC, Bitget, BingX, Coinbase, Deribit, HTX, and Crypto.com.
Displays total market OI with candlesticks on intraday timeframes and a step line on daily+ timeframes. Color-coded: teal for increasing OI, red for decreasing OI.
Toggle individual exchanges on/off in settings to customize your view.
With this indicator there is no need to be on the perpetual chart of the asset for the open interest to be displayed.

TradingIQ - OrderFlow IQIntroducing “OrderFlow IQ”
OrderFlow IQ is an all-in-one order-flow and volume-profiling suite crafted to bring true market microstructure to your TradingView charts. It bundles footprints, per-bar and intra-bar delta analytics, class-based delta tracking, adaptive volume profiles, bubble-style trade tapes, live time-and-sales feeds, cumulative-volume fight meters, iceberg detection, and more—all driven by a single, user-friendly interface.
Features
The list below details an ever=expanding list of the indicators capabilities; more to come in the future!
Tick-based Footprints
Imbalance and stacked imbalance detection
Tick-based chronicled volume profile
Delta classification (small order, medium order, and block order delta)
Tick-based order flow bubble tape
Live order feed with total buying volume against total selling volume
Tick-based CVD
Iceberg order detection
Delta class lines
Tick-based bar statistics
Key Components and Their Functions
Data Granularity
• 1-Tick / 1-Second / 1-Minute modes let you choose the resolution of every calculation. On true tick charts you get genuine tick-by-tick precision; on second charts you see every intra-second print; on anything else it falls back to minute bars.
Footprint Engine
Bid vs Ask Volume Columns – Each candle is sliced into tick-level price rows showing buy-volume, sell-volume, total volume, delta and delta%.
CVD-Level Columns – Optionally color each row by net cumulative delta instead of raw volume to spotlight buying or selling pressure trends.
Imbalance Detection – Highlight rows where one side exceeds your % threshold, with “stacked” imbalances calling out multi-row alignment ahead of potential breaks.
Value Area & POC – Automatically compute and draw the 70% value area (VAH/VAL) and mark the Point of Control per session or any chosen timeframe.
Footprint
The image above shows the volume profiling data calculated for each row across the footprint engine.
Delta: Shows the net difference between buying and selling
Delta Percentage: Calculates delta as a percentage of total volume
Total Volume: The total volume at the price block
Buy Volume: The total buying volume at the price block
Sell Volume: The total selling volume at the price block
Additionally, you can select to only show buying volume and selling volume at each price block, as shown in the image above.
POC
The image above shows the visuals used to mark the POC of the footprint. The POC is marked yellow by default; the color can be changed in the settings.
Value Area
The image above shows the visuals used to mark the value area of the footprint.
Imbalance Detection
The image above shows the Footprint Engine detecting and marking buying/selling imbalances.
Stacked Imbalances
The image above shows the Footprint Engine detecting and marking stacked imbalances. Stacked imbalances are shown as consecutive, small blocks to the right of the footprint.
CVD Levels
The image above shows the footprint engine calculating CVD across the footprint, rather than net delta that resets bar by bar. Traders can enable the "Use CVD Levels" setting to have net delta persist across price bars, allowing traders to see the net CVD across various price blocks as the footprint develops.
Delta Class Statistics
With the inclusion of tick volume, The Delta Class Statistics component of the indicator classifies volume delta by order size to give traders detailed insights into whether small players are buying/selling and whether big players are buying/selling.
The image above shows a full view of the Delta Class Statistics feature.
The image above further explains the Delta Class Statistics view.
Orders are distributed (classified) across various order size amounts. From here, a rolling CVD is calculated across each order size. This feature gives traders detailed insights into whether big money is buying/selling (big player sentiment) and whether small money is buying/selling (small player sentiment).
Analysis
The image above shows a net-negative CVD for the session for both small orders (small money) and big orders (big money), while "medium" sized orders are currently at a net-positive CVD.
Consequently, sentiment for big players is bearish.
Additionally, small triangles are printed alongside each Delta Class box for each bar. You can hover over these labels with your cursor to see the net delta for the bar for each order size.
Bar Delta Statistics
With the inclusion of tick data, OrderFlow IQ is designed to generate detailed tick-based bar statistics for each candlestick.
The image above shows the feature in action.
Metrics
Volume: Total volume for the bar
Bar VWAP: The individual bar's VWAP
Delta: Net delta for the bar
Delta %: Delta % of the bar
Max Delta: The maximum positive delta achieved during the bar
Min Delta: The lowest negative delta achieved during the bar
CVD: Cumulative volume delta measurement by the bar
Buy Volume: Total buying volume for the bar
Sell Volume: Total selling volume for the bar
Iceberg Detection (Tick-Data Only)
An Iceberg Order is a type of large trading order that is broken up into much smaller visible portions. Only a small part of the order is displayed in the public order book at any given time, while the rest is hidden (like an iceberg where only the tip is above water).
Why are Iceberg Orders Important?
Minimizing Market Impact
If a trader were to post a 10,000-share sell order openly, the market would immediately react:
Buyers might panic, thinking there's a rush to sell.
Sellers could undercut the price aggressively.
This would likely drive the price down before the large order even finishes executing.
By revealing only a small portion at a time, Iceberg orders help avoid spooking the market and allow the trader to sell closer to the original price.
Hiding Trading Intentions
Markets are highly sensitive to order flow — the balance of buying and selling pressure.
If competitors, market makers, or algorithmic traders see a massive order, they might:
Front-run it (selling before it completes to profit from the expected price drop).
Reassess their own models about supply/demand imbalances.
Iceberg orders protect against this by masking true supply or demand.
Our Iceberg Detection Model
Using a proprietary iceberg order detection algorithm, OrderFlow IQ is capable of detecting/alerting iceberg orders when they occur.
The image above shows the Iceberg Detector in action.
When an iceberg order is identified, the size of the order in the quote currency, price of execution, and number of executions will be displayed.
It's important to set alerts for this feature, as iceberg orders aren't frequent and are easy to miss when away from the chart.
IQ Volume Profile (Chronicled Volume Profile)
OrderFlow IQ generates a Chronicled Volume Profile to give traders detailed insights into net delta by price level, but also historical net delta by price level.
The image above shows the feature in action. While the chronicled volume profile is seemingly a normal volume profile, the narrow-lines across the chronicle profile show historical min/max delta at each price level.
The image above exemplifies the feature.
The wide price blocks show the current net delta at each price area, while the small lines (with a circle at the end) show historical min/max delta at the price level.
This tool allows traders to see if buying/selling always dominated a price level, or if control of the price level changed hands between buyers/sellers throughout development of the profile.
Additionally, traders can hover over the small circles on the profile with their cursor to see the detailed delta statistics at each price area. The statistics will show the minimum delta at the price area, maximum delta, and the live change in delta.
Order Feed
OrderFlow IQ is capable of generating a live order feed with various metrics to assist real time orderflow traders in their analysis.
The image above exemplifies the feature.
Bid/Ask: The bid price and ask price of the current bar
Buys | Price: The size of a buy order and price of execution
Sells | Price: The size of a sell order and price of execution
▴ Vol: Cumulative buying volume (in quote currency) for the feed
▾ Vol: Cumulative selling volume (in quote currency) for the feed
Speed of tape: The average speed between each order fill
OrderFlow Bubble Tape
OrderFlow IQ also displays a traditional orderflow indicator, also known as OrderFlow Bubble Tape.
The image above shows the feature in action.
Orderflow Bubble Tape is a visual tool that shows recent market trades ("tape") as bubbles, where each bubble represents a trade.
The size of each bubble indicates the trade size (volume), and the color shows whether the trade was a buy (aggressive at the ask) or sell (aggressive at the bid).
Instead of showing trades as plain text (like a traditional tape), the bubble format makes it easier to spot bursts of aggressive buying or selling visually.
Clusters of large, fast bubbles in one color suggest momentum or imbalances in order flow, often signaling short-term price pressure.
Traders use Bubble Tape to quickly read supply/demand dynamics, identify hidden buyers/sellers (like iceberg orders), and anticipate short-term price moves.
Blue Bubble = Buy
Red Bubble = Sell
The larger the bubble, the larger the order. Traders can hover over each bubble with their cursor to see the exact size of the order.
Delta Class Lines
OrderFlow IQ shows Live Delta Class Lines grouped by order size buckets:
The blue line shows delta coming only from very large orders (100K–10B in size).
The red line shows delta coming from medium-large orders (50K–100K size).
The green line shows delta from small to medium orders (0–50K size).
Each line is the cumulative net delta for its class — meaning it is adding the buy and sell imbalances only from trades of that size class, live as trades occur.
For example, when a 30K-sized aggressive buy hits, it adds to the green line; if a 70K-sized sell hits, it subtracts from the red line.
The number next to each label is the current net delta value for that class, telling you whether buyers or sellers are dominating at that order size.
• Three Custom Dollar Brackets – Define “small,” “mid,” and “block” trade-size ranges (e.g., 0–50 K, 50 K–100 K, > 100 K).
• Live Streaming Lines – While a bar is forming, watch real-time totals for each bracket plotted as vertical columns or stair-step lines on the chart edge.
CVD
OrderFlow IQ also displays CVD as either candles or a line.
The image above shows the candles visualization for CVD. CVD can be calculated using tick data, 1-second bars, or 1-minute bars. The higher the granularity the more accurate the measurement.
More Features To Come
New features and calculations will be added to OrderFlow IQ based on community feedback, so feel free to share any requests you might have!
Summary
OrderFlow IQ brings a full suite of order-flow analytics into one Pine Script: footprints, delta analytics, dollar-bracket classes, adaptive profiles, bubble tapes, live feeds, CVD meters, and iceberg scans. Its unified Data Granularity switch and Preset System let you toggle entire dashboards with a click—scalpers, intraday traders, and long-term analysts alike can dial in the exact microstructure view they need without switching scripts. Publish once, share your preset layouts, and your TradingView community gains plug-and-play access to professional-grade order-flow tools—no extra installations or feeds required.
Script a pagamento

Cluster Reversal Zones📌 Cluster Reversal Zones – Smart Market Turning Point Detector
📌 Category : Public (Restricted/Closed-Source) Indicator
📌 Designed for : Traders looking for high-accuracy reversal zones based on price clustering & liquidity shifts.
🔍 Overview
The Cluster Reversal Zones Indicator is an advanced market reversal detection tool that helps traders identify key turning points using a combination of price clustering, order flow analysis, and liquidity tracking. Instead of relying on static support and resistance levels, this tool dynamically adjusts to live market conditions, ensuring traders get the most accurate reversal signals possible.
📊 Core Features:
✅ Real-Time Reversal Zone Mapping – Detects high-probability market turning points using price clustering & order flow imbalance.
✅ Liquidity-Based Support/Resistance Detection – Identifies strong rejection zones based on real-time liquidity shifts.
✅ Order Flow Sensitivity for Smart Filtering – Filters out weak reversals by detecting real market participation behind price movements.
✅ Momentum Divergence for Confirmation – Aligns reversal zones with momentum divergences to increase accuracy.
✅ Adaptive Risk Management System – Adjusts risk parameters dynamically based on volatility and trend state.
🔒 Justification for Mashup
The Cluster Reversal Zones Indicator contains custom-built methodologies that extend beyond traditional support/resistance indicators:
✔ Smart Price Clustering Algorithm: Instead of plotting fixed support/resistance lines, this system analyzes historical price clustering to detect active reversal areas.
✔ Order Flow Delta & Liquidity Shift Sensitivity: The tool tracks real-time order flow data, identifying price zones with the highest accumulation or distribution levels.
✔ Momentum-Based Reversal Validation: Unlike traditional indicators, this tool requires a momentum shift confirmation before validating a potential reversal.
✔ Adaptive Reversal Filtering Mechanism: Uses a combination of historical confluence detection + live market validation to improve accuracy.
🛠️ How to Use:
• Works well for reversal traders, scalpers, and swing traders seeking precise turning points.
• Best combined with VWAP, Market Profile, and Delta Volume indicators for confirmation.
• Suitable for Forex, Indices, Commodities, Crypto, and Stock markets.
🚨 Important Note:
For educational & analytical purposes only.

Activity and Volume Orderflow Profile [AlgoAlpha]🔍 Activity and Volume Orderflow Profile 📊
🚀 Unlock the power of market order flow analysis with the Activity and Volume Orderflow Profile indicator by AlgoAlpha . This versatile tool helps you visualize and understand the dynamics of buying and selling pressure within a specified lookback period. Perfect for traders who want to dig deeper into volume-based market insights!
Key Features:
📊 Profile Type Options : Choose between "Comparison" and "Net Order Flow" to analyze market activity based on your preferred method.
🔎 Adjustable Lookback Period : Customize the lookback period to fit your trading strategy.
🎨 Flexible Appearance Settings : Toggle the display of the profile, lookback period visualization, and heatmap to suit your preferences.
🖍 Color Customization : Set your preferred colors for up and down volumes.
🕹 High Activity Highlight : Use the minimum transparency setting to highlight areas of significant activity.
Quick Guide to Using the Activity and Volume Orderflow Profile
🛠 Add the Indicator: Add the indicator to your favorites. Customize settings like profile type, lookback period, and resolution to fit your trading style.
📊 Market Analysis: Use the profile to identify areas of high buying or selling pressure. In "Comparison" mode, look for significant volume differences; in "Net Order Flow" mode, focus on net volume changes. Additionally, you can use the activity heatmap to find key levels that can act as support and resistance as price is likely to react to the zones as indicated by the heatmap.
How it Works:
The indicator operates by first gathering data on high and low prices, as well as buy and sell volumes, over a user-defined lookback period. It then calculates the maximum and minimum prices during this period and divides this range into bins based on the chosen resolution. For each bin, it computes the total volume of buy and sell orders. In "Comparison" mode, it displays side-by-side boxes representing buy and sell volumes, while in "Net Order Flow" mode, it shows the net volume difference. The indicator visually presents these profiles on the chart with customizable colors, transparency levels, and the option to display a heatmap for enhanced volume activity insights.
Maximize your trading with the Activity and Volume Orderflow Profile from AlgoAlpha! 🚀✨

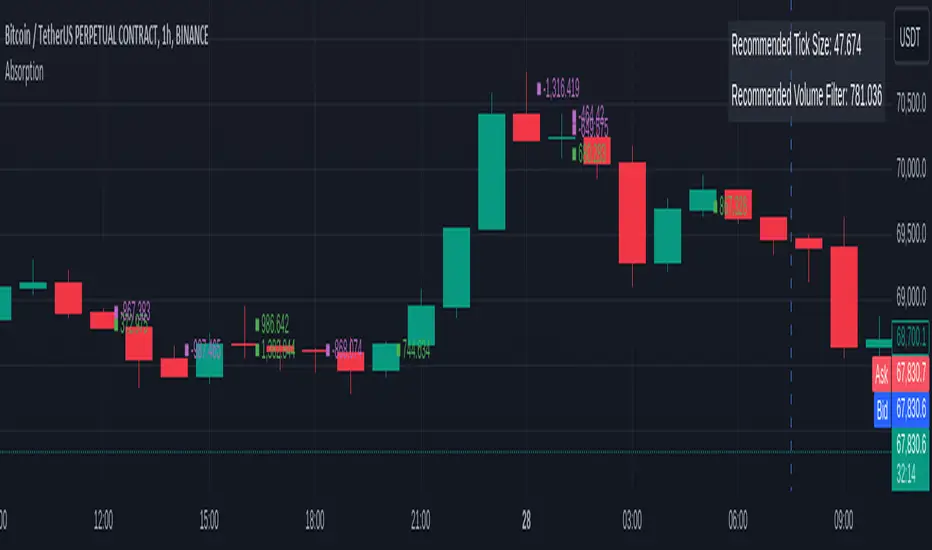
OrderFlow Absorption IndicatorWhat it Does
The OrderFlow Absorption Indicator marks areas where the price absorbs a large volume of aggressive market trades. This indicates areas where price may bounce back due to large limit (resting) orders absorbing significant aggressor volume (market orders). Absorption can also be seen as "preventing" or "stopping" the other side from breaking through a price level (e.g. bids stopping an influx of sell market orders). Absorption may signal a change in sentiment, potentially leading to a pullback or reversal.
An Example of Absorption
Of course, it is not always the case that such bullish absorption will initiate a trend as the example above. The OrderFlow Absorption Indicator merely serves as a tool for spotting possible absorption points in the market which you can incorporate into your trading arsenal.
How it Works
The indicator actively monitors price changes and records volume accumulated at a price level. If the price bounces back to at least where it was before the current price move, the indicator records this as absorption, provided it meets the Volume Requirement and optional Time Requirement.
How to Use it
1. Set Parameters
Choose your desired tick size and volume filter value. If unsure, refer to the table on the top right of the chart for recommended values. An automatic volume limit filter mode is also available.
Automatic Limit Mode : Enable this mode to have the indicator automatically select a volume filter value. It calculates the standard deviation of the last n minutes of volume and multiplies it by a volume multiplier. You can adjust these parameters.
Higher Volume Filter : Setting a higher volume filter value results in fewer, but higher quality detections, reducing noise.
2. Enabling the Time Limit
Enabling the time limit further improves detection quality by filtering out price levels that can defend against quick, sudden aggressive orders, acting as confirmation and indicating strong sentiment and resilient liquidity.
3. Enabling Historical Data Absorption
The indicator can also detect absorption in historical data, though less accurately than in real-time due to OHLCV aggregation.
You can select the granularity of historical data.
Lower granularity (e.g., 1 second) : Provides more accurate detections but may slow down the indicator.
Higher granularity : Improves speed but reduces detection accuracy.
Other Features
Hovering : When hovering over an absorption point, the interface reveals the price where the absorption occurred, along with the volume absorbed by the bids and asks, as well as the volume filter value used.
Delta Mode : In Delta mode, the system calculates the difference between the volume absorbed by bids and asks, revealing points only when the absolute value of this difference exceeds the volume filter value. Especially useful for larger tick sizes.
Troubleshooting
If the indicator doesn't mark anything, it means the traded volume hasn't exceeded the set volume filter value within the specified price intervals(tick size) and time limit. Adjust these settings as necessary.
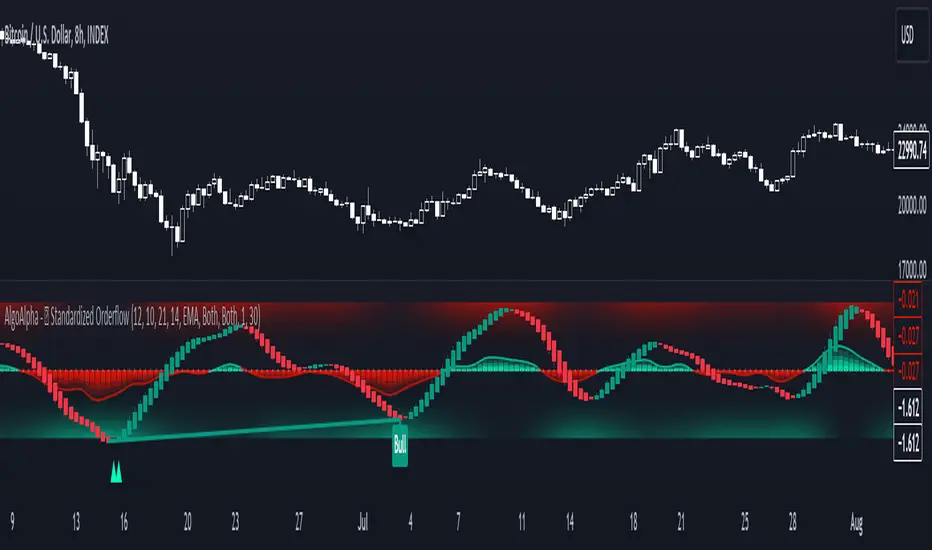
Standardized Orderflow [AlgoAlpha]Introducing the Standardized Orderflow indicator by AlgoAlpha. This innovative tool is designed to enhance your trading strategy by providing a detailed analysis of order flow and velocity. Perfect for traders who seek a deeper insight into market dynamics, it's packed with features that cater to various trading styles. 🚀📊
Key Features:
📈 Order Flow Analysis: At its core, the indicator analyzes order flow, distinguishing between bullish and bearish volume within a specified period. It uses a unique standard deviation calculation for normalization, offering a clear view of market sentiment.
🔄 Smoothing Options: Users can opt for a smoothed representation of order flow, using a Hull Moving Average (HMA) for a more refined analysis.
🌪️ Velocity Tracking: The indicator tracks the velocity of order flow changes, providing insights into the market's momentum.
🎨 Customizable Display: Tailor the display mode to focus on either order flow, order velocity, or both, depending on your analysis needs.
🔔 Alerts for Critical Events: Set up alerts for crucial market events like crossover/crossunder of the zero line and overbought/oversold conditions.
How to Use:
1. Setup: Easily configure the indicator to match your trading strategy with customizable input parameters such as order flow period, smoothing length, and moving average types.
2. Interpretation: Watch for bullish and bearish columns in the order flow chart, utilize the Heiken Ashi RSI candle calculation, and look our for reversal notations for additional market insights.
3. Alerts: Stay informed with real-time alerts for key market events.
Code Explanation:
- Order Flow Calculation:
The core of the indicator is the calculation of order flow, which is the sum of volumes for bullish or bearish price movements. This is followed by normalization using standard deviation.
orderFlow = math.sum(close > close ? volume : (close < close ? -volume : 0), orderFlowWindow)
orderFlow := useSmoothing ? ta.hma(orderFlow, smoothingLength) : orderFlow
stdDev = ta.stdev(orderFlow, 45) * 1
normalizedOrderFlow = orderFlow/(stdDev + stdDev)
- Velocity Calculation:
The velocity of order flow changes is calculated using moving averages, providing a dynamic view of market momentum.
velocityDiff = ma((normalizedOrderFlow - ma(normalizedOrderFlow, velocitySignalLength, maTypeInput)) * 10, velocityCalcLength, maTypeInput)
- Display Options:
Users can choose their preferred display mode, focusing on either order flow, order velocity, or both.
orderFlowDisplayCond = displayMode != "Order Velocity" ? display.all : display.none
wideDisplayCond = displayMode != "Order Flow" ? display.all : display.none
- Reversal Indicators and Divergences:
The indicator also includes plots for potential bullish and bearish reversals, as well as regular and hidden divergences, adding depth to your market analysis.
bullishReversalCond = reversalType == "Order Flow" ? ta.crossover(normalizedOrderFlow, -1.5) : (reversalType == "Order Velocity" ? ta.crossover(velocityDiff, -4) : (ta.crossover(velocityDiff, -4) or ta.crossover(normalizedOrderFlow, -1.5)) )
bearishReversalCond = reversalType == "Order Flow" ? ta.crossunder(normalizedOrderFlow, 1.5) : (reversalType == "Order Velocity" ? ta.crossunder(velocityDiff, 4) : (ta.crossunder(velocityDiff, 4) or ta.crossunder(normalizedOrderFlow, 1.5)) )
In summary, the Standardized Orderflow indicator by AlgoAlpha is a versatile tool for traders aiming to enhance their market analysis. Whether you're focused on short-term momentum or long-term trends, this indicator provides valuable insights into market dynamics. 🌟📉📈
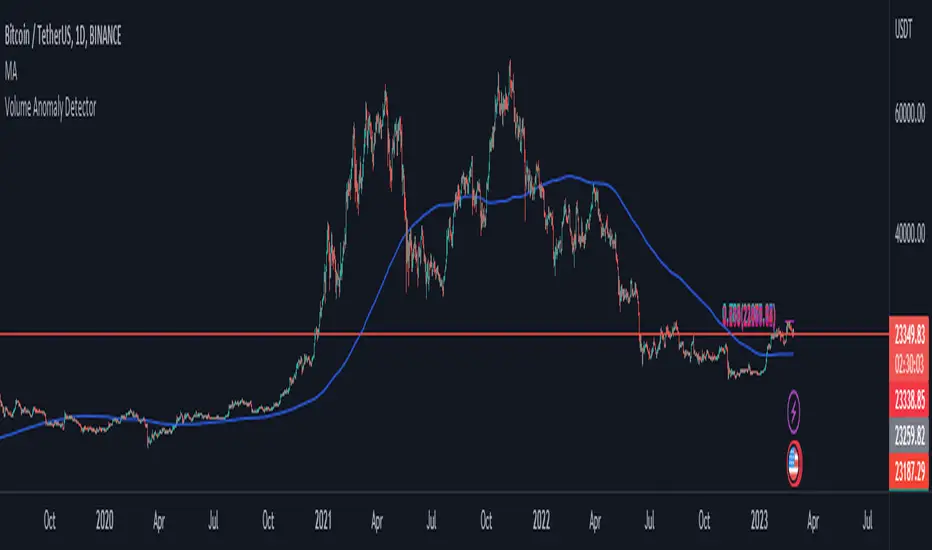
Volume Anomaly DetectorThis indicator is designed to detect volume anomalies such as block orders, large institutional orders, and sweep orders. It works by comparing the current volume to the moving average of volume and identifying deviations that exceed a specified threshold. By detecting anomalous volume, it can help traders identify potential market-moving events and anticipate changes in price direction.
One key difference between this indicator and others is its focus on volume anomalies rather than just overall volume or price movements. This can provide traders with additional insights into market conditions and help them identify trading opportunities that may not be visible using other indicators.
In terms of timeframe and market conditions, this indicator can be used on any timeframe and in any market where volume data is available. However, it may be particularly useful in markets with high liquidity and significant institutional participation, such as equities and futures markets. It may also be most effective during periods of heightened volatility or when significant news or events are expected to impact the market. As with any trading indicator, it's important to use it in conjunction with other tools and analysis to confirm signals and make informed trading decisions.
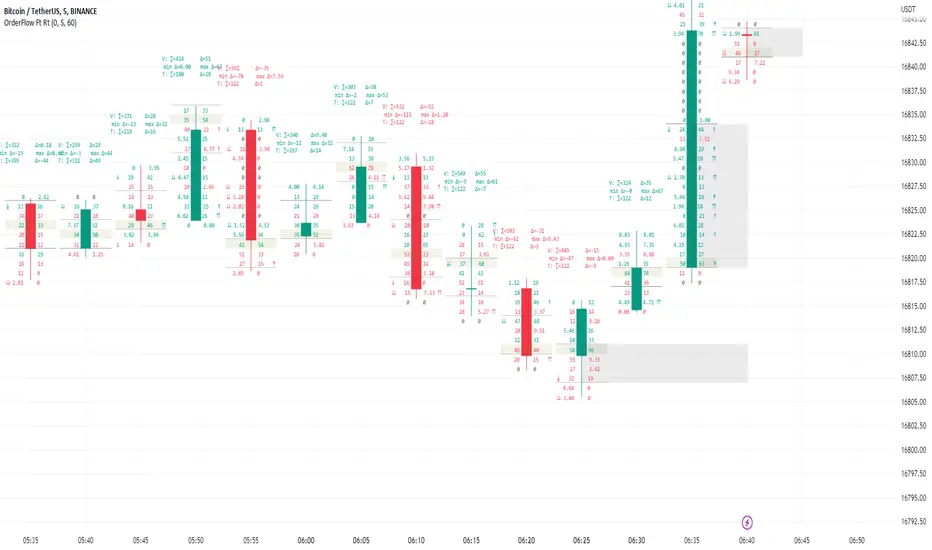
Order Flow Footprint Real-timeOrder Flow Footprint Real-time chart (also known as Cluster chart, bid/ask profile, bid/ask cluster, numbered bars) is a concept of drawing candle internal structure and showing bid and ask transactions inside the candle.
Values on left side of a candle are bids - Transactions done by active sellers with passive buyers.
Values on right side of a candle are asks - Transactions done by active buyers with passive sellers.
This script is a part of a toolkit called "Order Flow":
Order Flow Register - Register showing list of recently done transactions with clasification on bids and asks.
Order Flow Footprint Realtime - Tool showing bid and ask structure of transactions inside realtime candles.
Order Flow Footprint Estimation - Tool showing estimated bid and ask structure based on historical data.
This tool requires frequently updated real-time data to work efficiently. It cannot analyze historic charts. If you need footprint of historic data just use Order Flow Footprint Estimation instead.
Warning !
TradingView has a data delay feature on many exchanges (10-30 minutes) and real-time data are extra paid in that case. Missing real-time data source will limit the functionality of the script to educational purposes only.
User Interface:
Script is drawing volume values grouped into price slots. Price slots height is controled by slot height param in settings.
Volume values are clasified as bids and asks and draw on opposite sides of a candle. On left side of a candle bid volume values are shown and on right side ask volume values are shown.
Before bid values may appear symbols of sellers aggressiveness compared with buyers:
↓ - 3 times
↡ - 5 times
⇊ - 10 times
After ask values may appear symbol of buyers aggressiveness compared with sellers:
↑ - 3 time
↟ - 5 times
⇈ - 10 times
Above the candle we have some statistics of that candle:
"V:" - Row with volume statistics: ∑ - Total volume, Δ - Difference between asks and bids (typically negative in down trend and positive in up trend). Below the smallest and largest delta values recorded during this candle.
"T:" - Row with transaction estimations: ∑ - Estimation of total transactions, Δ - Difference between number of ask and bid transaction estimations
Script settings:
Slot height = 10^ - Price slot height on the chart:
0 - 1$
1 = 10$
2 = 100$
3 = 1000$
-1 = 0.1$
-2 = 0.01$
-3 = 0.001$
Font size - Font size used to draw all the data over the chart: Tiny, Small, Normal, Large
Centered - If checked volume labels are stick to candle
Draw bars - Option of drawing candles fiting to volume labels and 2 fields for picking colors of up and down candles.
Underline biggest slot - Option to underline price slot with biggest volume in the candle.
Color values - Option to draw labels with use of Ask and Bid colors, depending on which value is bigger in the price slot.
Troubleshooting:
In case of any problems, please send error details to the author of the script.
Order Flow RegisterOrder flow register is a tool showing history of transactions done recently. It analyze volume and price data to estimate how many "bid" and "ask" transaction was done on the market.
Typically bid transactions are done by active sellers (with passive buyers) and ask by active buyers (with passive sellers).
The advantage of ask transactions shows the emotions of buyers who are willing to pay more to buy.
The advantage of bid transactions shows the emotions of sellers who are willing to sell cheaper to exit the position.
This tool requires frequently updated real-time data to function efficiently.
Warning !
TradingView has a data delay feature on many exchanges (10-30 minutes) and real-time data are extra paid in that case. Missing real-time data source will limit the functionality of the script to educational purposes only.
User Interface:
In the table placed in the right-top corner you can find transaction data in 3 columns. First with bid transaction volume, second with price and third with ask transaction volume.
Value shown between "Ask" and "Bid" labels is showing price change done with last transaction (usefull when agregate option is on).
If agregate option is on:
- Addition row with last registered transaction is shown over labels(row with "Big" and "Ask" label).
- Price label of active row (first below the labels) has changing background color linearly between ask and bid value depending in which part of agregated price slot current price is.
Script settings:
Agregate - Option to agregate transactions into areas of some height
FieldHeight = 10^ - Area height on the chart:
0 - 1$
1 = 10$
2 = 100$
3 = 1000$
-1 = 0.1$
-2 = 0.01$
-3 = 0.001$
Troubleshooting:
In case of any problems, please send error details to the author of the script.

[VC] Cumulative Delta Volume BarsLet's first learn what is Delta & How to Use Cumulative Delta Volume Bars?
Cumulative Delta Volume Bars is one of the leading indicators that you can use when trading order flow. It gives you an instant snapshot of the buying and selling pressure in a market.
After reading the detailed description of "Cumulative Delta Volume Bars," you will understand how volume delta provides a critical edge by allowing you to spot significant potential reversals in the market. You will also learn to use this Cumulative Delta indicator in depth. (including rest session usability features)
What is Delta Volume?
Delta Volume is the difference between Buying and Selling Power. Delta Volume is calculated by taking the difference between the volume traded at the offer price and the volume traded at the bid price. (in simple words, the difference between buying pressure & selling pressure)
If delta volume is more than zero, you have more buying pressure than selling & vice versa, and if delta volume is less than zero, you have more selling pressure than buying.
In Order-Flow Analysis , traders used Cumulative Delta to measure the relationship between the Buying & Selling pressure Vs Price.
Cumulative delta volume takes the delta values for every bar and successively adds them together to provide a graph, as seen below visually.
Let me demonstrate by giving examples of how cumulative Delta can help measure the buying or selling pressure relative to the price move.
★ Trading Absorption & Exhaustion concepts with Delta
See the chart below & try to analyze the next possible move on the basses on the analysis mentioned on the chart.
➽➽ If you said Short, you were correct. ✅
Till Point A , both price & cumulative were aligned. (means there were no imbalances between Delta & Price).
But on Point B , the Cumulative Delta broke the previous resistance clearly and moved even further away from the resistance level, but the Price couldn't break the last resistance. It interprets that buyers applied a lot of buying pressure but no result. (Aggressive buying pressure absorbed by Passive sellers)
Due to this vast effort or failed attempt, buyers were exhausted and had no more strength to pull the Price up. That's why the Price reversed from Point B . See below image
★ Cumulative Delta Volume Bars is helpful when determining buying or selling pressure at different key price levels, such as swing highs or lows.
Let's recap on swing highs and swing lows.
➽ A swing high (S.H) is formed when the high reaches higher than the price action around it. Once the Price moves above a prior swing high and begins to retrace, a new swing high is formed.
➽ A swing low (S.L) is formed when the low reaches lower than price action around it. Once the Price moves below a prior swing low and begins to retrace, a new swing low is formed.
➽ When the Price makes higher highs and higher lows, a market is considered an uptrend.
➽ When the Price is making lower lows followed by lower highs, a market is considered a downtrend.
When evaluating Delta, it's beneficial to compare delta values at swing lows or swing highs to determine the amount of selling or buying pressure and how the market reacts.
The actual Power of Delta is revealed when we use it to determine the market's reaction to powerful buying or selling. We want to see if the market has reacted as we would expect or not.
In the above Example, you will notice that every time price breaks a swing, Delta does as well.
It makes sense as it takes selling pressure to break a swing low or buying pressure to break a swing high. In simple words, we can say that there is no anomaly between delta direction & price direction.
In simple words (No Absorption or Exhaustion)
But what's occurring when this isn't the case, and we have divergence between Price and Delta? Let's analyze it with real examples.
★ Understanding Delta Divergence.
(Lack of Harmony in Buying/Selling Pressure & Price Move)
Notice how the Price breaks out of the previous resistance level on the above chart, but the Delta didn't yet reach even close to its last resistance level. It's a clear divergence between Price and Delta. Buyers may be slightly exhausted at the previous resistance level, and Price & Delta may retrace slightly. But in a broader view, it reflects a strong bullish signal.
See the above chart & see when and why the Price moved. I hope it will help you understand the underlying relation & story between Price & Delta.
Cumulative Delta & Trade Management
Delta will help you spot significant reversals, but it can also be used to help manage your open trade. You want to see a high correlation between Delta and Price when in a long or short position.
Suppose you're short while the Price is breaking a new low. You want to see Delta breaking low if sellers aren't interested in selling at the recent lows, represented by Delta not breaking lows. The probability of a short term reversal or a significant retrace increases.
When in a position, always be on the lookout for exhaustion and absorption, signalling a reversal potential.
What Includes in V.C Cumulative Delta Volume Bars Indicator
Inputs & Settings
Reset accumulation on new session:
Allows you to rest accumulation at the start of each session (you may choose your customized starting & ending time as well by enabling ''Customize Rest Session Time''
Start/End of Session & During Session:
Allows you to show/hide & choose the background color & separator of each session
''Customize Rest Session Time''
When this setting is enabled, your customized given time will be applied, which can be set from the below box. Note: set your time in minutes. For Example, if you want to reset the session after every hour, you need to put 60. If you're going to reset after every 8 hours, you need to put 480. Additionally, your chart time frame must be lower than your customized rest time.
Reset Each Minutes:
Allows you to put your desired rest time in minutes. For Example, for 1 hour 60, for 8 hours 480. (8x60)
Reset Each:
Allows you to choose rest time from the drop-down menu. Note: To apply this setting, don't enable the ''CUSTOMIZE RESET SESSION TIME''.
Select Session:
Allows you to set customized starting & ending times of the session instead of the exchange's default time. For Example, the exchange reset time is 20:00, but if you want 22:00, first, you need to set your chart time as an exchange from the right bottom of the chart, and then you need to put 22:00 22:00 in both fields. Note: Put the same starting & ending time. In simple words, it should not be greater than or less than 24 hours.
Type:
It allows you to select Delta type. (there are two delta types you can choose from, 1st Simple Delta, 2nd Delta % or Volume Weighted Delta)
Candle Colors:
Allows you to change the color of candles.
Envelope Indicator:
Allows you to apply to Envelop Indicator on the delta candle. (all default settings of the Envelop Indicator can be customized as well)
See the below chart with Envelop applied to Delta Candles & Price Candles. (can be used to measure the Delta & Price movement at the micro-level)
Bollinger Bands Indicator:
Allows you to apply to Bollinger Bands Indicator on the delta candle. (all default settings of the Bollinger Bands Indicator can be customized as well)
See the below chart with Bollinger Bands applied to Delta Candles & Price Candles. (can be used to measure the Delta & Price movement at the micro-level)
Start/End of Session on Chart
Allows you to change the first & last candle of the session.
Style Settings:
Allows you to control all the visual settings of delta candles, Envelop & Bollinger bands.
-------------------------------------------------
➽Conclusion:
Cumulative Volume Delta Bars is one of the leading indicators you can include as an order flow trader in your arsenal. It gives you an inside look at buying and selling pressure and how the market reacts.
But Keep in mind, in trading & technical analysis, nothing is 100% certain. No indicator can give you a 100% success rate. There is no holy grail in the financial market. As a trader, with the help of technical & fundamental indicators, our goal is to find an edge over the market. A simple definition of an edge is: Anything that adds a few points to the winning side of an equation builds an edge that lasts a lifetime. A trading edge defines your technical or strategic advantage in the highly competitive market environment. Traders can establish multiple edges by starting with popular strategies and customizing rules to lower the risk of getting trapped with the emotional crowd.
Disclaimer Note:
V.C Cumulative Delta Volume Bars It is purely Volume, Delta, Demand & Supply imbalance and comparative analysis based tool. Before applying this Indicator to your study, you should know about Volume, Delta & Spread, Demand & Supply, and Aggressive & Passive behaviour of buyers/sellers.
Some basic understanding of Sir Richerd Wyckoff's Theory can also be helpful.
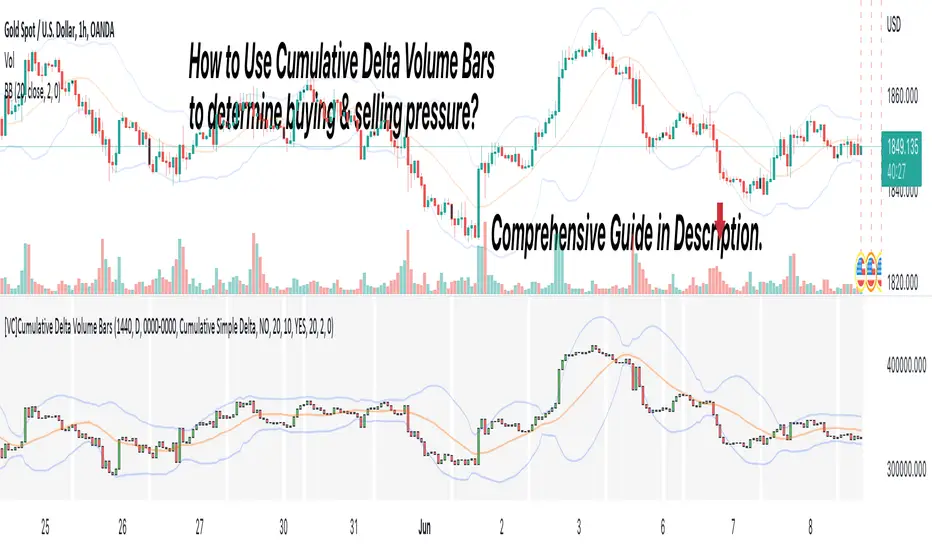
[VC] Effort & Result Index V1.0V.C. Effort & Result Index draws the Price change, Volume, Delta & Delta % as a histogram. On the positive side of the histogram, it marks the price change & on the negative side of the histogram, it marks volume, delta & delta %. And the best part of the indicator is that it allows you to see all the mentioned data types simultaneously.
See the below chart for a comprehensive understanding.
Before moving further, understand the below analogy first.
Volume & Delta = Fule or Effort
Price Movement = Result
Think of Volume & Delta as FULE or EFFORT and Price Movement as Result.
If the price travels a significant distance with less fule & effort, it indicates that no barriers or inverse forces are stopping the price movement.
On the other hand, if the price is travelling a less distance & consuming comparatively more fule & effort, it indicates some barriers or inverse forces stopping the price movement.
V.C. Effort & Result Index empowers you to read, compare & analyse Volume, Delta & Price effortlessly. It helps to measure the relative price change in different combinations. Such as, you can compare the price change with total volume, delta volume & delta percentage.
See the below relative comparison analysis by using Price Change, Volume Change & Delta Change.
In the above example, you can see that on candle A, there is a very significant price move with a small volume & delta. But on the next candle B, there is a minor price move compared to the previous candle A, but the volume is relatively high & delta is almost the same. In simple words, the same effort was applied to candle B but got fewer results than candle A. It indicates that buyers applied the same effort but failed to get the same results. It reveals that sellers are taking control, leading to a trend reversal.
This comparative analysis method & approach can add an extra edge to your analysis spacially on key levels & breakouts.
V.C Effort & Result Index Settings & Inputs
Price Change:
Allow you to show/hide the price change bars on the positive side of the histogram.
Volume:
Allow you to show/hide the total volume on the negative side of the histogram.
Delta%:
Allow you to show/hide the delta % on the negative side of the histogram.
Delta:
Allow you to show/hide the delta on the negative side of the histogram.
Style Settings
The Style section allows you to change the colors & the view format of all data types.
Disclaimer Note:
V.C Effort & Result Index is not a BUY/SELL signal based indicator or a holy grail trading system.
It is purely Volume, Delta, Demand & Supply imbalance and comparative analysis based tool kit. Before applying this indicator to your analysis, you should know about Volume, Delta & Spread, and Demand & Supply.
Some basic understanding of Sir Richerd Wyckoff's Theory can also be helpful.

Buy & Sell Order (Expo)
Buy/Sell Order (Expo) is a unique and important indicator that provides information about Buy & Sell order patterns. The indicator helps to identify real-time large Buy & Sell Orders that have a significant impact on the price. These buy and sell orders can be the start of a trend move or a sign of reversal.
The indicator is divided into a Sell-side (red zone) and a Buy-side (green zone) in order to highlight the different order flows. Greater candlesticks mean significant buy/sell orders! These are the ones we want to keep track of.
The price levels where a large Buy or Sell order occurs at should be considered as key levels. These key- levels are often re-tested in the future. Traders should keep track of them.
Real-Time
No Repainting
Works on any market and in any timeframe
HOW TO USE
Identify Large Buy / Sell Order
Identify potential trend move
Identify potential reversal
INDICATOR IN ACTION
1-hour chart
I hope you find this indicator useful , and please comment or contact me if you like the script or have any questions/suggestions for future improvements. Thanks!
I will continually work on this indicator, so please share your experience and feedback as it will enable me to make even better improvements. Thanks to everyone that has already contacted me regarding my scripts. Your feedback is valuable for future developments!
-----------------
Disclaimer
Copyright by Zeiierman.
The information contained in my scripts/indicators/ideas does not constitute financial advice or a solicitation to buy or sell any securities of any type. I will not accept liability for any loss or damage, including without limitation any loss of profit, which may arise directly or indirectly from the use of or reliance on such information.
All investments involve risk, and the past performance of a security, industry, sector, market, financial product, trading strategy, or individual’s trading does not guarantee future results or returns. Investors are fully responsible for any investment decisions they make. Such decisions should be based solely on an evaluation of their financial circumstances, investment objectives, risk tolerance, and liquidity needs.
My scripts/indicators/strategies/ideas are only for educational purposes!
ACCESS THE INDICATOR
• Contact me on TradingView or use the links below
