Quad Rotation StochasticQuad Rotation Stochastic
The Quad Rotation Stochastic is a powerful and unique momentum oscillator that combines four different stochastic setups into one tool, providing an incredibly detailed view of market conditions. This multi-timeframe stochastic approach helps traders better anticipate trend continuations, reversals, and momentum shifts with greater precision than traditional single stochastic indicators.
Why this indicator is useful:
Multi-layered Momentum Analysis: Instead of relying on one stochastic, this script tracks four independent stochastic readings, smoothing out noise and confirming stronger signals.
Advanced Divergence Detection: It automatically identifies bullish and bearish divergences for each stochastic, helping traders spot potential reversals early.
Background Color Alerts: When a configurable number (e.g., 3 or 4) of the stochastics agree in direction and position (overbought/oversold), the background colors green (bullish) or red (bearish) to give instant visual cues.
ABCD Pattern Recognition: The script recognizes "shield" patterns when Stochastic 4 remains stuck at extreme levels (above 90 or below 10) for a set time, warning of potential trend continuation setups.
Super Signal Alerts: If all four stochastics align in extreme conditions and slope in the same direction, the indicator plots a special "Super Signal," offering high-confidence entry opportunities.
Why this indicator is unique:
Quad Confirmation Logic: Combining four different stochastics makes this tool much less prone to false signals compared to using a single stochastic.
Customizable Divergence Coloring: Traders can choose to have divergence lines automatically match the stochastic color for clear visual association.
Adaptive ABCD Shields: Innovative use of bar counting while a stochastic remains extreme acts as a "shield," offering a unique way to filter out minor fake-outs.
Flexible Configuration: Each stochastic's sensitivity, divergence settings, and visual styling can be fully customized, allowing traders to adapt it to their own strategy and asset.
Example Usage: Trading Bitcoin with Quad Rotation Stochastic
When trading Bitcoin (BTCUSD), you might set the minimum count (minCount) to 3, meaning three out of four stochastics must be in agreement to trigger a background color.
If the background turns green, and you notice an ABCD Bullish Shield (Green X), you might look for bullish candlestick patterns or moving average crossovers to enter a long trade.
Conversely, if the background turns red and a Super Down Signal appears, it suggests high probability for further downside, giving you strong confirmation to either short BTC or avoid entering new longs.
By combining divergence signals with background colors and the ABCD shields, the Quad Rotation Stochastic provides a layered confirmation system that gives traders greater confidence in their entries and exits — particularly in fast-moving, volatile markets like Bitcoin.
Oscillator-overbought

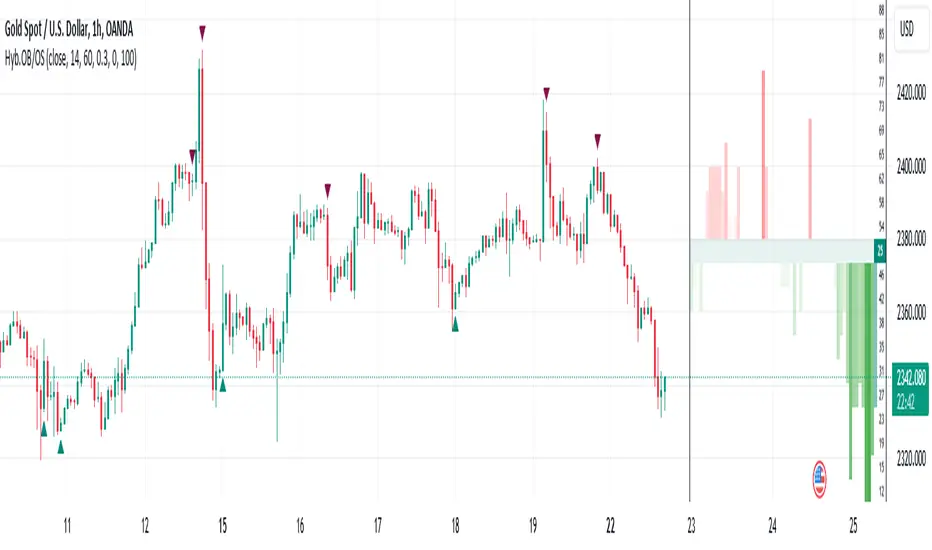
Hybrid Overbought/Oversold OverlayIntroduction
This is a new representation of my well-known oscillator Hybrid Overbought/Oversold Detector overlaid on the chart. The script utilizes the following 12 different oscillators to bring forth a new indicator which I call it Hybrid OB/OS .
Utilized Oscillators
The utilized oscillators here are:
Bollinger Bands %B
Chaikin Money Flow (CMF)
Chande Momentum Oscillator (CMO)
Commodity Channel Index (CCI)
Disparity Index (DIX)
Keltner Channel %K
Money Flow Index (MFI)
Rate Of Change (ROC)
Relative Strength Index (RSI)
Relative Vigor Index (RVI/RVGI)
Stochastic
Twiggs Money Flow (TMF)
The challenging part of utilizing mentioned oscillators was that some of their formulas range are not similar and some of them does not have a mathematical range at all. So I used a normalization function to normalize all their output values to (0, 100) interval.
Overbought/Oversold Levels Calculation
I noticed that the levels which considered as OB/OS level by various traders for each of the utilized oscillators are so different, e.g., many traders consider 30 as OS level and 70 as OB level for RSI and some others take 20 and 80 as the levels, or some traders consider 20 and 80 as OS/OB levels for Stochastic oscillator. Also these levels could be different on different assets, e.g., OB/OS levels for CCI on EURUSD chart might be 80 and 20 while the levels on BTCUSDT chart might be 75 and 25, and so on.
So I decided to make a routine to automate the calculation of these levels using historical data. By this feature, my indicator would calculate the corresponding levels for the oscillators on current chart and then decide about the overbought/oversold situation of each one, which leads to a more accurate Hybrid OB/OS indication.
As the result, if all 12 individual oscillators say it's overbought/oversold, the Hybrid OB/OS shows 100% overbought/oversold, vice versa, if none of them say it's overbought/oversold, the Hybrid OB/OS shows 0, and so on.
The Overlaying Oscillator Problem!
A programming-related challenge here was that Pine Script assigns two separate spaces to the oscillators and the overlaid indicators, and the programmers are limited to use just one of them in each of their codes.
Knowing this, I was forced to simulate the oscillator space on the chart and display my oscillator as a diagram somehow. Of course it won't be as nice as the oscillator itself, because the relation between the main chart bars and the oscillator bars could not be obtained, but it's better than nothing!
Settings and Usage
The indicator settings contain some options about the calculations, the diagram display and the signals appearance. By default they are fine, but you could change them as you prefer.
This indicator is better to be used alongside other indicators as a confirmation (specially in counter-trend strategies I believe). Also it generates an external signal which you could use it in your own designed indicators as well.
Feel free to test it and also the former form of the Hybrid OB/OS . Good Luck!
Stochastic Vix Fix SVIX (Tartigradia)The Stochastic Vix or Stochastic VixFix (SVIX), just like the Williams VixFix, is a realized volatility indicator, and can help in finding market bottoms as well as tops without requiring bollinger bands or any other construct, as the SVIX is bounded between 0-100 which allows for an objective thresholding regardless of the past.
Mathematically, SVIX is the complement of the original Stochastic Oscillator, with such a simple transform reproducing Williams' VixFix and the VIX index signals of high volatility and hence of market bottoms quite accurately but within a bounded 0-100 range. Having a predefined range allows to find markets bottoms without needing to compare to past prices using a bollinger band (Chris Moody on TradingView) nor a moving average (Hesta 2015), as a simple threshold condition (by default above 80) is sufficient to reliably signal interesting entry points at bottoming prices.
Having a predefined range allows to find markets bottoms without needing to compare to past prices using a bollinger band (Chris Moody on TradingView) nor a moving average (Hesta 2015), as a simple threshold condition (by default above 80) is sufficient to reliably signal interesting entry points at bottoming prices.
Indeed, as Williams describes in his paper, markets tend to find the lowest prices during times of highest volatility, which usually accompany times of highest fear.
Although the VixFix originally only indicates market bottoms, the Stochastic VixFix can also indicate good times to exit, when SVIX is at a low value (default: below 20), but just like the original VixFix and VIX index, exit signals are as usual much less reliable than long entries signals, because: 1) mature markets such as SP500 tend to increase over the long term, 2) when market fall, retail traders panic and hence volatility skyrockets and bottom is more reliably signalled, but at market tops, no one is panicking, price action only loses momentum because of liquidity drying up.
Compared to Hesta 2015 strategy of using a moving average over Williams' VixFix to generate entry signals, SVIX generates much fewer false positives during ranging markets, which drastically reduce Hesta 2015 strategy profitability as this incurs quite a lot of losses.
This indicator goes further than the original SVIX, by restoring the smoothed D and second-level smoothed D2 oscillators from the original Stochastic Oscillator, and use a 14-period ZLMA instead of the original 20-period SMA, to generate smoother yet responsive signals compared to using just the raw SVIX (by default, this is disabled, as the original raw SVIX is used to produce more entry signals).
Usage:
Set the timescale to daily or weekly preferably, to reduce false positives.
When the background is highlighted in green or when the highlight disappears, it is usually a good time to enter a long position.
Red background highlighting can be enabled to signal good exit zones, but these generate a lot of false positives.
To further reduce false positives, the SVIX_MA can be used to generate signals instead of the raw SVIX.
For more information on Williams' Vix Fix, which is a strategy published under public domain:
The VIX Fix, Larry Williams, Active Trader magazine, December 2007, web.archive.org
Fixing the VIX: An Indicator to Beat Fear, Amber Hestla-Barnhart, Journal of Technical Analysis, March 13, 2015, ssrn.com
For more information on the Stochastic Vix Fix (SVIX), published under Creative Commons:
Replicating the CBOE VIX using a synthetic volatility index trading algorithm, Dayne Cary and Gary van Vuuren, Cogent Economics & Finance, Volume 7, 2019, Issue 1, doi.org
Note: strangely, in the paper, the authors failed to mention that the SVIX is the complement of the original Stochastic Oscillator, instead reproducing just the original equation. The correct equation for the SVIX was retroengineered by comparing charts they published in the paper with charts generated by this pinescript indicator.
For a more complete indicator, see:
