RSI(Min-Max)RSI (Min-Max) is an enhanced version of Welles Wilder's Relative Strength Index, designed to offer greater analytical precision and dynamic insight into the behavior of the RSI within each candlestick.In addition to displaying the traditional RSI value, this script calculates the possible extreme values — the minimum and maximum RSI — based on the low and high prices of the current candle. This allows you to estimate how the RSI would react if the price moved to the extremes of the bar, providing a predictive and refined reading of momentum.
Oscillatorstrategy

Momentum Variance OscillatorWhat MVO measures:
-PV (Price-Volume) Oscillator – how far price is from a volatility-scaled basis, then weighted by relative volume.
- > 0 = bullish pressure; < 0 = bearish pressure.
-|PV| larger ⇒ stronger momentum.
-Signal line (EMA of PV) – a smoother track of PV; crossings flag momentum shifts.
-Zero line gradient – instantly shows direction (greenish bull / reddish bear) and strength (paler → stronger).
-Extreme bands (±obLevel) – “hot zone” thresholds; being beyond them = exceptional push.
-Variance histogram – MACD-like view (PV minus slower PV-EMA) to see thrust building vs. fading.
-(Optional) Bar coloring & background tint – paints price bars and/or the panel on key events so you can read the regime at a glance.
-Auto-Tune – searches a grid of (obLevel, weakLvl) pairs and (optionally) auto-applies the best, ranked by CAGR vs. drawdown.
Core signals & how to trade them:
1) Define the regime:
-Bullish regime: PV above 0 and/or PV above Signal; zero line is in bull gradient.
-Bearish regime: PV below 0 and/or PV below Signal; zero line is in bear gradient.
-Action: Prefer trades with the regime (avoid fading strong color/strength unless you have a clear reversal setup).
2) Entries:
Momentum entry:
-Long: PV crosses above Signal while PV > 0.
-Short: PV crosses below Signal while PV < 0.
Breakout/acceleration:
-Long add-on: PV crosses above +obLevel (extreme top) and holds.
-Short add-on: PV crosses below −obLevel (extreme bottom) and holds.
-Histogram confirm: Growing bars in your direction = thrust improving; shrinking/flip = thrust stalling.
3) Exits / risk:
-Soft exit / tighten stops: PV loses the extreme and re-enters inside, or histogram fades/turns against you.
-Hard exit / reverse: Opposite PV↔Signal crossover and PV crosses the zero line.
-Weak zone filter: If |PV| < weakLvl, treat signals as lower quality (smaller size or skip).
4) Practical setup - Suggested defaults (good starting point):
-Signal length: 26
-Volume power: 0.50
-obLevel (extreme): 2.00
-weakLvl: 0.75
-Show histogram & dots: On
-Auto-Tune (recommended)
-Turn Auto-Select Best ON. MVO will scan obLevel 1.50→3.00 (step 0.05) and weakLvl 0.50→1.00 (step 0.05), then use the top-ranked pair (CAGR/(1+MDD)).
-If you want to see the top combos, enable the Optimizer Table (Top-3).
5) Visual options
-Bar Colors: Regime+Strength – bars follow the zero-line gradient (great for quick read).
-Extremes – paint only when beyond ±obLevel.
-Cross Signals – paint only on the bar that crosses an extreme.
-Background on breach: A one-bar tint when PV crosses an extreme.
6) Example playbook:
Long setup:
-Zero line shows bull gradient and PV > 0.
-PV crosses above Signal (entry).
-If PV drives above +obLevel, consider add-on; trail under the last minor swing or use ATR.
-Exit/trim on PV crossing below Signal or histogram turning negative; flatten on a drop through 0.
Short setup mirrors the above on the bear side.
7) Tips to avoid common traps:
-Don’t fade strong extremes without clear confirmation (e.g., PV re-entering inside + histogram flip).
-Respect the weak zone: if |PV| < weakLvl, signals are fragile—size down or wait.
-Align with structure: higher-timeframe trend and SR improve expectancy.
-Instrument personality matters: use Auto-Tune or re-calibrate obLevel/weakLvl across assets/timeframes.
8) Alerts you can set:
-Bull Signal X – PV crossed above Signal
-Bear Signal X – PV crossed below Signal
-Bull Baseline X – PV crossed above 0
-Bear Baseline X – PV crossed below 0

Parsifal.Swing.CompositeThe Parsifal.Swing.Composite indicator is a module within the Parsifal Swing Suite, which includes a set of swing indicators such as:
• Parsifal Swing TrendScore
• Parsifal Swing Composite
• Parsifal Swing RSI
• Parsifal Swing Flow
Each module serves as an indicator facilitating judgment of the current swing state in the underlying market.
________________________________________
Background
Market movements typically follow a time-varying trend channel within which prices oscillate. These oscillations—or swings—within the trend are inherently tradable.
They can be approached:
• One-sidedly, aligning with the trend (generally safer), or
• Two-sidedly, aiming to profit from mean reversions as well.
Note: Mean reversions in strong trends often manifest as sideways consolidations, making one-sided trades more stable.
________________________________________
The Parsifal Swing Suite
The modules aim to provide additional insights into the swing state within a trend and offer various trigger points to assist with entry decisions.
All modules in the suite act as weak oscillators, meaning they fluctuate within a range but are not bounded like true oscillators (e.g., RSI, which is constrained between 0% and 100%).
________________________________________
The Parsifal.Swing.Composite – Specifics
This module consolidates multiple insights into price swing behavior, synthesizing them into an indicator reflecting the current swing state.
It employs layered bagging and smoothing operations based on standard price inputs (OHLC) and classical technical indicators. The module integrates several slightly different sub-modules.
Process overview:
1. Per candle/bin, sub-modules collect directional signals (up/down), with each signal casting a vote.
2. These votes are aggregated via majority counting (bagging) into a single bin vote.
3. Bin votes are then smoothed, typically with short-term EMAs, to create a sub-module vote.
4. These sub-module votes are aggregated and smoothed again to generate the final module vote.
The final vote is a score indicating the module’s assessment of the current swing state. While it fluctuates in a range, it's not a true oscillator, as most inputs are normalized via Z-scores (value divided by standard deviation over a period).
• Historically high or low values correspond to high or low quantiles, suggesting potential overbought or oversold conditions.
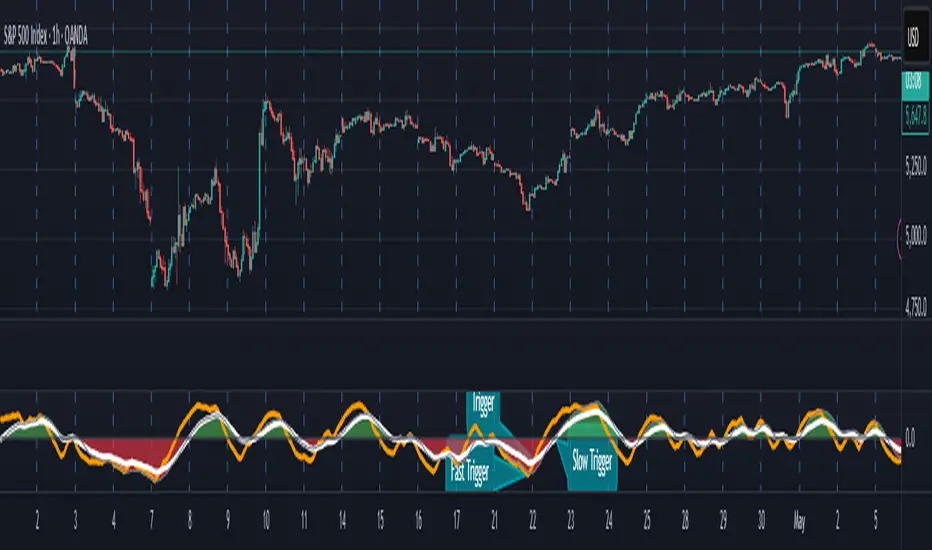
• The chart displays a fast (orange) and slow (white) curve against a solid background state.
• Extreme values followed by curve reversals may signal upcoming mean-reversions.
Background Value:
• Value > 0: shaded green → bullish mode
• Value < 0: shaded red → bearish mode
• The absolute value indicates confidence in the mode.
________________________________________
How to Use the Parsifal.Swing.Composite
Several change points in the indicator serve as potential entry triggers:
• Fast Trigger: change in slope of the fast curve
• Trigger: fast line crossing the slow line or change in the slow curve’s slope
• Slow Trigger: change in sign of the background value
These are illustrated in the introductory chart.
Additionally, market highs and lows aligned with swing values may act as pivot points, support, or resistance levels for evolving price processes.
________________________________________
As always, supplement this indicator with other tools and market information. While it provides valuable insights and potential entry points, it does not predict future prices. It reflects recent tendencies and should be used judiciously.
________________________________________
Extensions
All modules in the Parsifal Swing Suite are simple yet adaptable, whether used individually or in combination.
Customization options:
• Weights in EMAs for smoothing are adjustable
• Bin vote aggregation (currently via sum-of-experts) can be modified
• Alternative weighting schemes can be tested
Advanced options:
• Bagging weights may be historical, informational, or relevance-based
• Selection algorithms (e.g., ID3, C4.5, CAT) could replace the current bagging approach
• EMAs may be generalized into expectations relative to relevance-based probability
• Negative weights (akin to wavelet transforms) can be incorporated
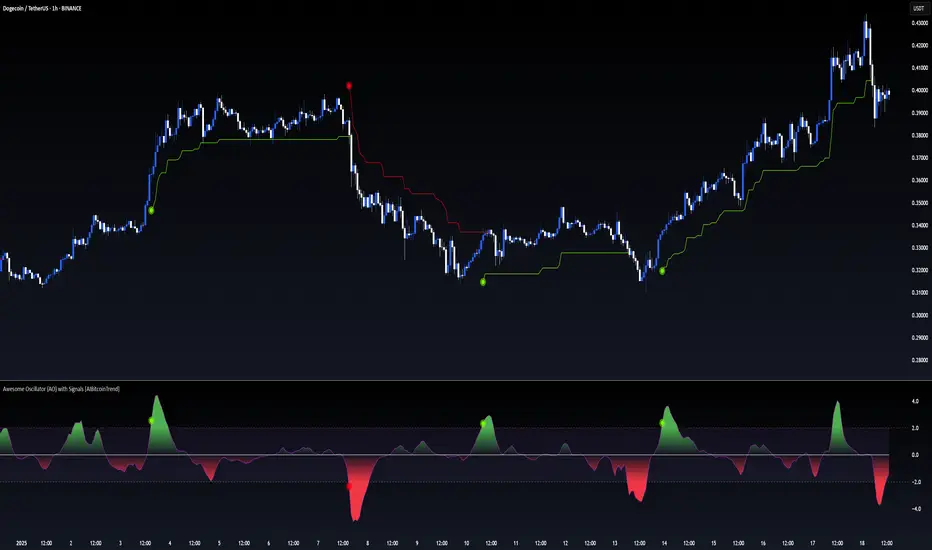
Awesome Oscillator (AO) with Signals [AIBitcoinTrend]👽 Multi-Scale Awesome Oscillator (AO) with Signals (AIBitcoinTrend)
The Multi-Scale Awesome Oscillator transforms the traditional Awesome Oscillator (AO) by integrating multi-scale wavelet filtering, enhancing its ability to detect momentum shifts while maintaining responsiveness across different market conditions.
Unlike conventional AO calculations, this advanced version refines trend structures using high-frequency, medium-frequency, and low-frequency wavelet components, providing traders with superior clarity and adaptability.
Additionally, it features real-time divergence detection and an ATR-based dynamic trailing stop, making it a powerful tool for momentum analysis, reversals, and breakout strategies.
👽 What Makes the Multi-Scale AO – Wavelet-Enhanced Momentum Unique?
Unlike traditional AO indicators, this enhanced version leverages wavelet-based decomposition and volatility-adjusted normalization, ensuring improved signal consistency across various timeframes and assets.
✅ Wavelet Smoothing – Multi-Scale Extraction – Captures short-term fluctuations while preserving broader trend structures.
✅ Frequency-Based Detail Weights – Separates high, medium, and low-frequency components to reduce noise and improve trend clarity.
✅ Real-Time Divergence Detection – Identifies bullish and bearish divergences for early trend reversals.
✅ Crossovers & ATR-Based Trailing Stops – Implements intelligent trade management with adaptive stop-loss levels.
👽 The Math Behind the Indicator
👾 Wavelet-Based AO Smoothing
The indicator applies multi-scale wavelet decomposition to extract high-frequency, medium-frequency, and low-frequency trend components, ensuring an optimal balance between reactivity and smoothness.
sma1 = ta.sma(signal, waveletPeriod1)
sma2 = ta.sma(signal, waveletPeriod2)
sma3 = ta.sma(signal, waveletPeriod3)
detail1 = signal - sma1 // High-frequency detail
detail2 = sma1 - sma2 // Intermediate detail
detail3 = sma2 - sma3 // Low-frequency detail
advancedAO = weightDetail1 * detail1 + weightDetail2 * detail2 + weightDetail3 * detail3
Why It Works:
Short-Term Smoothing: Captures rapid fluctuations while minimizing noise.
Medium-Term Smoothing: Balances short-term and long-term trends.
Long-Term Smoothing: Enhances trend stability and reduces false signals.
👾 Z-Score Normalization
To ensure consistency across different markets, the Awesome Oscillator is normalized using a Z-score transformation, making overbought and oversold levels stable across all assets.
normFactor = ta.stdev(advancedAO, normPeriod)
normalizedAO = advancedAO / nz(normFactor, 1)
Why It Works:
Standardizes AO values for comparison across assets.
Enhances signal reliability, preventing misleading spikes.
👽 How Traders Can Use This Indicator
👾 Divergence Trading Strategy
Bullish Divergence
Price makes a lower low, while AO forms a higher low.
A buy signal is confirmed when AO starts rising.
Bearish Divergence
Price makes a higher high, while AO forms a lower high.
A sell signal is confirmed when AO starts declining.
👾 Buy & Sell Signals with Trailing Stop
Bullish Setup:
✅AO crosses above the bullish trigger level → Buy Signal.
✅Trailing stop placed at Low - (ATR × Multiplier).
✅Exit if price crosses below the stop.
Bearish Setup:
✅AO crosses below the bearish trigger level → Sell Signal.
✅Trailing stop placed at High + (ATR × Multiplier).
✅Exit if price crosses above the stop.
👽 Why It’s Useful for Traders
Wavelet-Enhanced Filtering – Retains essential trend details while eliminating excessive noise.
Multi-Scale Momentum Analysis – Separates different trend frequencies for enhanced clarity.
Real-Time Divergence Alerts – Identifies early reversal signals for better entries and exits.
ATR-Based Risk Management – Ensures stops dynamically adapt to market conditions.
Works Across Markets & Timeframes – Suitable for stocks, forex, crypto, and futures trading.
👽 Indicator Settings
AO Short Period – Defines the short-term moving average for AO calculation.
AO Long Period – Defines the long-term moving average for AO smoothing.
Wavelet Smoothing – Adjusts multi-scale decomposition for different market conditions.
Divergence Detection – Enables or disables real-time divergence analysis. Normalization Period – Sets the lookback period for standard deviation-based AO normalization.
Cross Signals Sensitivity – Controls crossover signal strength for buy/sell signals.
ATR Trailing Stop Multiplier – Adjusts the sensitivity of the trailing stop.
Disclaimer: This indicator is designed for educational purposes and does not constitute financial advice. Please consult a qualified financial advisor before making investment decisions.