NightWatch 24/5 [theUltimator5]NightWatch 24/5 is a comprehensive indicator designed to seamlessly display both regular and overnight trading (BOATS exchange) into a single chart. Current TV limitations don't allow both overnight trading and regular exchanges to appear on the same chart due to timeframe visibility settings. We can either select between RTH (Regular Trading Hours) or ETH (Extended Trading Hours). There is no option to show 24 hour charts when looking at a stock. This indicator attempts to solve this issue.
Please read the entire description thoroughly because this indicator takes a little bit of setup to work properly!
---IMPORTANT-- -
This indicator MUST be used over a liquid cryptocurrency chart, like Bitcoin. It requires access to something that trades 24/7 and has volume data for all periods. Bitcoin on Coinbase is the best option. Please select Bitcoin as your main ticker before adding this indicator to the chart.
-------------------
This indicator combines the price of both the regular trading hours and the overnight trading to create a single price line and volume candles. You can select view settings to either overlay the price on the chart, or have it below the chart. Volume can be toggled on or off as well.
Default settings:
Ticker = GME
Overlay Candles on Main Chart = true
Display Data = Both Price and Volume
Show Status Table = true
Here is an explanation for each of these settings:
Ticker - Type in the ticker you want to track overnight and intraday data for
Overlay Candles on Main chart - This will push the price candles onto the main chart area instead of below it. Volume candles will remain in their own separate pane below. This is useful if you want to track both price and volume without adding the indicator twice.
Display Data - This determines what data to show. Volume, price, or both volume and price.
Show Status Table - This toggles on or off the table that shows the ticker name, current session, and the price (change) of the ticker since the most recent daily close.
If you overlay the price onto the chart, the price of the stock you are looking at will likely be a VERY different price than the crypto it is overlaying against. There are a couple workarounds. You can either zoom into the chart around the price of the stock you are looking at (time consuming), or you can go into your object tree and drag the indicator up into the main chart area. This will overlay the price onto the crypto while maintaining it's own unique y-axis.
After you move the indicator up, you can add the indicator back a second time, then change the settings to only show the volume candles. You can then toggle off the table on one of the two so you don't see duplicate tables. This is the setting I am showing in my chart above. The indicator is added twice with the price being pulled up into the same window as Bitcoin, then a second instance below showing just volume.
--LIMITATIONS--
Since the indicator requires the use of a 24 hour market ticker like Bitcoin, it DOES NOT display extended hours data. The price and volume data STOPS at 16:00 EST then resumes back up at 20:00 EST when BOATS opens. At 04:00, the price and volume then stops until 09:30, when the regular trading hours begin. This causes a flat line in the price during those periods. Unfortunately, there is no current workaround to this issue.
If Bitcoin becomes illiquid (or whatever crypto you choose), it will only populate data for the ticker you want if there is data available for that crypto at the same time period. A gap in Bitcoin volume will show a gap in trade activity for your ticker.
Overnightsession

GG - LevelsThe GG Levels indicator is a tool designed for day trading U.S. equity futures. It highlights key levels intraday, overnight, intermediate-swing levels that are relevant for intraday futures trading.
Terminology
RTH (Regular Trading Hours): Represents the New York session from 09:30 to 17:00 EST.
ON Session (Overnight Session): Represents the trading activity from 17:00 to 09:29 EST.
IB (Initial Balance): The first hour of the New York session, from 09:30 to 10:30 EST.
Open: The opening price of the RTH session.
YH (Yesterday's High): The highest price during the RTH session of the previous day.
YL (Yesterday's Low): The lowest price during the RTH session of the previous day.
YC (Yesterday's Close): The daily bar close which for futures gets updated to settlement.
IBH (Initial Balance High): The highest price during the IB session.
IBL (Initial Balance Low): The lowest price during the IB session.
ONH (Overnight High): The highest price during the ON session.
ONL (Overnight Low): The lowest price during the ON session.
VWAP (Volume-Weighted Average Price): The volume-weighted average price that resets each day.
Why is RTH Important?
Tracking the RTH session is important because often times the overnight session can be filled with "lies". It is thought that because the overnight session is lower volume price can be pushed or "manipulated" to extremes that would not happen during higher volume times.
Why is the ON Session Important Then?
Just because the ON session can be thought as a "lie" doesn't mean it is relevant to know. For example, if price is stuck inside the ON range then you can think of the market as rotational or range-bound. If price is above the ON range then it can be thought of as bullish. If price is below the ON range then it can be thought as bearish.
What is IB?
IB or initial balance is the first hour of the New York Session. Typically the market sets the tone for the day in the first hour. This tone is similarly a map like the ON session. If we are above the IBH then it is bullish and likely a trend day to the upside. If we are below the IBL then it is bearish and likely a trend day to the downside. If we are in IB then we want to avoid conducting business in the middle of IBH and IBL to avoid getting chopped up in a range bound market.
These levels are not a holy grail
You should use this indicator as guide or map for context about the instrument you are trading. You need to combine your own technical analysis with this indicator. You want as much context confirming your trade thesis in order to enter a trade. Simply buying or selling because we are above or below a level is not recommended in any circumstance. If it were that easy I would not publish this indicator.
Adjustments
In the indicator settings you can adjust the RTH, ON, and IB session-time settings. All of the times entered must be in EST (Eastern Standard Time). You may want to do this to apply the levels to a foreign market.
Examples

itradesize /\ Overnight Session & Silver BulletOvernight Session & Silver Bullet indicator
The indicator can be divided into two separate stuff:
ONS ( Overnight Session ) based on TCM’s ( TheCurrencyMerchant ) theory and Silver Bullet based on what ICT ( InnerCircleTrader ) is teaching to us.
Overnight Session
• ONS will be always based on Chicago 4am to 8am time according to TCM’s CME teaching.
The indicator has the option to show TSO ( Today’s session only ) which is good to have the chart not messed up by it. At this time when it comes to backtesting just turn this off to have the past ONS and SB ranges showed up on your chart.
• Mid line at the ONS range is useful to have as you are able to decide wether price is in a premium or a discount under the ONS.
If Im a buyer target is above the range, if Im a seller target is below the range.
• You are also able to have SD ( Standard Deviation ) lines for price projections. In the variety of TCM’s videos you are able to have a deeper knowledge.
• You can also extend Today’s ONS lines to the very end of the chart which could make an easier looking on the levels you eyeing with.
Silver Bullet
It’s based on New York time as ICT ( Inner Circle Trader ) is always teaching to us that we should use New York time, every time when it comes to his concepts.
Silver Bullets are always be there aiming of an opposing liquidity pool. They are working even on choppy days.
Silver Bullet hours:
• 03:00 - 04:00am NY Time
• 10:00 - 11:00am NY Time
• 02:00 - 03:00pm NY Time
SB highlighted areas could be shown as a box or a range according to your taste, with or without Start/End lines.
Both of them ca be used to form trades.
You should dig yourself into Silver Bullet ( InnerCircleTrader ) and Overnight Session ( TheCurrencyMerchant ) teachings before the use of the indicator.
Simple setups
• Silver Bullet
Look 20-30 minutes before any SB where the Buy or Sell program has started.
Where the first 1m FVG ( Fair Value Gap ) appears under the range, enter the trade.
Expect only a 5 handle move as a beginner.
1m chart is a must for these kind of FVG entries. ( 30s , 15s can also be used )
• ONS
Price is trading aggressively out of the range to take liquidity.
Once price grabbed liquidity that candle on the 3-5m could considered as on order block for the further movement.
If you are trading in the range, then the opposite side can be the target, if its out of the range and trading one sided, then use standard deviations as 0.5 is a minimum target.

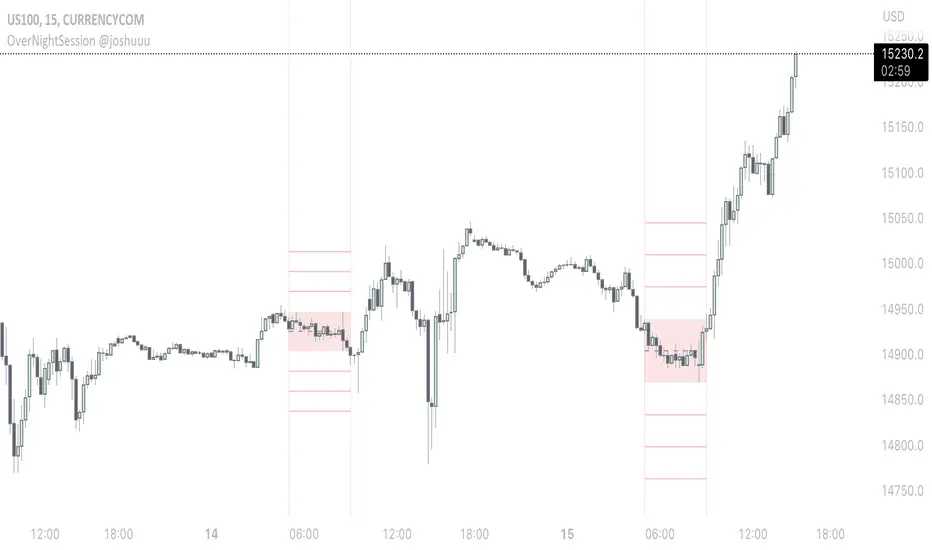
OverNightSession @joshuuuThis indicator highlights the Overnightsession (ONS), taught by TheCurrenyMerchant.
The Overnightsession is from 4-8 am UTC-5. This session can be used to form trades, e.g. after one side has been taken out.
It has the options to display Projection and the equilibrium level. Equilibrium level (50%) can be used to identify if price is currently in premium/discount of the range and the projections (standard deviations of the range) can be used to identify possible targets.
A classic setup he teaches is:
Price trades agressively out of the range taking liquidity. As soon as we trade above the high of the candle that took liquidity, that candle can be considered an orderblock, where the 50% level can be used for long setups.
⚠️ Open Source ⚠️
Coders and TV users are authorized to copy this code base, but a paid distribution is prohibited. A mention to the original author is expected, and appreciated.
⚠️ Terms and Conditions ⚠️
This financial tool is for educational purposes only and not financial advice. Users assume responsibility for decisions made based on the tool's information. Past performance doesn't guarantee future results. By using this tool, users agree to these terms.