RSI Momentum Divergence Zones [ChartPrime]⯁ OVERVIEW
RSI Momentum Divergence Zones is a hybrid oscillator and chart overlay tool that detects RSI-based momentum divergences and projects them as key zones on the chart. By combining RSI divergence logic with horizontal level plotting, this indicator reveals high-probability support and resistance areas where price has historically reacted to hidden or classic divergences.
⯁ KEY FEATURES
Momentum-Based RSI Source:
Instead of the classic RSI input, this tool uses the momentum of price as the RSI source:
rsiSrc = ta.mom(close, 10)
This emphasizes acceleration and deceleration of price moves, sharpening divergence signals and making them more responsive to early shifts in momentum.
Automatic Divergence Detection (Optional):
When enabled, the indicator continuously scans for:
— Bullish Divergence : Price makes a Lower Low while RSI forms a Higher Low
— Bearish Divergence : Price makes a Higher High while RSI forms a Lower High
It ensures divergence is valid by checking the spacing between pivots (min 5, max 50 bars).
Divergence Labels & Markers (RSI Pane + Chart):
When a valid divergence is detected:
— On RSI pane:
Labels appear at HL/LH points (“Bull” / “Bear”)
Colored lines show pivot structures
— On price chart:
Labels (“▲ Bull” / “Bear ▼”) mark price pivot that triggered the divergence
Lines highlight the exact price level at the divergence origin
Divergence Zones / Levels (Toggleable):
The indicator projects horizontal zones across the chart based on confirmed divergence points.
These levels dynamically extend as long as price respects them, and auto-expire once broken.
They act as S/R levels created by market imbalance caused by divergence reactions.
Dynamic Zone Extension Logic:
Once plotted, divergence levels will extend to the right:
— If price respects the level, the zone keeps growing
— If broken in the opposite direction, the level stops extending and turns dashed (visually showing break)
Zone Layering and Limit Control:
You can limit the number of simultaneous zones shown on the chart (e.g., 10 most recent).
Old zones automatically expire and are removed to keep the chart clean and focused.
Color Customization and Intensity:
Different colors for bullish and bearish zones let you easily distinguish trend direction.
Background fill, line width, and transparency are all adjustable.
Clean Zone Management with Arrays:
Behind the scenes, the script uses custom divLevel type arrays to manage plotted levels, ensuring they stay up-to-date, extend correctly, and delete once invalidated.
⯁ USAGE
Use bullish divergence zones as potential demand areas and bearish ones as supply zones.
Combine RSI pane labels with price-level zones to confirm strength of reversal.
Watch for price approaching a divergence level to anticipate reactions or breakouts.
Use divergence levels as trade triggers, stop-loss guides, or take-profit markers.
Limit signal count using the “Qty Divergence Zones” setting to reduce chart clutter.
Enable divergence detection only when you want to focus on key structural zones — ideal for swing or positional setups.
⯁ CONCLUSION
RSI Momentum Divergence Zones blends oscillator divergence logic with price action structure to uncover hidden strength or weakness in the market. With flexible zone plotting and clean visual signals, this tool empowers traders to identify where momentum turns into structure — turning hidden signals into tradable edges.
Indicatori e strategie

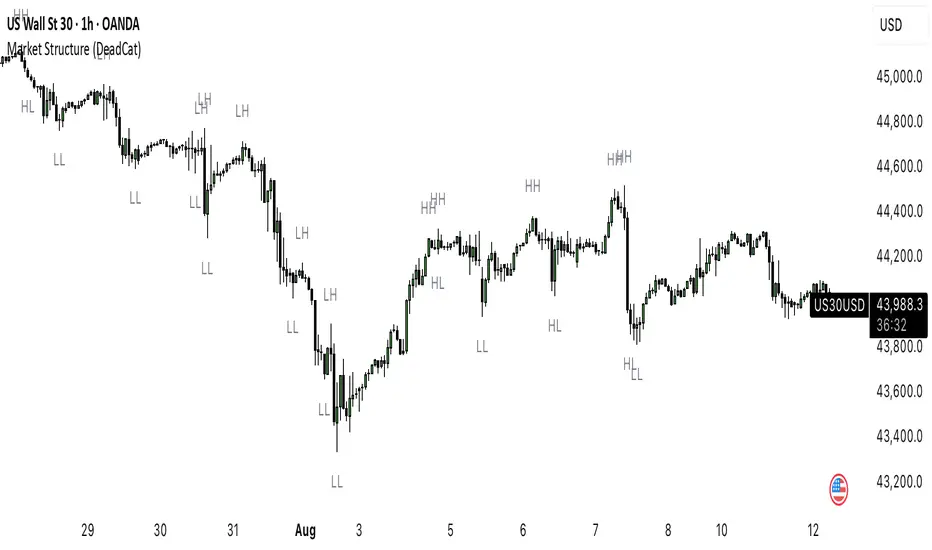
Market Structure (DeadCat)🌟 Market Structure (DeadCat) - Indicator Overview 🌟
The Market Structure (DeadCat) indicator plots swing highs and lows (HH, HL, LH, LL) using pivot points, helping you spot uptrends, downtrends, and potential reversals. Perfect for traders who use market structure.
🌟 Key Features 🌟
🔹 Swing Point Labels
HH (Higher High): Signals uptrend strength.
HL (Higher Low): Marks bullish support.
LH (Lower High): Hints at weakening uptrend or reversal.
LL (Lower Low): Confirms downtrend momentum.
🔹 Trend Detection
Uptrend: Tracks HH/HL for bullish momentum.
Downtrend: Tracks LH/LL for bearish momentum.
Waits for breaks of prior HH/HL or LH/LL to confirm new swing points, ensuring reliable signals. 🔄
🔹 Customizable Labels
Adjust label text color (default: black) to suit your chart. Supports up to 500 labels for a clean, focused view. 🖌️
🌟 Indicator Settings 🌟
Swing Length: Fixed at 20 bars (left) and 2 bars (right) for pivot detection.
Label Color: Customize text color for better visibility.
Angle Market Structure [BigBeluga]🔵 OVERVIEW
Angle Market Structure is a smart pivot-based tool that dynamically adapts to price action by accelerating breakout and breakdown detection. It draws market structure levels based on pivot highs/lows and gradually adjusts those levels closer to price using an angle threshold. Upon breakout, the indicator projects deviation zones with labeled levels (+1, +2, +3 or −1, −2, −3) to track price extension beyond structure.
🔵 CONCEPTS
Adaptive Market Structure: Uses pivots to define structure levels, which dynamically angle closer to price over time to capture breakouts sooner.
Breakout Acceleration: Pivot high levels decrease and pivot low levels increase each bar using a user-defined angle (based on ATR), improving reactivity.
Deviation Zones: Once a breakout or breakdown occurs, 3 deviation levels are projected to show how far price extends beyond the breakout point.
Count Labels: Each successful structure break is numbered sequentially, giving traders insight into momentum and trend persistence.
Visual Clarity: The script uses colored pivot points, trend lines, and extension labels for easy structural interpretation.
🔵 FEATURES
Calculates pivot highs and lows using a customizable length.
Applies an angle modifier (ATR-based) to gradually pull levels closer to price.
Plots breakout and breakdown lines in distinct colors with automatic extension.
Shows deviation zones (+1, +2, +3 or −1, −2, −3) after breakout with customizable size.
Color-coded labels for trend break count (bullish or bearish).
Dynamic label sizing and theme-aware colors.
Smart label positioning to avoid chart clutter.
Built-in limit for deviation zones to maintain clarity and performance.
🔵 HOW TO USE
Use pivot-based market structure to identify breakout and breakdown zones.
Watch for crossover (up) or crossunder (down) events as trend continuation or reversal signals.
Observe +1/+2/+3 or -1/-2/-3 levels for overextension opportunities or trailing stop ideas.
Use breakout count as a proxy for trend strength—multiple counts suggest momentum.
Combine with volume or order flow tools for higher confidence entries at breakout points.
Adjust the angle setting to fine-tune sensitivity based on market volatility.
🔵 CONCLUSION
Angle Market Structure enhances traditional pivot-based analysis by introducing breakout acceleration and structured deviation tracking. It’s a powerful tool for traders seeking a cleaner, faster read on market structure and momentum strength—especially during impulsive price moves or structural transitions.

TRI - Smart Zones============================================================================
# TRI - SMART ZONES v2.0
## Professional Smart Money Concepts Indicator for Pine Script v6
============================================================================
## 📊 OVERVIEW
**TRI - Smart Zones** is a comprehensive Smart Money Concepts indicator that
combines multiple institutional trading concepts into a single, powerful tool.
Built with Pine Script v6 for optimal performance and reliability.
## 🎯 CORE FEATURES
### **Fair Value Gaps (FVG)**
- **Detection**: Automatic identification of price imbalances
- **Types**: Bullish and Bearish Fair Value Gaps
- **Threshold**: Customizable gap size requirements (0.1% default)
- **Extension**: Configurable zone projection length
- **Mitigation**: Real-time tracking of gap fills
### **Order Blocks (OB)**
- **Detection**: Volume-based institutional footprint identification
- **Types**: Bullish and Bearish Order Blocks
- **Method**: Pivot-based volume analysis with configurable lookback
- **Validation**: Market structure confirmation required
- **Extension**: Adjustable zone projection
### **BSL/SSL Liquidity Levels**
- **Multi-Timeframe**: Automatic higher timeframe reference
- **Dynamic**: Real-time level updates and extensions
- **Visual**: Clear line markings with timeframe labels
- **Smart**: Adaptive timeframe selection based on current chart
### **Fibonacci Extensions**
- **ZigZag Integration**: Advanced pivot point detection
- **Levels**: Customizable Fibonacci ratios (38.2%, 61.8%, 100%, 161.8%)
- **Projection**: Dynamic extension from swing points
- **Visual**: Subtle dashed lines with level/price labels
### **Smart Dashboard**
- **Zone Statistics**: Real-time FVG and OB counts
- **Success Rates**: Mitigation percentages for each zone type
- **Market Bias**: Intelligent bullish/bearish/neutral assessment
- **Positioning**: Customizable location and size
### **Zone Analysis Engine**
- **Technical Confluence**: RSI, ADX, ATR, Volume analysis
- **VWAP Integration**: Institutional price reference
- **Confidence Scoring**: High/Mid/Low signal classification
- **Signal Arrows**: Visual trade direction indicators
## 🔔 ALERT SYSTEM
### **Market Structure Alerts**
- `Market Bias Changed` - Shift in overall market sentiment
- `BSL Touched` - Buy Side Liquidity level reached
- `SSL Touched` - Sell Side Liquidity level reached
### **Zone Touch Alerts**
- `OB Touched` - Any Order Block interaction
- `Bullish OB Touched` - Bullish Order Block touch
- `Bearish OB Touched` - Bearish Order Block touch
- `FVG Touched` - Any Fair Value Gap interaction
- `Bullish FVG Touched` - Bullish FVG touch
- `Bearish FVG Touched` - Bearish FVG touch
- `Zone Touched` - Any Smart Zone interaction
- `Bullish Zone Touched` - Any bullish zone touch
- `Bearish Zone Touched` - Any bearish zone touch
## ⚙️ CONFIGURATION
### **Zone Detection**
- Enable/disable FVG and OB detection independently
- Maximum zones per type (3-15, default: 8)
- Zone-specific threshold and extension settings
### **Visual Customization**
- Individual color schemes for each zone type
- Adjustable transparency levels
- Configurable line styles and widths
- Dashboard positioning and sizing options
### **Technical Analysis**
- RSI, ADX, ATR period customization
- Volume threshold multipliers
- Confidence level color coding
- Signal display toggle
## 🚀 PINE SCRIPT v6 OPTIMIZATIONS
- **User-Defined Types**: Structured data for zones and statistics
- **Methods**: Type-specific operations for better code organization
- **Enhanced Arrays**: Optimized memory management
- **Switch Statements**: Improved performance for zone classification
- **Error Handling**: Robust input validation and edge case management
- **Performance**: Efficient algorithms for real-time analysis
## 📈 TRADING APPLICATIONS
### **Entry Strategies**
- Zone confluence for high-probability setups
- Multi-timeframe confirmation via BSL/SSL
- Fibonacci extension targets
- Signal arrows for directional bias
### **Risk Management**
- Zone mitigation for stop-loss placement
- Market bias for position sizing
- Dashboard statistics for strategy validation
### **Market Analysis**
- Institutional footprint identification
- Liquidity level mapping
- Market structure assessment
- Trend continuation vs reversal analysis
## 🔧 TECHNICAL SPECIFICATIONS
- **Version**: Pine Script v6
- **Overlay**: True (draws on price chart)
- **Max Objects**: 100 boxes, 100 lines, 50 labels
- **Performance**: Optimized for real-time analysis
- **Compatibility**: All TradingView chart types and timeframes

Apex Edge – Liquidity RaiderApex Edge – Liquidity Raider
The Predator That Hunts Where Retail Never Looks
The Liquidity Raider is not your average liquidity line plotter.
This is an institutional-grade hunting system that tracks the pools of liquidity Smart Money algos stalk — and tells you exactly when price is circling in for the strike.
Where most retail tools simply mark lines, this one acts like a predator:
Scans the chart dynamically to detect clustered highs & lows (pivot-based liquidity zones).
Filters noise with sensitivity & price rounding so you only get real liquidity levels — not every random swing.
Plots live BSL (Buy-Side Liquidity) & SSL (Sell-Side Liquidity) lines in clean dotted format.
Auto-deletes levels when swept, so your chart stays clean and focused.
Triggers directional arrows when price comes within your specified % distance to the target liquidity pool — before the market moves.
EMA confluence layer lets you align with institutional flow (customizable Fast & Slow EMAs).
Core Power
Cluster Logic – Finds high-probability liquidity zones using repeated pivot levels.
Sweep Awareness – Lines vanish the moment liquidity is taken, keeping focus on the next pool.
Proximity Strike Detection – Arrow signals only when price is within striking range.
Directional Clarity – Red arrows = targeting BSL, Green arrows = targeting SSL.
Scalable Across Timeframes – Adapts to your chart’s timeframe with dynamic lookback scaling.
Institutional Flow Filter – Optional EMA confirmation keeps you aligned with the real trend.
How to Use
Identify liquidity pools – Dotted green = buy-side, dotted red = sell-side.
Watch proximity arrows – These mean price is in range and hunting that pool.
Align with EMA bias – Enter only in the direction of institutional momentum.
Target the sweep – Your take profit is where the liquidity is resting.
Why Liquidity Raider Wins
This is not a lagging signal system.
It’s a real-time, clean, predictive tool designed to mimic the targeting logic of high-frequency algos.
By removing swept levels and focusing only on the next available pools, Liquidity Raider keeps you one step ahead of the crowd — and perfectly positioned for the kill shot.

[Pandora][Swarm] Rapid Exponential Moving AverageENVISIONING POSSIBILITY
What is the theoretical pinnacle of possibility? The current state of algorithmic affairs falls far short of my aspirations for achievable feasibility. I'm lifting the lid off of Pandora's box once again, very publicly this time, as a brute force challenge to conventional 'wisdom'. The unfolding series of time mandates a transcendental systemic alteration...
THE MOVING AVERAGE ZOO:
The realm of digital signal processing for trading is filled with familiar antiquated filtering tools. Two families of filtration, being 'infinite impulse response' (EMA, RMA, etc.) and 'finite impulse response' (WMA, SMA, etc.), are prevalently employed without question. These filter types are the mules and donkeys of data analysis, broadly accepted for use in finance.
At first glance, they appear sufficient for most tasks, offering a basic straightforward way to reduce noise and highlight trends. Yet, beneath their simplistic facade lies a constellation of limitations and impediments, each having its own finicky quirks. Upon closer inspection, identifiable drawbacks render them far from ideal for many real-world applications in today's volatile markets.
KNOWN FUNDAMENTAL FLAWS:
Despite commonplace moving average (MA) popularity, these conventional filters suffer from an assortment of fundamental flaws. Most of them don't genuinely address core challenges of how to preserve the true dynamics of a signal while suppressing noise and retaining cutoff frequency compliance. Their simple cookie cutter structures make them ill-suited in actuality for dynamic market environments. In reality, they often trade one problem for another dilemma, forsaking analytics to choose between distortion and delay.
A deeper seeded issue remains within frequency compliance, how adequately a filter respects (or disrespects) the underlying signal’s spectral properties according to it's assigned periodic parameter. Traditional MAs habitually distort phase relationships, causing delayed reactions with surplus lag or exaggerations with excessive undershoot/overshoot. For applications requiring timely resilience, such as algorithmic trading, these shortcomings are often functionally unacceptable. What’s needed is vigorous filters that can more accurately retain signal behaviors while minimizing lag without sacrificing smoothness and uniformity. Until then, the public MA zoo remains as a collection of corny compromises, rather than a favorable toolbelt of solutions.
P.S.: In PSv7+, in my opinion, many of these geriatric MAs deserve no future with ease of access for the naive, simply not knowing these filters are most likely creating bigger problems than solving any.
R.E.M.A.
What is this? I prefer to think of it as the "radical EMA", definitely along my lines of a retire everything morte algorithm. This isn't your run of the mill average from the petting zoo. I would categorize it as a paradigm shifting rampant economic masochistic annihilator, sufficiently good enough to begin ruthlessly executing moving averages left and right. Um, yeah... that kind of moving average destructor as you may soon recognize with a few 'Filters+' settings adjustments, realizing ordinary EMA has been doing us an injustice all this time.
Does it possess the capability to relentlessly exterminate most averaging filters in existence? Well, it's about time we find out, by uncaging it on the loose into the greater economic wilderness. Only then can we truly find out if it is indeed a radical exponential market accelerant whose time has come. If it is, then it may eventually become a reality erasing monolithic anomaly destined for greatness, ultimately changing the entire landscape of trading in perpetuity.
UNLEASHING NEXT-GEN:
This lone next generation exoweapon algorithm is intended to initiate the transformative beginning stages of mass filtration deprecation. However, it won't be the only one, just the first arrival of it's alien kind from me. Welcome to notion #1 of my future filtration frontier, on this episode of the algorithmic twilight zone. Where reality takes a twisting turn one dimension beyond practical logic, after persistent models of mindset disintegrate into insignificance, followed by illusory perception confronted into cognitive dissonance.
An evolutionary path to genuine advancement resides outside the prison of preconceptions, manifesting only after divergence from persistent binding restrictions of dogmatic doctrines. Such a genesis in transformative thinking will catalyze unbounded cognitive potential, plowing the way for the cultivation of total redesigns of thought. Futuristic innovative breakthroughs demand the surrender of legacy and outmoded understandings.
Now that the world's largest assembly of investors has been ensembled, there are additional tasks left to perform. I'm compelled to deploy this mathematical-weapon of mass financial creation into it's rightful destined hands, to "WE THE PEOPLE" of TV.
SCRIPT INTENTION:
Deprecate anything and everything as any non-commercial member sees desirably fit. This includes your existing code formulations already in working functional modes of operation AND/OR future projects in the works. Swapping is nearly as simple as copying and pasting with meager modifications, after you have identified comparable likeness in this indicators settings with a visual assessment. Results may become eye opening, but only if you dare to look and test.
Where you may suspect a ta.filter() is lacking sufficient luster or may be flat out majorly deficient, employing rema, drema, trema, or qrema configurations may be a more suitable replacement. That's up to you to discern. My code satire already identifies likely bottom of the barrel suspects that either belong in the extinction record or have already been marked for deprecation. They are ordered more towards the bottom by rank where they belong. SuperSmoother is a masterpiece here to stay, being my original go-to reference filter. Everything you see here is already deprecated, including REMA...
REMA CHARACTERISTICS
- VERY low lag
- No overshoot
- Frequency compliant
- Proper initialization at bar_index==0
- Period parameter accepts poitive floating point numerics (AND integers!)
- Infinite impulse response (IIR) filter
- Compact code footprint
- Minimized computational overhead

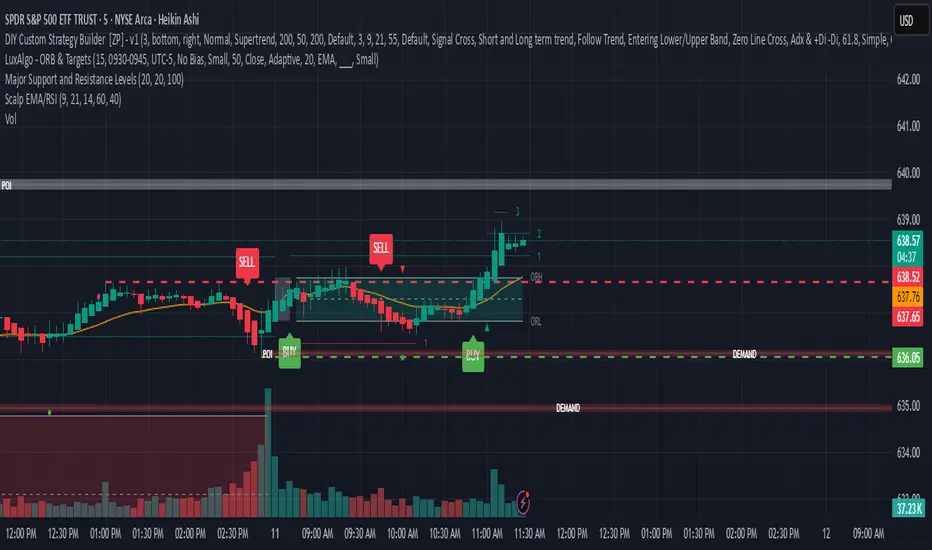
Scalping Indicator (EMA + RSI)Buy and Sell Signals. Use with Supply and Demand to find good entries. Do not rely solely on this signal. Monitors with short and long EMA cross along with oversold or overbought RSI.
Gabriel's Weibull Stdv. SuperTrend📈 Gabriel's Weibull Stdv. SuperTrend
Description:
Gabriel’s Weibull Stdv. SuperTrend is a custom trend-following indicator that blends the statistical rigor of the Weibull Moving Average with the adaptive nature of the Standard Deviation-based SuperTrend.
This hybrid system dynamically adjusts its trend bands using a Weibull-weighted average, emphasizing more recent price action while allowing the curve to flexibly adapt based on two key Weibull parameters: Shape (k) and Scale (λ). The bands themselves are shifted by a multiple of standard deviation, offering a volatility-sensitive approach to trend detection.
🔧 Key Components:
Weibull Moving Average (WMA):
A smoothing function that assigns weights to historical prices using the Weibull distribution, controlled via Shape and Scale parameters.
SuperTrend Logic with Adaptive Bands:
Standard deviation is calculated over a user-defined length and scaled with a factor to set upper and lower thresholds around the WMA.
Trend Direction Detection:
The algorithm identifies bullish or bearish states based on crossover logic relative to the dynamic bands.
Visual Enhancements:
Bright green/red lines for SuperTrend direction.
Midpoint overlay and color-coded candles for clarity.
Filled zones between price and trend for visual emphasis.
⚙️ User Inputs:
Source: Price data to analyze (default: close).
Stdv. Length: Period for calculating standard deviation.
Factor: Multiplier to widen or narrow the SuperTrend bands.
Window Length: Lookback period for the Weibull MA.
Shape (k): Controls the skewness of the Weibull distribution.
Scale (λ): Stretches or compresses the weighting curve.
Location (θ) : Shift influence of historical data forward/backward.
🔔 Alerts:
Long Entry Alert: Triggered when the trend flips bullish.
Short Entry Alert: Triggered when the trend flips bearish.
🧠 Use Cases:
Catch early reversals using custom-tailored smoothing.
Identify high-confidence trend shifts with dynamic volatility.
Combine with other confirmation indicators for enhanced entries.

Swing Point Volume Z-ScoreSWING POINT VOLUME Z-SCORE INDICATOR
A volume analysis tool that identifies statistical volume spikes at swing points with optional higher timeframe confirmation.
This indicator uses Leviathan's method of swing detection. All credit to him for his amazing work (and any mistakes mine). I was also inspired by Trading Riot, who's Capitulation indicator gave me the idea to create this one.
WHAT IT DOES
This indicator combines three analytical approaches:
- Volume Z-score calculation to measure volume significance statistically
- Automatic swing point detection (higher highs, lower lows, etc.)
- Optional higher timeframe volume confirmation
The Z-score measures how many standard deviations current volume is from the average, helping identify when volume activity is genuinely elevated rather than relying on visual assessment.
VISUAL SYSTEM
The indicator uses a color-coded approach for quick assessment:
GREEN - Normal Activity (Z-Score 1.0-2.0)
Above-average volume levels
ORANGE - Elevated Activity (Z-Score 2.0-3.0)
High volume activity that may indicate increased interest
RED - Potential Institutional Activity (Z-Score 3.0+)
Very high volume levels that could suggest significant market participation
HIGHER TIMEFRAME CONFIRMATION
When enabled, the indicator checks volume on a higher timeframe:
- Checkmark symbol indicates HTF volume also shows elevation
- X symbol indicates HTF volume doesn't confirm
- Auto-selects appropriate higher timeframe or allows manual selection
KEY FEATURES
Statistical Approach: Uses Z-score methodology rather than arbitrary volume thresholds
Adaptive Thresholds: Can adjust based on market volatility conditions
Swing Focus: Concentrates analysis on structurally important price levels
Volume Trends: Shows whether volume is accelerating or decelerating
Success Tracking: Monitors how often HTF confirmation proves effective
DISPLAY OPTIONS
Basic Mode: Essential features with clean interface
Advanced Mode: Additional customization and analytics
Label Sizing: Four size options to fit different screen setups
Table Position: Moveable info table with transparency control
Custom Colors: Adjustable for different chart themes
PRACTICAL APPLICATIONS
May help identify:
- Volume spikes at support/resistance levels
- Potential accumulation or distribution zones
- Breakout confirmation with volume backing
- Areas where larger market participants might be active
Works on all liquid markets and timeframes, though generally more effective on 15-minute charts and higher.
USAGE NOTES
This is an analytical tool that highlights statistically significant volume events. It should be used as part of a broader analysis approach rather than as a standalone trading system.
The indicator works best when combined with:
- Price action analysis
- Support and resistance identification
- Trend analysis
- Proper risk management
Default settings are designed to work well across most instruments, but users can adjust parameters based on their specific needs and trading style.
TECHNICAL DETAILS
Built with Pine Script v5
Compatible with all TradingView subscription levels
Open source code available for review and learning
Works on stocks, forex, crypto, futures, and other liquid instruments
The statistical approach helps remove some subjectivity from volume analysis, though like all technical indicators, it should be used thoughtfully as part of a complete trading plan.

Momentum_EMABand📢 Reposting Notice
I am reposting this script because my earlier submission was hidden due to description requirements under TradingView’s House Rules. This updated version fully explains the originality, the reason for combining these indicators, and how they work together. Follow me for future updates and refinements.
🆕 Momentum EMA Band, Rule-Based System
Momentum EMA Band is not just a mashup — it is a purpose-built trading tool for intraday traders and scalpers that integrates three complementary technical concepts into a single rules-based breakout & retest framework.
Originality comes from the specific sequence and interaction of these three filters:
Supertrend → Sets directional bias.
EMA Band breakout with retest logic → Times precise entries.
ADX filter → Confirms momentum strength and avoids noise.
This system is designed to filter out weak setups and false breakouts that standalone indicators often fail to avoid.
🔧 How the Indicator Works — Combined Logic
1️⃣ EMA Price Band — Dynamic Zone Visualization
Plots upper & lower EMA bands (default: 9-period EMA).
Green Band → Price above upper EMA = bullish momentum
Red Band → Price below lower EMA = bearish pressure
Yellow Band → Price within band = neutral zone
Acts as a consolidation zone and breakout trigger level.
2️⃣ Supertrend Overlay — Reliable Trend Confirmation
ATR-based Supertrend adapts to volatility:
Green Line = Uptrend bias
Red Line = Downtrend bias
Ensures trades align with the prevailing trend.
3️⃣ ADX-Based No-Trade Zone — Choppy Market Filter
Manual ADX calculation (default: length 14).
If ADX < threshold (default: 20) and price is inside EMA Band → gray background marks low-momentum zones.
🧩 Why This Mashup Works
Supertrend confirms trend direction.
EMA Band breakout & retest validates the breakout’s strength.
ADX ensures the market has enough trend momentum.
When all align, entries are higher probability and whipsaws are reduced.
📈 Example Trade Walkthrough
Scenario: 5-minute chart, ADX threshold = 20.
Supertrend turns green → trend bias is bullish.
Price consolidates inside the yellow EMA Band.
ADX rises above 20 → trend momentum confirmed.
Price closes above the green EMA Band after retesting the band as support.
Entry triggered on candle close, stop below band, target based on risk-reward.
Exit when Supertrend flips red or ADX momentum drops.
This sequence prevents premature entries, keeps trades aligned with trend, and avoids ranging markets.
🎯 Key Features
✅ Multi-layered confirmation for precision trading
✅ Built-in no-trade zone filter
✅ Fully customizable parameters
✅ Clean visuals for quick decision-making
⚠ Disclaimer: This is Version 1. Educational purposes only. Always use with risk management.


CPI ALERT JOIN TO GET HUGE PROFIT [CPI]📢 Today’s U.S. CPI Report is Out! 📢
The latest Consumer Price Index numbers have been released, and the market is ready for explosive moves! 📈 This report is one of the biggest market movers for Gold, Forex, and Crypto, and today’s volatility could create massive profit opportunities.
💡 Don’t miss out!
📌 Join our Telegram Channel NOW to get instant trade signals, real-time market analysis, and expert strategies designed to help you capture HUGE profits from this news.
🚀 The market is moving fast — secure your advantage and trade like the pros!
🔗

QUANTUM MARKET ANALYZER X7QUANTUM MARKET ANALYZER X7 — Study Material (Learning & Teaching Guide)
What this tool is (and isn’t)
QUANTUM MARKET ANALYZER X7 is a multi-factor TradingView indicator that summarizes many classic signals into one dashboard. It does not predict the future or guarantee profits. It simply scores what is happening now using oscillators, moving averages, order-block behavior, trendline/channel context, Supertrend bias, and volume/flow clues—so you can make structured, risk-aware decisions.
________________________________________
Quick start (for brand-new traders)
1. Add the indicator to a chart.
2. Pick an Analysis Timeframe (e.g., 60-min for day trading, 4-hour for swing).
3. Read the Summary tile first; then check Oscillators → MAs → OB/Trendline/Supertrend → Volume.
4. Take trades only when multiple sections agree, and always plan stop loss and size before entry.
________________________________________
How the dashboard is built (section by section)
Below you’ll learn what each section measures, how the numbers are produced, and how to interpret them. The script converts each sub-signal into a small integer (e.g., +2, +1, 0, −1, −2). These are summed into section totals and then into a Summary score.
1) Summary (the combined score)
• What it is: The grand total of all sections (Oscillators + Moving Averages + Advanced: OB, Trendline/Channel, Supertrend, Volume).
• How it’s labeled:
o Large positive total → BUY / STRONG BUY
o Around zero → NEUTRAL
o Large negative total → SELL / STRONG SELL
• How to use: Treat it as a headline, not a trigger. Confirm with the sections below and price action.
________________________________________
2) Oscillators (momentum / overbought–oversold)
Inputs used on your chosen timeframe:
• RSI(14):
o 70 → bearish pressure (−)
o <30 → bullish pressure (+)
• Stochastic (14):
o 80 overbought (−), <20 oversold (+)
• CCI(20):
o +100 (−), <−100 (+)
• Williams %R(14):
o −20 overbought (−), <−80 oversold (+)
• MACD(12,26,9):
o MACD line > Signal → (+), below → (−)
• Momentum(10): >0 → (+), <0 → (−)
• ROC(9): >+2% → (+), <−2% → (−)
• Bollinger Bands(20,2):
o Price > Upper band → (−), < Lower band → (+)
How it scores: Each item contributes between −2 and +2 (or −1/+1 for some). The Oscillator total is their sum.
How to use: Oscillators excel for timing. Favor longs when the total is clearly positive and exiting or avoiding when clearly negative.
________________________________________
3) Moving Averages (trend/structure)
MAs used: SMA(10/20/50/100/200) and EMA(10/20/50).
Scoring logic: Compares price vs each MA:
• Price > MA by >2% → +2 (strongly bullish)
• Price > MA by 0–2% → +1
• Price < MA by 0–2% → −1
• Price < MA by >2% → −2
How to use: A clearly positive MA total suggests trend alignment for longs; clearly negative favors shorts or flat. Mixed readings → treat as range/transition.
________________________________________
4) Order-Block (OB) breakout analysis (support/resistance from clustered reactions)
What it approximates: The script searches a lookback window for pivot-like candles and counts repeated “touches” near that level (within ±0.2%) to infer support (bullish OB) or resistance (bearish OB).
Settings you can tune
• OB Lookback Period: how far back to search.
• Min OB Touches: more touches = stronger level.
Signals produced
• BULLISH BRK: Price crosses above the most recent bearish OB (resistance → breakout).
• BEARISH BRK: Price crosses below the most recent bullish OB (support → breakdown).
• ABOVE SUP / BELOW RES: Price position relative to the latest OB levels.
How to use: Use OB with MAs and Volume. Best when a breakout comes with trend alignment and volume expansion.
________________________________________
5) Trendline / Channel analysis (context envelope)
Rather than a single diagonal line, this module forms a dynamic channel:
• Finds highest high and lowest low over your Trendline Lookback.
• Builds a midline = (highest + lowest)/2.
• Creates an upper/lower channel by multiplying the range with Channel Width Multiplier.
Signals produced
• UPPER BRK: Price > upper channel (bullish expansion)
• LOWER BRK: Price < lower channel (bearish expansion)
• ABOVE MID / BELOW MID: Bias zone inside channel
How to use: Treat UPPER/LOWER breaks as momentum context. Confirm with MAs and Volume before acting.
________________________________________
6) Supertrend (ATR-based bias)
• Uses ta.supertrend(ATR Multiplier, ATR Period) on your analysis timeframe.
• Signal:
o BULLISH when Supertrend flips to trend-up state
o BEARISH when it flips to trend-down
Tuning tips:
• Higher ATR Multiplier (e.g., 6) → fewer, higher-quality flips.
• Lower multiplier → more responsive, more noise.
How to use: Use Supertrend as a trend filter. Avoid fighting it unless higher-timeframe context disagrees and you have strong confluence.
________________________________________
7) Volume/Flow analysis (participation & pressure)
This section combines several volume-based tools:
1. Volume Spike vs MA
o Volume MA Period (default 20)
o Volume Spike Threshold (e.g., 1.5×)
o If current volume / MA > threshold → spike.
2. OBV vs OBV-MA → Accumulation (+) / Distribution (−)
3. VPT vs VPT-MA → Price-volume trend alignment (+/−)
4. MFI(14): >70 (−), <30 (+)
5. Accumulation/Distribution vs its MA → (+/−)
Scoring:
• Big spike with up bar → +2; with down bar → −2
• Each of OBV, VPT, MFI, A/D adds +1 or −1
Interpretation labels:
• HIGH ACC / ACCUM → constructive flow
• HIGH DIST / DISTRIB → selling pressure
• NEUTRAL → no edge
How to use: Favor setups where directional signals + trend + volume point the same way.
________________________________________
Putting it together — a repeatable reading order
1. Summary: What’s the combined bias?
2. Oscillators: Is momentum supportive or stretched?
3. MAs: Is price aligned with the trend structure?
4. OB & Trendline/Channel: Are we breaking key levels/zones?
5. Supertrend: Is the higher-level bias with you or against you?
6. Volume: Is there participation to confirm the move?
Only act when at least 3–4 sections agree and you can define a logical stop and position size.
________________________________________
Parameter tuning (step-by-step)
1. Choose timeframe:
o 15–60m for active trading; 4h–1D for swing.
2. Oscillators:
o Keep defaults first; later tighten or loosen thresholds only if you’ve tested.
3. Moving Averages:
o The script’s built-in 0–2% bands around each MA are sensible.
o If your market is very volatile, you can consider widening the 2% threshold to reduce whipsaws (requires code edit).
4. Order Blocks:
o Start with OB Lookback ~50 and Min Touches = 2.
o Increase touches for fewer, stronger zones.
5. Trendline/Channel:
o Longer Trendline Lookback and smaller Channel Width → tighter channel (more breaks).
o Shorter lookback and larger width → fewer breaks.
6. Supertrend:
o If you get too many flips, raise ATR Multiplier.
o If it’s lagging, lower it slightly.
7. Volume:
o For quieter instruments, reduce the Threshold (e.g., 1.2×).
o For very liquid/active markets, 1.5–2.0× works well.
________________________________________
Example playbooks (for practice)
A) Pro-trend long continuation
• Summary: BUY or STRONG BUY
• MAs: clearly positive
• Supertrend: BULLISH
• OB/Trendline: ABOVE MID or UPPER BRK
• Volume: ACCUM or HIGH ACC
Plan: Enter on a minor pullback; stop below recent structure; scale out at logical resistance.
B) Mean-reversion short (cautious)
• Oscillators: multiple overbought readings (RSI>70, price > BB upper)
• MAs: still positive (trend up), so this is countertrend
• Volume: no spike
Plan: If you must, take smaller size, tighter stop, faster targets. Prefer waiting for alignment instead.
C) Breakout with confirmation
• OB: BULLISH BRK of a known resistance
• Trendline/Channel: UPPER BRK
• Volume: spike with up bar
• Supertrend: recently flipped up
Plan: Enter on retest or structured continuation; define stop under breakout level.
________________________________________
Common pitfalls to avoid
• Acting on one section alone. Confluence matters.
• Chasing after long candles without volume follow-through.
• Ignoring timeframe alignment. Check the next higher timeframe.
• Oversizing trades just because “Summary = Strong Buy/Sell.”
• Moving stops farther instead of accepting a planned loss.
________________________________________
Practice & evaluation routine
1. Replay mode (TradingView Bar Replay) to practice reading the tiles in order.
2. Journal each trade: which sections agreed, where stop/target were, outcome.
3. Weekly review: Were losing trades missing confirmation? Did you respect size rules?
4. Iterate cautiously: Change one setting at a time and observe for a week.
________________________________________
Frequently asked questions
Q: Is the Summary score weighted?
A: Each sub-signal contributes small integers; totals from Oscillators, MAs, and Advanced sections are added without fancy weighting, keeping it transparent.
Q: Can I use this as a standalone system?
A: It’s best used as a decision support layer with your own risk rules, not as a mechanical “buy/sell” machine.
Q: Which timeframe is best?
A: The one that matches your holding period. Always confirm with at least one higher timeframe.
________________________________________
Suggested classroom flow (for teaching)
1. Session 1: Oscillators only → identify good vs stretched momentum.
2. Session 2: Moving Averages → trend structure and bias.
3. Session 3: OB + Trendline/Channel → location and breakouts.
4. Session 4: Supertrend + Volume → confirmation and participation.
5. Session 5: Confluence building → case studies and journaling.
6. Session 6: Risk management, sizing, and review habits.
________________________________________
Disclaimer aiTrendview (please read)
This indicator and study material are provided for educational and research purposes only. They do not constitute financial advice, investment recommendations, or a promise of performance. Trading involves substantial risk and may result in losses. Past performance of any method or indicator does not guarantee future results. You are solely responsible for your trading decisions, including risk management, position sizing, and due diligence. Always test ideas in a demo environment before using real capital, and consider consulting a licensed financial advisor.

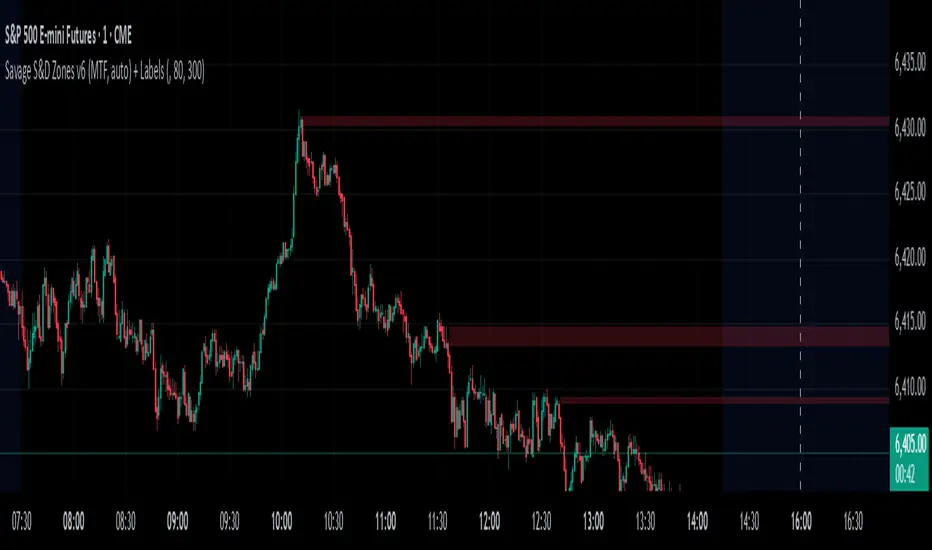
Savages Supply and Demand LevelsThis supply and demand indicator in my opinion is one of the best S&D indicators on trading view. It is clean, organized and just simple. I have spent thousands of hours determining the best and most reliable ways to identify supply and demand, on every time frame! I am going to explain exactly what I look for.
When looking for a supply level meaning, there is potential for more supply of the following stock to hit the marker, what does that mean? People are going to sell. SO, it represents possible sell ordered at that supply level. So lets get into the grit of this, there are two candles that form when a supply level is formed. The first candle needs to be green, it will have a high, a low , an open and a close. The specifics come into play with the next candle which needs to be red, that candle can NOT break the previous green candles high, and needs to close below the previous candles low. THATS IT! That is a supply level. Now, for a demand level, its the same thing just switched, we need a red candle, that will have a high,low, open and a close. Same thing now, the next candle is going to be green, that green candle can NOT break that previous red candles low and needs to close above that previous red candles high. THATS A DEMAND!
I have spent countless hours back testing and studying this, I am extremely confident that this will be a game changer for whoever uses this. I have marked different types of opening and closes and highs and lows and this specific type of setup has worked countless times for me, the only time it will not work is when there is a liquidity sweep or some sort of news where it causes the price action to swing several points. Also do not use only one time frame and only this indicator, try to use some fair value gap levels and break of structure indicators, there are really good ones on here. I have also built the indicator to get rid of supply and demand levels that have already been hit so you always have a clean and fresh supply and demand level that has not been eaten into yet. I also threw some clean labels on there so it is easy to identify. So once price action hits that supply or demand level, it goes away, it either worked or it gets invalidated.
I hope you enjoy!
Not financial advice
-Savage
Zero Lag LSMA 3-Color# Zero Lag LSMA 3-Color Indicator
## Overview
The Zero Lag LSMA (ZLSMA) 3-Color is an advanced trend-following indicator that reduces the lag inherent in traditional Linear Regression Moving Averages (LSMA). This indicator provides clear visual signals through a color-coded system and dot markers to identify trend changes with minimal delay.
## What is Zero Lag LSMA?
Zero Lag LSMA is calculated by applying the Linear Regression Moving Average twice and then compensating for the lag:
1. **First LSMA**: Calculate LSMA of the price data
2. **Second LSMA**: Calculate LSMA of the first LSMA
3. **Zero Lag Calculation**: ZLSMA = LSMA + (LSMA - LSMA2)
This method significantly reduces the delay while maintaining the smoothness of the trend line.
## Features
### Color-Coded Trend System
- **Fluorescent Green** (`RGB(0, 255, 0)`): Uptrend - ZLSMA is rising
- **Fluorescent Red** (`RGB(255, 20, 60)`): Downtrend - ZLSMA is falling
- **Gray**: Sideways/Neutral - No clear directional bias
### Trend Change Markers
- **Tiny dots** appear at the exact moment when the trend direction changes
- **Green dots**: Mark the beginning of an uptrend
- **Red dots**: Mark the beginning of a downtrend
### Customizable Parameters
- **Length**: Period for ZLSMA calculation (default: 20)
- **Line Width**: Thickness of the ZLSMA line (default: 2)
- **Show/Hide Toggle**: Option to display or hide the indicator
## Trading Applications
### Trend Identification
- **Green line**: Look for long opportunities
- **Red line**: Look for short opportunities
- **Gray line**: Consider range-bound strategies
### Entry Signals
- **Dot markers** provide precise entry points when trend changes occur
- Green dots can signal potential buy entries
- Red dots can signal potential sell entries
### Trend Confirmation
- Use ZLSMA color changes to confirm other technical analysis signals
- The reduced lag helps traders enter trends earlier than traditional moving averages
## Advantages Over Traditional Moving Averages
1. **Reduced Lag**: Responds faster to price changes than standard moving averages
2. **Clear Visualization**: Color-coding makes trend direction immediately apparent
3. **Precise Timing**: Dot markers highlight exact trend change moments
4. **Smooth Operation**: Maintains smoothness while reducing whipsaws
## Best Practices
### Timeframe Usage
- Works effectively on all timeframes
- Higher timeframes provide more reliable signals
- Lower timeframes offer more trading opportunities but may have more noise
### Risk Management
- Always use proper stop-loss levels
- Consider the overall market context
- Combine with other technical analysis tools for confirmation
### Settings Optimization
- **Shorter periods** (10-15): More sensitive, faster signals
- **Longer periods** (25-50): More stable, fewer false signals
- **Standard period** (20): Good balance between sensitivity and stability
## Alert Conditions
The indicator includes built-in alert conditions for:
- ZLSMA turning upward (trend change to bullish)
- ZLSMA turning downward (trend change to bearish)
## Compatibility
- **Platform**: TradingView
- **Script Version**: Pine Script v6
- **Chart Type**: Works on all chart types
- **Markets**: Suitable for Forex, Stocks, Crypto, Commodities, and Indices
## Disclaimer
This indicator is for educational and informational purposes only. It should not be considered as financial advice. Always conduct your own research and consider your risk tolerance before making trading decisions. Past performance does not guarantee future results.
All-Time High/Low Levels with Dynamic Price Zones📈 All-Time High/Low Levels with Dynamic Price Zones — AlertBlake
🧠 Overview:
This powerful indicator automatically identifies and draws the All-Time High (AT.H) and All-Time Low (AT.L) on your chart, providing a clear visual framework for price action analysis. It also calculates and displays the Midpoint (50%), Upper Quartile (75%), and Lower Quartile (25%) levels, creating a dynamic grid that helps traders pinpoint key psychological levels, support/resistance zones, and potential breakout or reversal areas.
✨ Features:
Auto-Detection of All-Time High and Low:
Tracks the highest and lowest prices in the full visible historical range of the chart.
Automatically updates as new highs or lows are created.
Dynamic Level Calculation:
Midpoint (50%): Halfway between AT.H and AT.L.
25% Level: 25% between AT.L and AT.H.
75% Level: 75% between AT.L and AT.H.
Each level is clearly labeled with its corresponding value.
Labels are positioned to the right of the price for easy reading.
Color-Coded Lines (customizable)

SMT Oscillator: Smarter Money Divergence Detector [PhenLabs]📊Phenlabs - SMT Oscillator: Smarter Money Divergence Detector
Version: PineScript™v6
📌Description
The SMT Oscillator is a sophisticated tool designed to identify smart money divergence between two correlated assets. By analyzing the momentum and volume-weighted price action of a primary and secondary symbol, traders can spot subtle shifts in market dynamics that often precede significant price movements. This indicator is built to provide a clearer, more filtered view of inter-market relationships, solving the common problem of false signals and market noise. Its primary purpose is to equip traders with a quantifiable edge in detecting potential reversals or continuations that are not obvious on a standard price chart.
🚀Points of Innovation
Dual-Symbol Divergence Core: Directly compares momentum (RSI or MACD) between two user-selected symbols to pinpoint true SMT divergence.
Volume-Weighted Analysis: Integrates volume delta into the divergence calculation, giving more weight to moves backed by significant market participation.
Entropy Filter for Noise Reduction: Employs an entropy calculation to filter out low-quality signals during choppy or consolidating market conditions.
Predictive Forecast Line: Utilizes a linear regression model to project the oscillator’s future trajectory, offering a forward-looking glimpse of potential momentum shifts.
Customizable Signal Sensitivity: Allows fine-tuning of overbought and oversold levels to adapt to different market volatilities and trading styles.
Integrated Signal Alerts: Provides built-in alerts for bullish/bearish zero crosses and overbought/oversold conditions.
🔧Core Components
Momentum Engine: The user can select either RSI or MACD as the underlying engine for the divergence calculation, allowing for flexibility in analysis.
Normalization Function: Price data from both symbols is normalized using percentage change to ensure a true “apples-to-apples” comparison, regardless of their nominal price differences.
Divergence Calculator: The core algorithm that subtracts the secondary symbol’s momentum from the primary’s and normalizes the result using the combined standard deviation.
Smoothing Mechanism: An Exponential Moving Average (EMA) is applied to the raw oscillator output to reduce choppiness and provide a clearer signal line.
🔥Key Features
Multi-Asset Comparison: Go beyond single-asset analysis by comparing correlated pairs like ES/NQ or BTC/ETH to uncover hidden trading opportunities.
Heatmap Visualization: An optional heatmap mode provides an intuitive visual representation of divergence strength, making it easier to gauge market sentiment at a glance.
Configurable Lookback and Timeframe: Adjust the lookback period and analysis timeframe to suit your specific strategy, from short-term scalping to long-term trend analysis.
Signal Markers: Visual markers are plotted directly on the chart for bullish and bearish zero-line crossovers, providing clear entry and exit signals.
🎨Visualization
SMT Oscillator Line: The primary visual element, colored blue for bullish (positive) divergence and orange for bearish (negative) divergence.
Zero Line: A solid horizontal line at the zero level, indicating the equilibrium point between the two assets. Crossovers of this line signal a shift in relative strength.
Overbought/Oversold Zones: Dotted lines at the +80 and -80 levels (customizable) that highlight extreme divergence readings, often indicating potential exhaustion points.
Forecast Line: A predictive line that plots the anticipated path of the oscillator, giving traders an advanced warning of potential changes in momentum.
📖Usage Guidelines
Setting Categories
Primary Symbol
Default: (Chart Symbol)
Description: The main asset you are analyzing. Leave blank to use the symbol currently on your chart.
Secondary Symbol
Default: CME_MINI:ES1! (used with NASDAQ futures due to inherent heavy correlation
Description: The asset to compare against the primary symbol.
Lookback Period
Default: 14
Range: 8-100
Description: Controls the calculation window for momentum (RSI/MACD). Higher values result in a smoother, less sensitive oscillator.
Divergence Type
Default: RSI
Options: RSI, MACD
Description: Choose the momentum indicator to use for the divergence calculation.
Enable Volume Weighting
Default: true
Description: When enabled, gives more weight to divergence signals that are accompanied by significant volume.
✅Best Use Cases
Identifying high-probability reversal points by spotting divergence in overbought or oversold territory.
Confirming the strength of a trend by observing sustained positive or negative divergence.
Pairs trading by taking a long position on the outperforming asset and a short position on the underperforming one during a divergence.
Risk management by recognizing when a current trend is losing its underlying momentum.
⚠️Limitations
Requires Correlated Assets: The indicator’s effectiveness is highly dependent on the selection of two assets with a known correlation (e.g., ES and NQ).
Not a Standalone System: Divergence signals should be used in conjunction with other forms of analysis (price action, market structure) and not as a complete trading system.
Lagging by Nature: As it is based on moving averages and past price data, the oscillator is inherently lagging and may not capture all rapid price changes.
💡What Makes This Unique
Combined Momentum & Volume: Unlike standard oscillators, it fuses momentum with volume delta for a more robust “Smart Money” perspective.
Noise-Filtering Mechanism: The proprietary entropy filter is a unique feature designed to weed out insignificant market chatter and focus on high-conviction signals.
🔬How It Works
Data Normalization:
The script first normalizes the price data of the two selected symbols into percentage changes. This ensures that the comparison is fair, regardless of the difference in their price scales.
Momentum Calculation:
It then calculates the chosen momentum value (either RSI or MACD histogram) for each of the normalized price series.
Divergence Computation:
The core of the indicator lies in subtracting the momentum of the secondary symbol from the primary one. This raw divergence is then optionally weighted by volume and filtered for market noise (entropy) to produce the final oscillator value.
💡Note:
For best results, use this indicator on adequate timeframes to filter out market noise. Always confirm signals with price action analysis before entering a trade.

#TheStrat Multi-Timeframe In-Force Signals, Failed 2's, and FTFCThis indicator combines #TheStrat concepts of bar combinations, in-force signals, and timeframe continuity with 'Failed 2's' which can be early indication of a trend reversal.
It’s designed to help identify the prevailing trend but also reversal points when timeframe-based ranges are reclaimed because a signal failed or went out-of-force.
Core Concepts
1. TheStrat Bar Types
• 1 (Inside Bar): High ≤ previous high and Low ≥ previous low.
• 2U (Two Up): High > previous high and Low ≥ previous low.
• 2D (Two Down): Low < previous low and High ≤ previous high.
• 3 (Outside Bar): High > previous high and Low < previous low.
2. Failed 2’s — Definition & Detection
A Failed 2 occurs when a directional break (2U or 2D) reverses before following through.
This script lets you choose from four failure-definition modes:
1. Open — A 2U fails if last price is below open; a 2D fails if last price is above open.
2. Reclaim — A 2U or 2D fails if last price is within the previous bar’s range.
3. Both — Both of the above conditions must be met.
4. Either — Either condition must be met.
Failed 2U setups are bearish; Failed 2D setups are bullish.
You can also enable FTFC Override, which ignores reclaim-type failures when all higher timeframes are in full agreement with the current trend.
3. Timeframe Continuity (TFC)
TFC measures directional agreement across multiple timeframes.
• Full TFC (FTFC) Up: All selected timeframes above their opens.
• Full TFC (FTFC) Down: All selected timeframes below their opens.
• Mixed or neutral conditions are also displayed.
The indicator tracks classic TFC and supports trend-flip alerts when full agreement changes direction.
Features
• Customizable TFC table showing bar types, failed status, in-force status, reclaims, and direction arrows.
• Automatic bar coloring for TFC alignment, failed-2 transitions, or neutral states.
• Alerts for TFC trend flips.
• Multi-timeframe scanning with selectable intervals.
• Option to highlight bars that trigger a TFC flip due to failed-2 events.
Use Cases
• Quickly gauge market bias across multiple timeframes
• Identify failed 2 reversals against higher timeframes
• Spot potential turning points when trend flips occur
Limitations
This is a tool which can give earlier indication of trend reversals but is highly dependent on selected timeframes. This is discretionary, but having a range of higher and lower timeframes works best. In many cases, it will give the same trend 'flip' that classic FTFC would (based on open).
Ranges are based on timeframes, not swing highs and lows. The selected timeframes must capture the swing high or low to show a 'range' reclaim.
Timeframes lower than the display timeframe cannot be accurately shown due to PineScript limitations. They are 'greyed out' and not included in calculations or displays.
This script is based on the FTFC indicator by TradeForOpportunity with deep gratitude. It has been modified and expanded with permission under MPL 2.0.

Supertrend EMA Vol Strategy V5### Supertrend EMA Strategy V5
**Overview**
This is a trend-following strategy designed for cryptocurrency markets like BTC/USD on daily timeframes, combining the Supertrend indicator for dynamic trailing stops with an EMA filter for trend confirmation. It aims to capture strong uptrends while avoiding counter-trend trades, with optional volume filtering for high-conviction entries and ATR-based stop-loss to manage risk. Ideal for long-only setups in bullish assets, it visually highlights trends with green/red bands and fills for easy interpretation. Backtested on BTC from 2024-2025, it shows potential for outperforming buy-and-hold in trending markets, but always use with proper risk management—past performance isn't indicative of future results.
**Key Features**
- **Supertrend Core**: Uses ATR to plot adaptive uptrend (green) and downtrend (red) lines, flipping on closes beyond prior bands for buy/sell signals.
- **EMA Trend Filter**: Entries require price above the EMA (default 21-period) for longs, ensuring alignment with the broader trend.
- **Volume Confirmation**: Optional filter only allows entries when volume exceeds its EMA (default 20-period), reducing false signals in low-activity periods.
- **Risk Controls**: Built-in ATR-multiplier stop-loss (default 2x) to cap losses; exits on Supertrend flips for trailing profits.
- **Visuals**: Green/red lines and highlighter fills for up/down trends, plus buy/sell labels and circles for signals.
- **Customizable Inputs**: Tweak ATR period (default 10), multiplier (default 3), EMA length, start date, long/short toggles, SL, and volume filter.
- **Alerts**: Built-in for buy/sell and direction changes.
**How to Use**
1. Add to your TradingView chart (e.g., BTC/USD 1D).
2. Adjust inputs: Start with defaults for trend-following; increase multiplier for fewer trades/higher win rate. Enable volume filter for volatile assets.
3. Monitor signals: Green "Buy" for long entries (if close > EMA and conditions met); red "Sell" for exits.
4. Backtest in Strategy Tester: Focus on equity curve, win rate (~50-60% in tests), and drawdown (<15% with SL).
5. Live Trading: Use small position sizes (1-2% risk per trade); combine with your analysis. Shorts disabled by default for bull-biased markets.

My script⯁ OVERVIEW
RSI Momentum Divergence Zones \ is a hybrid oscillator & chart overlay that detects RSI-based momentum divergences and projects them as key zones on your chart. By combining RSI divergence logic with horizontal level plotting, it reveals high-probability support and resistance areas where price has historically reacted to hidden or classic divergences.
⯁ KEY FEATURES
Momentum-Based RSI Source:
Automatic Divergence Detection (Optional):
Scans continuously for:
Bullish Divergence: Price ↓ makes Lower Low, RSI ↑ makes Higher Low
Bearish Divergence: Price ↑ makes Higher High, RSI ↓ makes Lower High
Validates divergences by ensuring pivot spacing is between 5–50 bars ⏱.
Divergence Labels & Markers (RSI Pane + Price Chart):
On the RSI pane: labels at HL/LH points (“Bull” / “Bear”), plus colored lines showing pivot structure
On the price chart: “▲ Bull” / “Bear ▼” mark the price pivot triggering divergence, with lines highlighting the divergence level.
Divergence Zones / Levels (Toggleable):
Projects horizontal zones based on confirmed divergence points—these act as dynamic S/R zones.
Zones extend rightward if respected; turn dashed and expire when price breaks them.
Zone Layering & Limit Control:
Option to limit number of zones shown (e.g., last 10), with older zones auto-expiring to declutter.
Color Customization & Intensity:
Choose different colors for bullish and bearish zones. Adjust background fill, line width, transparency for clarity.
Clean Zone Management (Arrays):
Utilizes custom `divLevel` arrays in the script for smooth plotting, extending, and removal of levels.
⯁ USAGE
Use bullish divergence zones as demand zones, bearish ones as supply zones.
Combine RSI pane labels with price-level zones to confirm reversal strength.
Monitor price approaching divergence zones to anticipate reactions or breakouts.
Use zones for trade triggers, stop-loss placement, or take-profit targets.
Reduce clutter using “Qty Divergence Zones” to limit signals.
Enable divergence detection when focusing on key structural zones—great for swing/positional setups.
⯁ CONCLUSION
RSI Momentum Divergence Zones \ blends oscillator divergence logic with price-action structure, uncovering hidden strength or weakness in the market. With flexible zone plotting and clean visual signals, this tool empowers traders to identify where momentum turns into structure—turning hidden signals into tradable edges.
With Emojis Added:
Overview: hybrid indicator that finds key zones where RSI and price diverge
Features: fresh visuals with labels, zones, automatic detection, and customization 🆙
Usage: trade smarter using demand/supply zones, triggers, and visual clarity 🎯
Conclusion: merge momentum and structure to spot hidden edges in the market ✨

Nifty Smart Zones & Breakout Bars(5min TF only) by Chaitu50cNifty Smart Zones & Breakout Bars is a purpose-built intraday trading tool, tested extensively on Nifty50 and recommended for Nifty50 use only.
All default settings are optimised specifically for Nifty50 on the 5-minute timeframe for maximum accuracy and clarity.
Why Last Bar of the Session Matters
The last candle of a trading session often represents the final battle between buyers and sellers for that day.
It encapsulates closing sentiment, influenced by end-of-day positioning, profit booking, and institutional activity.
The high and low of this bar frequently act as strong intraday support/resistance in the following sessions.
Price often reacts around these levels, especially when combined with volume surges.
Core Features
Session Last-Candle Zones
Plots a horizontal box at the high and low of the last candle in each session.
Boxes extend to the right to track carry-over levels into new sessions.
Uses a stateless approach — past zones reappear if relevant.
Smart Suppression System
When more than your Base Sessions (No Suppression) are shown, newer zones overlapping or within a proximity distance (in points) of older zones are hidden.
Older zones take priority, reducing chart clutter while keeping critical levels.
Breakout Bar Coloring
Highlights breakout bars in four categories:
Up Break (1-bar)
Down Break (1-bar)
Up Break (2-bar)
Down Break (2-bar)
Breakouts use a break buffer (in ticks) to filter noise.
Toggle coloring on/off instantly.
Volume Context (User Tip)
For best use, pair with volume analysis.
High-volume breakouts from last-session zones have greater conviction and can signal sustained momentum.
Usage Recommendations
Instrument: Nifty50 only (tested & optimised).
Timeframe: 5-minute chart for best results.
Approach:
Watch for price interaction with the plotted last-session zones.
Combine zone breaks with bar color signals and volume spikes for higher-probability trades.
Use suppression to focus on key, non-redundant levels.
Why This Tool is Different
Unlike standard support/resistance plotting, this indicator focuses on session-closing levels, which are more reliable than arbitrary highs/lows because they capture the final market consensus for the session.
The proximity-based suppression ensures your chart stays clean, while breakout paints give instant visual cues for momentum shifts.

Dip Hunter [BackQuant]Dip Hunter
What this tool does in plain language
Dip Hunter is a pullback detector designed to find high quality buy-the-dip opportunities inside healthy trends and to avoid random knife catches. It watches for a quick drop from a recent high, checks that the drop happened with meaningful participation and volatility, verifies short-term weakness inside a larger uptrend, then scores the setup and paints the chart so you can act with confidence. It also draws clean entry lines, provides a meter that shows dip strength at a glance, and ships with alerts that match common execution workflows.
How Dip Hunter thinks
It defines a recent swing reference, measures how far price has dipped off that high, and only looks at candidates that meet your minimum percentage drop.
It confirms the dip with real activity by requiring a volume spike and a volatility spike.
It checks structure with two EMAs. Price should be weak in the short term while the larger context remains constructive.
It optionally requires a higher-timeframe trend to be up so you focus on pullbacks in trending markets.
It bundles those checks into a score and shows you the score on the candles and on a gradient meter.
When everything lines up it paints a green triangle below the bar, shades the background, and (if you wish) draws a horizontal entry line at your chosen level.
Inputs and what they mean
Dip Hunter Settings
• Vol Lookback and Vol Spike : The script computes an average volume over the lookback window and flags a spike when current volume is a multiple of that average. A multiplier of 2.0 means today’s volume must be at least double the average. This helps filter noise and focuses on dips that other traders actually traded.
• Fast EMA and Slow EMA : Short-term and medium-term structure references. A dip is more credible if price closes below the fast EMA while the fast EMA is still below the slow EMA during the pullback. That is classic corrective behavior inside a larger trend.
• Price Smooth : Optional smoothing length for price-derived series. Use this if you trade very noisy assets or low timeframes.
• Volatility Len and Vol Spike (volatility) : The script checks both standard deviation and true range against their own averages. If either expands beyond your multiplier the market confirms the move with range.
• Dip % and Lookback Bars : The engine finds the highest high over the lookback window, then computes the percentage drawdown from that high to the current close. Only dips larger than your threshold qualify.
Trend Filter
• Enable Trend Filter : When on, Dip Hunter will only trigger if the market is in an uptrend.
• Trend EMA Period : The longer EMA that defines the session’s backbone trend.
• Minimum Trend Strength : A small positive slope requirement. In practice this means the trend EMA should be rising, and price should be above it. You can raise the value to be more selective.
Entries
• Show Entry Lines : Draws a horizontal guide from the signal bar for a fixed number of bars. Great for limit orders, scaling, or re-tests.
• Line Length (bars) : How far the entry guide extends.
• Min Gap (bars) : Suppresses new entry lines if another dip fired recently. Prevents clutter during choppy sequences.
• Entry Price : Choose the line level. “Low” anchors at the signal candle’s low. “Close” anchors at the signal close. “Dip % Level” anchors at the theoretical level defined by recent_high × (1 − dip%). This lets you work resting orders at a consistent discount.
Heat / Meter
• Color Bars by Score : Colors each candle using a red→white→green gradient. Red is overheated, green is prime dip territory, white is neutral.
• Show Meter Table : Adds a compact gradient strip with a pointer that tracks the current score.
• Meter Cells and Meter Position : Resolution and placement of the meter.
UI Settings
• Show Dip Signals : Plots green triangles under qualifying bars and tints the background very lightly.
• Show EMAs : Plots fast, slow, and the trend EMA (if the trend filter is enabled).
• Bullish, Bearish, Neutral colors : Theme controls for shapes, fills, and bar painting.
Core calculations explained simply
Recent high and dip percent
The script finds the highest high over Lookback Bars , calls it “recent high,” then calculates:
dip% = (recent_high − close) ÷ recent_high × 100.
If dip% is larger than Dip % , condition one passes.
Volume confirmation
It computes a simple moving average of volume over Vol Lookback . If current volume ÷ average volume > Vol Spike , we have a participation spike. It also checks 5-bar ROC of volume. If ROC > 50 the spike is forceful. This gets an extra score point.
Volatility confirmation
Two independent checks:
• Standard deviation of closes vs its own average.
• True range vs ATR.
If either expands beyond Vol Spike (volatility) the move has range. This prevents false triggers from quiet drifts.
Short-term structure
Price should close below the Fast EMA and the fast EMA should be below the Slow EMA at the moment of the dip. That is the anatomy of a pullback rather than a full breakdown.
Macro trend context (optional)
When Enable Trend Filter is on, the Trend EMA must be rising and price must be above it. The logic prefers “micro weakness inside macro strength” which is the highest probability pattern for buying dips.
Signal formation
A valid dip requires:
• dip% > threshold
• volume spike true
• volatility spike true
• close below fast EMA
• fast EMA below slow EMA
If the trend filter is enabled, a rising trend EMA with price above it is also required. When all true, the triangle prints, the background tints, and optional entry lines are drawn.
Scoring and visuals
Binary checks into a continuous score
Each component contributes to a score between 0 and 1. The script then rescales to a centered range (−50 to +50).
• Low or negative scores imply “overheated” conditions and are shaded toward red.
• High positive scores imply “ripe for a dip buy” conditions and are shaded toward green.
• The gradient meter repeats the same logic, with a pointer so you can read the state quickly.
Bar coloring
If you enable “Color Bars by Score,” each candle inherits the gradient. This makes sequences obvious. Red clusters warn you not to buy. White means neutral. Increasing green suggests the pullback is maturing.
EMAs and the trend EMA
• Fast EMA turns down relative to the slow EMA inside the pullback.
• Trend EMA stays rising and above price once the dip exhausts, which is your cue to focus on long setups rather than bottom fishing in downtrends.
Entry lines
When a fresh signal fires and no other signal happened within Min Gap (bars) , the indicator draws a horizontal level for Line Length bars. Use these lines for limit entries at the low, at the close, or at the defined dip-percent level. This keeps your plan consistent across instruments.
Alerts and what they mean
• Market Overheated : Score is deeply negative. Do not chase. Wait for green.
• Close To A Dip : Score has reached a healthy level but the full signal did not trigger yet. Prepare orders.
• Dip Confirmed : First bar of a fresh validated dip. This is the most direct entry alert.
• Dip Active : The dip condition remains valid. You can scale in on re-tests.
• Dip Fading : Score crosses below 0.5 from above. Momentum of the setup is fading. Tighten stops or take partials.
• Trend Blocked Signal : All dip conditions passed but the trend filter is offside. Either reduce risk or skip, depending on your plan.
How to trade with Dip Hunter
Classic pullback in uptrend
Turn on the trend filter.
Watch for a Dip Confirmed alert with green triangle.
Use the entry line at “Dip % Level” to stage a limit order. This keeps your entries consistent across assets and timeframes.
Initial stop under the signal bar’s low or under the next lower EMA band.
First target at prior swing high, second target at a multiple of risk.
If you use partials, trail the remainder under the fast EMA once price reclaims it.
Aggressive intraday scalps
Lower Dip % and Lookback Bars so you catch shallow flags.
Keep Vol Spike meaningful so you only trade when participation appears.
Take quick partials when price reclaims the fast EMA, then exit on Dip Fading if momentum stalls.
Counter-trend probes
Disable the trend filter if you intentionally hunt reflex bounces in downtrends.
Require strong volume and volatility confirmation.
Use smaller size and faster targets. The meter should move quickly from red toward white and then green. If it does not, step aside.
Risk management templates
Stops
• Conservative: below the entry line minus a small buffer or below the signal bar’s low.
• Structural: below the slow EMA if you aim for swing continuation.
• Time stop: if price does not reclaim the fast EMA within N bars, exit.
Position sizing
Use the distance between the entry line and your structural stop to size consistently. The script’s entry lines make this distance obvious.
Scaling
• Scale at the entry line first touch.
• Add only if the meter stays green and price reclaims the fast EMA.
• Stop adding on a Dip Fading alert.
Tuning guide by market and timeframe
Equities daily
• Dip %: 1.5 to 3.0
• Lookback Bars: 5 to 10
• Vol Spike: 1.5 to 2.5
• Volatility Len: 14 to 20
• Trend EMA: 100 or 200
• Keep trend filter on for a cleaner list.
Futures and FX intraday
• Dip %: 0.4 to 1.2
• Lookback Bars: 3 to 7
• Vol Spike: 1.8 to 3.0
• Volatility Len: 10 to 14
• Use Min Gap to avoid clusters during news.
Crypto
• Dip %: 3.0 to 6.0 for majors on higher timeframes, lower on 15m to 1h
• Lookback Bars: 5 to 12
• Vol Spike: 1.8 to 3.0
• ATR and stdev checks help in erratic sessions.
Reading the chart at a glance
• Green triangle below the bar: a validated dip.
• Light green background: the current bar meets the full condition.
• Bar gradient: red is overheated, white is neutral, green is dip-friendly.
• EMAs: fast below slow during the pullback, then reclaim fast EMA on the bounce for quality continuation.
• Trend EMA: a rising spine when the filter is on.
• Entry line: a fixed level to anchor orders and risk.
• Meter pointer: right side toward “Dip” means conditions are maturing.
Why this combination reduces false positives
Any single criterion will trigger too often. Dip Hunter demands a dip off a recent high plus a volume surge plus a volatility expansion plus corrective EMA structure. Optional trend alignment pushes odds further in your favor. The score and meter visualize how many of these boxes you are actually ticking, which is more reliable than a binary dot.
Limitations and practical tips
• Thin or illiquid symbols can spoof volume spikes. Use larger Vol Lookback or raise Vol Spike .
• Sideways markets will show frequent small dips. Increase Dip % or keep the trend filter on.
• News candles can blow through entry lines. Widen stops or skip around known events.
• If you see many back-to-back triangles, raise Min Gap to keep only the best setups.
Quick setup recipes
• Clean swing trader: Trend filter on, Dip % 2.0 to 3.0, Vol Spike 2.0, Volatility Len 14, Fast 20 EMA, Slow 50 EMA, Trend 100 EMA.
• Fast intraday scalper: Trend filter off, Dip % 0.7 to 1.0, Vol Spike 2.5, Volatility Len 10, Fast 9 EMA, Slow 21 EMA, Min Gap 10 bars.
• Crypto swing: Trend filter on, Dip % 4.0, Vol Spike 2.0, Volatility Len 14, Fast 20 EMA, Slow 50 EMA, Trend 200 EMA.
Summary
Dip Hunter is a focused pullback engine. It quantifies a real dip off a recent high, validates it with volume and volatility expansion, enforces corrective structure with EMAs, and optionally restricts signals to an uptrend. The score, bar gradient, and meter make reading conditions instant. Entry lines and alerts turn that read into an executable plan. Tune the thresholds to your market and timeframe, then let the tool keep you patient in red, selective in white, and decisive in green.

rsi 8 beta 2🔔 How to Use for Entry
BUY Entry when:
Yellow BUY arrow appears
GOLD bar > USD bar
Delta (strength difference) is positive
SELL Entry when:
Blue SELL arrow appears
USD bar > GOLD bar
Delta is negative
Exit either on the opposite arrow or when strength starts weakening.
