Indicatori e strategie

JK Scalp - Nishith RajwarJK Scalp Nishith Rajwar
Multi-Stochastic Rotation & Momentum Scalping Framework
JK Scalp is a rule-based momentum and rotation oscillator designed for short-term scalping and intraday execution.
It focuses on how momentum rotates across multiple stochastic speeds, instead of relying on a single oscillator or lagging averages.
This is an execution aid, not a predictive indicator.
🧠 Concept & Originality
Unlike standard stochastic tools, JK Scalp uses four synchronized stochastic layers:
• Fast (9,3) → execution timing
• Medium (14,3) → structure confirmation
• Slow (44,3) → swing context
• Trend (60,10,10) → dominant momentum regime
The core idea is quad-rotation:
High-probability trades occur when all momentum layers rotate together after reaching an extreme.
This script combines:
• Momentum rotation
• Divergence logic
• Flag continuation logic
• Trend-state filtering
into a single cohesive framework, not a simple indicator mashup.
📊 How to Use (Step-by-Step)
1️⃣ Best Timeframes
• Scalping: 1m – 3m
• Intraday: 5m – 15m
• Avoid higher timeframes (not designed for swing holding)
Works best on:
• Index options
• Index futures
• Highly liquid stocks
• Crypto majors
2️⃣ Understanding the Signals
🔁 Quad Rotation (Core Signal)
A valid rotation requires:
• Fast, Medium, Slow, and Trend stochastic moving in the same direction
• Momentum exiting Overbought / Oversold zones
• Trend stochastic supporting the move
This filters out random oscillator noise.
3️⃣ Entry Conditions
🟢 LONG Setup
• Bullish quad rotation
• Either:
– Bullish divergence OR
– Bullish flag pullback
• Fast stochastic turning up
🔴 SHORT Setup
• Bearish quad rotation
• Either:
– Bearish divergence OR
– Bearish flag pullback
• Fast stochastic turning down
⚠️ Signals are confirmation-based, not anticipatory.
4️⃣ SUPER LONG / SUPER SHORT
These appear only when:
• Quad rotation
• Divergence confirmation
They represent high-confidence momentum inflection zones, not guaranteed reversals.
5️⃣ Stop-Loss Visualization
Optional SL zones are plotted using:
• Recent swing high / low
• ATR-based buffer (configurable)
This helps traders visualize risk, not automate exits.
🎨 Visual System (Why It Looks Different)
• Multi-layer glow effects → momentum strength
• Dynamic cloud → fast vs trend dominance
• Color-shifting fast line → acceleration vs decay
• Chart overlays → execution clarity without clutter
Everything is designed for speed and readability during live trading.
⭐ Unique Selling Points (USP)
✅ Multi-speed stochastic rotation (not single-line signals)
✅ Context-first, not signal spam
✅ Built-in divergence + continuation logic
✅ Non-repainting logic
✅ Designed for scalpers, not hindsight analysis
✅ Works across indices, options, crypto, and futures
⚠️ Important Notes
• Not a standalone trading system
• Best combined with:
– Market structure
– Key levels
– Session timing
• Avoid low-liquidity or news-spike candles
This indicator guides execution, it does not replace discretion.
👤 Who This Is For
• Scalpers & intraday traders
• Options traders needing precise timing
• Traders who understand momentum & structure
• Users who want fewer but higher-quality signals
🏁 Summary
JK Scalp helps you trade momentum rotation, not overbought/oversold myths.
Wait for alignment. Execute with discipline.

My RSI Fib Range Cloud//SOLO900q99This is basically the close price, optionally “stepped” if you set Bars Per Sample > 1.
2. Central Threshold Band (colored line)
• This is an EMA of the resampled price (default length 34).
• It turns:
• Green when RSI is in bullish fib zones,
• Pink when RSI is in bearish fib zones,
• Grey when RSI is in the middle/neutral area.
3. Sigma Range High (green line) and Sigma Range Low (pink line)
• These are an upper and lower band around price.
• The distance from price is based on how much price has been moving recently (average change).

GARCH Adaptive Volatility & Momentum Predictor
💡 I. Indicator Concept: GARCH Adaptive Volatility & Momentum Predictor
-----------------------------------------------------------------------------
The GARCH Adaptive Momentum Speed indicator provides a powerful, forward-looking
view on market risk and momentum. Unlike standard moving averages or static
volatility indicators (like ATR), GARCH forecasts the Conditional Volatility (σ_t)
for the next bar, based on the principle of volatility clustering.
The indicator consists of two essential components:
1. GARCH Volatility (Level): The primary forecast of the expected magnitude of
price movement (risk).
2. Vol. Speed (Momentum): The first derivative of the GARCH forecast, showing
whether market risk is accelerating or decelerating. This component is the
main visual signal, displayed as a dynamic histogram.
⚙️ II. Key Features and Adaptive Logic
-----------------------------------------------------------------------------
* Dynamic Coefficient Adaptation: The indicator automatically adjusts the GARCH
coefficients (α and β) based on the chart's timeframe (TF):
- Intraday TFs (M1-H4): Uses higher α and lower β for quicker reaction
to recent shocks.
- Daily/Weekly TFs (D, W): Uses lower α and higher β for a smoother,
more persistent long-term forecast.
* Momentum Visualization: The Vol. Speed component is plotted as a dynamic
histogram (fill) that automatically changes color based on the direction of
acceleration (Green for up, Red for down).
📊 III. Interpretation Guide
-----------------------------------------------------------------------------
- GARCH Volatility (Blue Line): The predicted level of market risk. Use this to
gauge overall position sizing and stop loss width.
- Vol. Speed (Green Histogram): Momentum is ACCELERATING (Risk is increasing rapidly).
A strong signal that momentum is building, often preceding a breakout.
- Vol. Speed (Red Histogram): Momentum is DECELERATING (Risk is contracting).
Indicates momentum is fading, often associated with market consolidation.
🎯 IV. Trading Application
-----------------------------------------------------------------------------
- Breakout Timing: Look for a strong, high GREEN histogram bar. This suggests
the volatility pressure is increasing rapidly, and a breakout may be imminent.
- Consolidation: Small, shrinking RED histogram bars signal that market energy
is draining, ideal for tight consolidation patterns.

SigmaFlowSigmaFlow is a professional signal management connector designed to work with the SigmaFlow app. This indicator allows traders to structure trade setups (Entry, Stop Loss, TP1, TP2) on TradingView and send them into the SigmaFlow platform, where signals are managed, tracked, and delivered to Telegram.
Professional signal management — from TradingView to Telegram.
How SigmaFlow Works:
Sends trade data from TradingView to Telegram via the SigmaFlow platform.
SigmaFlow handles signal management, organization, history tracking, performance metrics, and Telegram delivery.
What It Does NOT Do:
Does not generate trading signals
Does not provide investment advice
Does not execute trades
Requirements:
TradingView plan with webhook alerts*
Active SigmaFlow account*
Disclaimer
SigmaFlow is a signal management and delivery tool only. All trade ideas are created manually by users. Trading involves risk and past performance does not guarantee future results.

ETIQUETAS DE ANCLAJE.INTERVALO 9:00 AM/4.15PMThis indicator displays labels on the candlestick that range from 9:00 am to 4:15 pm, with 5-minute intervals, indicating the 5M periods on the chart.

"Clean Market Structure & Trend Confirmation" TP LADDER(UPDATED)Clean Market Structure & Trend Confirmation — TP Ladder
This indicator is designed to identify high-probability intraday trend trades using market structure, momentum confirmation, and a visual ribbon system, with automatic take-profit and stop-loss levels plotted after confirmed signals.
WHAT THIS INDICATOR IS FOR
This script is built for active intraday traders trading SPY, QQQ, It focuses on trend continuation and directional momentum rather than scalping chop. It works best during regular market hours with extended hours enabled.
HOW TO LOAD (IMPORTANT)
Add the script to your chart
Set chart timeframe to 5-minute
Turn Extended Trading Hours ON
Use during the NY session (especially open and trend periods)
THE RIBBON (MOST IMPORTANT RULE)
The ribbon defines the trend.
• Blue/Teal ribbon = bullish trend
• Red ribbon = bearish trend
• Gray ribbon = compression / no trade zone
Only trade in the direction of the ribbon.
No ribbon alignment = no trade.
BULL & BEAR DOTS
“BULL” dot appears when structure flips bullish.
“BEAR” dot appears when structure flips bearish.
These confirm trend direction, not entries by themselves.
BUY & SELL ARROWS (ENTRIES)
• BUY arrow prints only when bullish ribbon, structure, momentum, and filters align
• SELL arrow prints only when bearish ribbon, structure, momentum, and filters align
• Arrows are non-repainting when using close-confirmed mode
No arrow = no trade.
CONTINUATION (C) LOGIC
The script allows limited continuation entries after pullbacks when structure realigns.
By default, only one continuation per direction per day is allowed to prevent overtrading and signal spam.
TAKE-PROFIT (TP) LADDER
When a BUY or SELL arrow confirms, the script automatically plots:
• TP1 = partial profit
• TP2 = extended target
• TP3 = final extension
• STOP = ATR-based stop loss
All levels are calculated using ATR and adjust automatically to volatility.
The ladder only appears after a confirmed signal.
HOW TO TRADE IT (SIMPLE FLOW)
Identify ribbon direction
Wait for BUY or SELL arrow
Enter on confirmation
Scale out at TP1, TP2, TP3
Respect the STOP line
If structure breaks or ribbon flips, exit.
WHAT TO AVOID
• Do not trade against the ribbon
• Do not trade in gray ribbon conditions
• Do not chase candles without arrows
• Do not expect constant signals (quality over quantity)

X-Trend Macro Command CenterX-Trend Macro Command Center (MCC) | Institutional Grade Dashboard
📝 Description Body
The Invisible Engine of the Market Revealed.
Traders often focus solely on Price Action, ignoring the massive underwater currents that actually drive trends: Global Liquidity, Inflation, and Central Bank Policy. We created X-Trend Macro Command Center (MCC) to solve this problem.
This is not just an indicator. It is a fundamental heads-up display that bridges the gap between technical charts and macroeconomic reality.
💡 The Idea & Philosophy
Markets don't move in a vacuum. Bull runs are fueled by M2 Money Supply expansion and negative real yields. Crashes are triggered by liquidity crunches and aggressive rate hikes. X-Trend MCC was built to give retail traders the same "Macro Awareness" that institutional desks possess. It aggregates fragmented economic data from Federal Reserve databases (FRED) directly onto your chart in real-time.
🚀 Application & Logic
This tool is designed for Trend Traders, Crypto Investors, and Macro Analysts.
Identify the Regime: Instantly see if the environment is "RISK ON" (High Liquidity, Low Real Rates) or "RISK OFF" (Monetary Tightening).
Validate the Trend: Don't buy the dip if Liquidity (M2) is crashing. Don't short the rally if Real Yields are negative.
Multi-Region Analysis: Switch instantly between economic powerhouses (US, China, Japan) to see where the capital is flowing.
📊 Dashboard Metrics Explained
Every row in the Command Center tells a specific story about the economy:
Interest Rate: The "Gravity" of finance. Higher rates weigh down risk assets (Stocks/Crypto).
Inflation (YoY): The erosion of purchasing power. We calculate this dynamically based on CPI data.
Real Yield (The "Golden" Metric): Calculated as Interest Rate - Inflation.
Green: Real Yield is low/negative. Cash is trash, assets fly.
Red: Real Yield is high. Cash is King, assets struggle.
US Debt & GDP: Fiscal health indicators formatted in Trillions ($T). Watch the Debt-to-GDP ratio—if it spikes >120%, expect currency debasement.
M2 Money Supply: The fuel tank of the market. Tracks the total amount of money in circulation.
↗ Trend: Liquidity is entering the system (Bullish).
↘ Trend: Liquidity is drying up (Bearish).
🧩 The X-Trend Ecosystem
X-Trend MCC is just the tip of the iceberg. This module is part of the larger X-Trend Project — a comprehensive suite of algorithmic tools being developed to quantify market chaos. While our Price Action algorithms (Lite/Pro/Ultra) handle the Micro, the MCC handles the Macro.
Technical Note:
Data Sources: Direct connection to FRED (Federal Reserve Economic Data).
Zero Repainting: Historical data is requested strictly using closed bars to ensure accuracy.
Open Source: We believe in transparency. The code is open for study under MPL 2.0.
Build by Dev0880 | X-Trend © 2025

ETIQUETAS 5M.This is the best way to determinate interval from five minutes to 1 minute in that time range of 9:25 am to 4:15 pm. you can know how to enter or exit trading action.

SIDD EMA RSI Supertrend Signal Table🔥 SIDD EMA RSI SuperTrend Multi-Timeframe Signal Table
**SIDD EMA RSI SuperTrend Signal Table** is a **clean, powerful multi-timeframe trend confirmation dashboard** designed for traders who want **clarity, confluence, and speed** — all in one glance.
This indicator **does NOT repaint** and uses **industry-standard trend logic** combining **EMA structure, RSI momentum, and SuperTrend direction** across **6 different timeframes**.
---
## 🧠 Core Logic Behind the Indicator
This script works on **three independent trend engines**, displayed together in a compact table:
### ✅ 1️⃣ EMA Trend (Structure Based)
* Uses **EMA 50 vs EMA 200**
* **Bullish** → EMA 50 above EMA 200
* **Bearish** → EMA 50 below EMA 200
* Captures **primary market structure**
### ✅ 2️⃣ RSI Trend (Momentum Based)
* RSI Length: **14**
* **Bullish** → RSI > **55**
* **Bearish** → RSI ≤ **55**
* Helps confirm **trend strength & momentum**
### ✅ 3️⃣ SuperTrend (Price Action Based)
* ATR Length: **10**
* Factor: **3.0**
* Clearly defines **trend direction & trailing bias**
* Excellent for **entry & exit alignment**
---
## ⏱️ Multi-Timeframe Coverage
The table analyzes trends across **6 configurable timeframes**:
* Intraday → **5m, 15m, 1H**
* Swing → **4H, Daily**
* Positional → **Weekly**
Each timeframe shows:
* 📈 EMA Trend
* 📊 RSI Trend
* 🔁 SuperTrend Direction
Color-coded for instant readability:
* 🟢 Bullish
* 🔴 Bearish
* ⚪ Neutral
---
## 🎯 How to Use This Indicator
✔ **Trend Trading**
Trade only when **EMA + RSI + SuperTrend align** across higher & lower timeframes.
✔ **Intraday Confirmation**
Use higher TF (1H / 4H) bias and take entries on lower TF.
✔ **Avoid Chop & False Signals**
If signals are mixed → market is likely **sideways or risky**.
✔ **Swing & Positional Trades**
Daily + Weekly alignment gives **high-probability setups**.
---
## ⚙️ Customization Options
* Adjustable **timeframes**
* Table **position** (Top/Bottom – Left/Right)
* Table **size** (Extra Small / Small / Normal)
* Custom **colors, borders & text**
* Optimized for **minimal chart clutter**
---
## ⚠️ Disclaimer
This indicator is a **trend confirmation & decision-support tool**.
Always combine with **price action, support/resistance, and proper risk management**.

HIGH BULLISH PROBABILITY SIGNAL Based on Ema, rsi, adr, volume we will determine if the stock is going to explode.

GK Zero-Lag Major BOS TrendGK ZERO-LAG Major BOS Trend
is a technical indicator designed to highlight breaks of structure BOS
in the direction of the prevailing trend
The script uses a zero-lag trend filter combined with confirmed structural high/low breaks to reduce noise and avoid minor or premature prints.
Print labels are only printed after candle close, ensuring stable, and confirmed prints
The indicator is designed to help traders identify trend continuation and structural shifts,
making it suitable as a confirmed tool across multiple markets and timeframes.
Best used on higher timeframes 5/15/30Min 2/3/4Hour
also resistance and support lines
Disclaimer
this indicator is provided for educational purposes only

Liquidity Vacuum DetectorThis indicator identifies liquidity vacuum zones—price areas where the market previously moved quickly with little resistance. These zones often allow price to travel faster once re-entered, which is favorable for intraday options trading.
Vacuum zones are created during strong, clean impulse moves (large range, low overlap, thin participation). When price later enters a stored vacuum zone with volume expansion, the indicator prints a directional triangle to highlight a potential high-speed move.
Optional filters include VWAP directional bias and regular trading hours (RTH).
Designed as a trade filter and acceleration tool, not a predictive signal.
Best used in combination with key levels (PMH/PML, ORH/ORL, VWAP) and volume confirmation.

Market Regime# MARKET REGIME IDENTIFICATION & TRADING SYSTEM
## Complete User Guide
---
## 📋 TABLE OF CONTENTS
1. (#overview)
2. (#regimes)
3. (#indicator-usage)
4. (#entry-signals)
5. (#exit-signals)
6. (#regime-strategies)
7. (#confluence)
8. (#backtesting)
9. (#optimization)
10. (#examples)
---
## OVERVIEW
### What This System Does
This is a **complete market regime identification and trading system** that:
1. **Identifies 6 distinct market regimes** automatically
2. **Adapts trading tactics** to each regime
3. **Provides high-probability entry signals** with confluence scoring
4. **Shows optimal exit points** for each trade
5. **Can be backtested** to validate performance
### Two Components Provided
1. **Indicator** (`market_regime_indicator.pine`)
- Visual regime identification
- Entry/exit signals on chart
- Dynamic support/resistance
- Info tables with live data
- Use for manual trading
2. **Strategy** (`market_regime_strategy.pine`)
- Fully automated backtestable version
- Same logic as indicator
- Position sizing and risk management
- Performance metrics
- Use for backtesting and automation
---
## THE 6 MARKET REGIMES
### 1. 🟢 BULL TRENDING
**Characteristics:**
- Strong uptrend
- Price above SMA50 and SMA200
- ADX > 25 (strong trend)
- Higher highs and higher lows
- DI+ > DI- (bullish momentum)
**What It Means:**
- Market has clear upward direction
- Buyers in control
- Pullbacks are buying opportunities
- Strongest regime for long positions
**How to Trade:**
- ✅ **BUY dips to EMA20 or SMA20**
- ✅ Enter when RSI < 60 on pullback
- ✅ Hold through minor corrections
- ❌ Don't short against the trend
- ❌ Don't sell too early
**Expected Behavior:**
- Pullbacks are shallow (5-10%)
- Bounces are strong
- Support at moving averages holds
- Volume increases on rallies
---
### 2. 🔴 BEAR TRENDING
**Characteristics:**
- Strong downtrend
- Price below SMA50 and SMA200
- ADX > 25 (strong trend)
- Lower highs and lower lows
- DI- > DI+ (bearish momentum)
**What It Means:**
- Market has clear downward direction
- Sellers in control
- Rallies are selling opportunities
- Strongest regime for short positions
**How to Trade:**
- ✅ **SELL rallies to EMA20 or SMA20**
- ✅ Enter when RSI > 40 on bounce
- ✅ Hold through minor bounces
- ❌ Don't buy against the trend
- ❌ Don't cover shorts too early
**Expected Behavior:**
- Rallies are weak (5-10%)
- Selloffs are strong
- Resistance at moving averages holds
- Volume increases on declines
---
### 3. 🔵 BULL RANGING
**Characteristics:**
- Bullish bias but consolidating
- Price near or above SMA50
- ADX < 20 (weak trend)
- Trading in range
- Choppy price action
**What It Means:**
- Uptrend is pausing
- Accumulation phase
- Support and resistance zones clear
- Lower volatility
**How to Trade:**
- ✅ **BUY at support zone**
- ✅ Enter when RSI < 40
- ✅ Take profits at resistance
- ⚠️ Smaller position sizes
- ⚠️ Tighter stops
**Expected Behavior:**
- Range-bound oscillations
- Support bounces repeatedly
- Resistance rejections common
- Eventually breaks higher (usually)
---
### 4. 🟠 BEAR RANGING
**Characteristics:**
- Bearish bias but consolidating
- Price near or below SMA50
- ADX < 20 (weak trend)
- Trading in range
- Choppy price action
**What It Means:**
- Downtrend is pausing
- Distribution phase
- Support and resistance zones clear
- Lower volatility
**How to Trade:**
- ✅ **SELL at resistance zone**
- ✅ Enter when RSI > 60
- ✅ Take profits at support
- ⚠️ Smaller position sizes
- ⚠️ Tighter stops
**Expected Behavior:**
- Range-bound oscillations
- Resistance holds repeatedly
- Support bounces are weak
- Eventually breaks lower (usually)
---
### 5. ⚪ CONSOLIDATION
**Characteristics:**
- No clear direction
- Range compression
- Very low ADX (< 15 often)
- Price inside tight range
- Neutral sentiment
**What It Means:**
- Market is coiling
- Building energy for next move
- Indecision between buyers/sellers
- Calm before the storm
**How to Trade:**
- ✅ **WAIT for breakout direction**
- ✅ Enter on high-volume breakout
- ✅ Direction becomes clear
- ❌ Don't trade inside the range
- ❌ Avoid choppy scalping
**Expected Behavior:**
- Narrow range
- Low volume
- False breakouts possible
- Explosive move when it breaks
---
### 6. 🟣 CHAOS (High Volatility)
**Characteristics:**
- Extreme volatility
- No clear direction
- Erratic price swings
- ATR > 2x average
- Unpredictable
**What It Means:**
- Market panic or euphoria
- News-driven moves
- Emotion dominates logic
- Highest risk environment
**How to Trade:**
- ❌ **STAY OUT!**
- ❌ No positions
- ❌ Wait for stability
- ✅ Protect existing positions
- ✅ Reduce risk
**Expected Behavior:**
- Large intraday swings
- Gaps up/down
- Stop hunts
- Whipsaws
- Eventually calms down
---
## INDICATOR USAGE
### Visual Elements
#### 1. Background Colors
- **Light Green** = Bull Trending (go long)
- **Light Red** = Bear Trending (go short)
- **Light Teal** = Bull Ranging (buy dips)
- **Light Orange** = Bear Ranging (sell rallies)
- **Light Gray** = Consolidation (wait)
- **Purple** = Chaos (stay out!)
#### 2. Regime Labels
- Appear when regime changes
- Show new regime name
- Positioned at highs (bullish) or lows (bearish)
#### 3. Entry Signals
- **Green "LONG"** labels = Buy here
- **Red "SHORT"** labels = Sell here
- Number shows confluence score (X/5 signals)
- Hover for details (stop, target, RSI, etc.)
#### 4. Exit Signals
- **Orange "EXIT LONG"** = Close long position
- **Orange "EXIT SHORT"** = Close short position
- Shows exit reason in tooltip
#### 5. Support/Resistance Lines
- **Green line** = Dynamic support (buy zone)
- **Red line** = Dynamic resistance (sell zone)
- Adapts to regime automatically
#### 6. Moving Averages
- **Blue** = SMA 20 (short-term trend)
- **Orange** = SMA 50 (medium-term trend)
- **Purple** = SMA 200 (long-term trend)
### Information Tables
#### Top Right Table (Main Info)
Shows real-time market conditions:
- **Current Regime** - What regime we're in
- **Bias** - Long, Short, Breakout, or Stay Out
- **ADX** - Trend strength (>25 = strong)
- **Trend** - Strong, Moderate, or Weak
- **Volatility** - High or Normal
- **Vol Ratio** - Current vs average volatility
- **RSI** - Momentum (>70 overbought, <30 oversold)
- **vs SMA50/200** - Price position relative to MAs
- **Support/Resistance** - Exact price levels
- **Long/Short Signals** - Confluence scores (X/5)
#### Bottom Right Table (Regime Guide)
Quick reference for each regime:
- What action to take
- What strategy to use
- Color-coded for quick identification
---
## ENTRY SIGNALS EXPLAINED
### Confluence Scoring System (5 Factors)
Each entry signal is scored 0-5 based on how many factors align:
#### For LONG Entries:
1. ✅ **Regime Alignment** - In Bull Trending or Bull Ranging
2. ✅ **RSI Pullback** - RSI between 35-50 (not overbought)
3. ✅ **Near Support** - Price within 2% of dynamic support
4. ✅ **MACD Turning Up** - Momentum shifting bullish
5. ✅ **Volume Confirmation** - Above average volume
#### For SHORT Entries:
1. ✅ **Regime Alignment** - In Bear Trending or Bear Ranging
2. ✅ **RSI Rejection** - RSI between 50-65 (not oversold)
3. ✅ **Near Resistance** - Price within 2% of dynamic resistance
4. ✅ **MACD Turning Down** - Momentum shifting bearish
5. ✅ **Volume Confirmation** - Above average volume
### Confluence Requirements
**Minimum Confluence** (default = 2):
- 2/5 = Entry signal triggered
- 3/5 = Good signal
- 4/5 = Strong signal
- 5/5 = Excellent signal (rare)
**Higher confluence = Higher probability = Better trades**
### Specific Entry Patterns
#### 1. Bull Trending Entry
```
Requirements:
- Regime = Bull Trending
- Price pulls back to EMA20
- Close above EMA20 (bounce)
- Up candle (close > open)
- RSI < 60
- Confluence ≥ 2
```
#### 2. Bear Trending Entry
```
Requirements:
- Regime = Bear Trending
- Price rallies to EMA20
- Close below EMA20 (rejection)
- Down candle (close < open)
- RSI > 40
- Confluence ≥ 2
```
#### 3. Bull Ranging Entry
```
Requirements:
- Regime = Bull Ranging
- RSI < 40 (oversold)
- Price at or below support
- Up candle (reversal)
- Confluence ≥ 1 (more lenient)
```
#### 4. Bear Ranging Entry
```
Requirements:
- Regime = Bear Ranging
- RSI > 60 (overbought)
- Price at or above resistance
- Down candle (rejection)
- Confluence ≥ 1 (more lenient)
```
#### 5. Consolidation Breakout
```
Requirements:
- Regime = Consolidation
- Price breaks above/below range
- Volume > 1.5x average (explosive)
- Strong directional candle
```
---
## EXIT SIGNALS EXPLAINED
### Three Types of Exits
#### 1. Regime Change Exits (Automatic)
- **Long Exit**: Regime changes to Bear Trending or Chaos
- **Short Exit**: Regime changes to Bull Trending or Chaos
- **Reason**: Market character changed, strategy no longer valid
#### 2. Support/Resistance Break Exits
- **Long Exit**: Price breaks below support by 2%
- **Short Exit**: Price breaks above resistance by 2%
- **Reason**: Key level violated, trend may be reversing
#### 3. Momentum Exits
- **Long Exit**: RSI > 70 (overbought) AND down candle
- **Short Exit**: RSI < 30 (oversold) AND up candle
- **Reason**: Overextension, take profits
### Stop Loss & Take Profit
**Stop Loss** (Automatic in strategy):
- Placed at Entry - (ATR × 2)
- Adapts to volatility
- Protected from whipsaws
- Typically 2-4% for stocks, 5-10% for crypto
**Take Profit** (Automatic in strategy):
- Placed at Entry + (Stop Distance × R:R Ratio)
- Default 2.5:1 reward:risk
- Example: $2 risk = $5 reward target
- Allows winners to run
---
## TRADING EACH REGIME
### BULL TRENDING - Most Profitable Long Environment
**Strategy: Buy Every Dip**
**Entry Rules:**
1. Wait for pullback to EMA20 or SMA20
2. Look for RSI < 60
3. Enter when candle closes above MA
4. Confluence should be 2+
**Stop Loss:**
- Below the recent swing low
- Or 2 × ATR below entry
**Take Profit:**
- At previous high
- Or 2.5:1 R:R minimum
**Position Size:**
- Can use full size (2% risk)
- High win rate regime
**Example Trade:**
```
Price: $100, pulls back to $98 (EMA20)
Entry: $98.50 (close above EMA)
Stop: $96.50 (2 ATR)
Target: $103.50 (2.5:1)
Risk: $2, Reward: $5
```
---
### BEAR TRENDING - Most Profitable Short Environment
**Strategy: Sell Every Rally**
**Entry Rules:**
1. Wait for bounce to EMA20 or SMA20
2. Look for RSI > 40
3. Enter when candle closes below MA
4. Confluence should be 2+
**Stop Loss:**
- Above the recent swing high
- Or 2 × ATR above entry
**Take Profit:**
- At previous low
- Or 2.5:1 R:R minimum
**Position Size:**
- Can use full size (2% risk)
- High win rate regime
**Example Trade:**
```
Price: $100, rallies to $102 (EMA20)
Entry: $101.50 (close below EMA)
Stop: $103.50 (2 ATR)
Target: $96.50 (2.5:1)
Risk: $2, Reward: $5
```
---
### BULL RANGING - Buy Low, Sell High
**Strategy: Range Trading (Long Bias)**
**Entry Rules:**
1. Wait for price at support zone
2. Look for RSI < 40
3. Enter on reversal candle
4. Confluence should be 1-2+
**Stop Loss:**
- Below support zone
- Tighter than trending (1.5 ATR)
**Take Profit:**
- At resistance zone
- Don't hold through resistance
**Position Size:**
- Reduce to 1-1.5% risk
- Lower win rate than trending
**Example Trade:**
```
Range: $95-$105
Entry: $96 (at support, RSI 35)
Stop: $94 (below support)
Target: $104 (at resistance)
Risk: $2, Reward: $8 (4:1)
```
---
### BEAR RANGING - Sell High, Buy Low
**Strategy: Range Trading (Short Bias)**
**Entry Rules:**
1. Wait for price at resistance zone
2. Look for RSI > 60
3. Enter on rejection candle
4. Confluence should be 1-2+
**Stop Loss:**
- Above resistance zone
- Tighter than trending (1.5 ATR)
**Take Profit:**
- At support zone
- Don't hold through support
**Position Size:**
- Reduce to 1-1.5% risk
- Lower win rate than trending
**Example Trade:**
```
Range: $95-$105
Entry: $104 (at resistance, RSI 65)
Stop: $106 (above resistance)
Target: $96 (at support)
Risk: $2, Reward: $8 (4:1)
```
---
### CONSOLIDATION - Wait for Breakout
**Strategy: Breakout Trading**
**Entry Rules:**
1. Identify consolidation range
2. Wait for VOLUME SURGE (1.5x+ avg)
3. Enter on close outside range
4. Direction must be clear
**Stop Loss:**
- Opposite side of range
- Or 2 ATR
**Take Profit:**
- Measure range height, project it
- Example: $10 range = $10 move expected
**Position Size:**
- Reduce to 1% risk
- 50% false breakout rate
**Example Trade:**
```
Consolidation: $98-$102 (4-point range)
Breakout: $102.50 (high volume)
Entry: $103
Stop: $100 (back in range)
Target: $107 (4-point range projected)
Risk: $3, Reward: $4
```
---
### CHAOS - STAY OUT!
**Strategy: Preservation**
**What to Do:**
- ❌ NO new positions
- ✅ Close existing positions if near entry
- ✅ Tighten stops on profitable trades
- ✅ Reduce position sizes dramatically
- ✅ Wait for regime to stabilize
**Why It's Dangerous:**
- Stop hunts are common
- Whipsaws everywhere
- News-driven volatility
- No technical reliability
- Even "perfect" setups fail
**When Does It End:**
- Volatility ratio drops < 1.5
- ADX starts rising (direction appears)
- Price respects support/resistance again
- Usually 1-5 days
---
## CONFLUENCE SYSTEM
### How It Works
The system scores each potential entry on 5 factors. More factors aligning = higher probability.
### Confluence Requirements by Regime
**Trending Regimes** (strictest):
- Minimum 2/5 required
- 3/5 = Good
- 4-5/5 = Excellent
**Ranging Regimes** (moderate):
- Minimum 1-2/5 required
- 2/5 = Good
- 3+/5 = Excellent
**Consolidation** (breakout only):
- Volume is most critical
- Direction confirmation
- Less confluence needed
### Adjusting Minimum Confluence
**If too few signals:**
- Lower from 2 to 1
- More trades, lower quality
**If too many false signals:**
- Raise from 2 to 3
- Fewer trades, higher quality
**Recommendation:**
- Start at 2
- Adjust based on win rate
- Aim for 55-65% win rate
---
## STRATEGY BACKTESTING
### Loading the Strategy
1. Copy `market_regime_strategy.pine`
2. Open Pine Editor in TradingView
3. Paste and "Add to Chart"
4. Strategy Tester tab opens at bottom
### Initial Settings
```
Risk Per Trade: 2%
ATR Stop Multiplier: 2.0
Reward:Risk Ratio: 2.5
Trade Longs: ✓
Trade Shorts: ✓
Trade Trending Only: ✗ (test both)
Avoid Chaos: ✓
Minimum Confluence: 2
```
### What to Look For
**Good Results:**
- Win Rate: 50-60%
- Profit Factor: 1.8-2.5
- Net Profit: Positive
- Max Drawdown: <20%
- Consistent equity curve
**Warning Signs:**
- Win Rate: <45% (too many losses)
- Profit Factor: <1.5 (barely profitable)
- Max Drawdown: >30% (too risky)
- Erratic equity curve (unstable)
### Testing Different Regimes
**Test 1: Trending Only**
```
Trade Trending Only: ✓
Result: Higher win rate, fewer trades
```
**Test 2: All Regimes**
```
Trade Trending Only: ✗
Result: More trades, potentially lower win rate
```
**Test 3: Long Only**
```
Trade Longs: ✓
Trade Shorts: ✗
Result: Works in bull markets
```
**Test 4: Short Only**
```
Trade Longs: ✗
Trade Shorts: ✓
Result: Works in bear markets
```
---
## SETTINGS OPTIMIZATION
### Key Parameters to Adjust
#### 1. Risk Per Trade (Most Important)
- **0.5%** = Very conservative
- **1.0%** = Conservative (recommended for beginners)
- **2.0%** = Moderate (recommended)
- **3.0%** = Aggressive
- **5.0%** = Very aggressive (not recommended)
**Impact:** Higher risk = higher returns BUT bigger drawdowns
#### 2. Reward:Risk Ratio
- **2:1** = More wins needed, hit target faster
- **2.5:1** = Balanced (recommended)
- **3:1** = Fewer wins needed, hold longer
- **4:1** = Very patient, best in trending
**Impact:** Higher R:R = can have lower win rate
#### 3. Minimum Confluence
- **1** = More signals, lower quality
- **2** = Balanced (recommended)
- **3** = Fewer signals, higher quality
- **4** = Very selective
- **5** = Almost never triggers
**Impact:** Higher = fewer but better trades
#### 4. ADX Thresholds
- **Trending: 20-30** (default 25)
- Lower = detect trends earlier
- Higher = only strong trends
- **Ranging: 15-25** (default 20)
- Lower = identify ranging earlier
- Higher = only weak trends
#### 5. Trend Period (SMA)
- **20-50** = Short-term trends
- **50** = Medium-term (default, recommended)
- **100-200** = Long-term trends
**Impact:** Longer period = slower regime changes, more stable
### Optimization Workflow
**Step 1: Baseline**
- Use all default settings
- Test on 3+ years
- Record: Win Rate, PF, Drawdown
**Step 2: Risk Optimization**
- Test 1%, 1.5%, 2%, 2.5%
- Find best risk-adjusted return
- Balance profit vs drawdown
**Step 3: R:R Optimization**
- Test 2:1, 2.5:1, 3:1
- Check which maximizes profit factor
- Consider holding time
**Step 4: Confluence Optimization**
- Test 1, 2, 3
- Find sweet spot for win rate
- Aim for 55-65% win rate
**Step 5: Regime Filter**
- Test with/without trend filter
- Test with/without chaos filter
- Find what works for your asset
---
## REAL TRADING EXAMPLES
### Example 1: Bull Trending - SPY
**Setup:**
- Regime: BULL TRENDING
- Price pulls back from $450 to $445
- EMA20 at $444
- RSI drops to 45
- Confluence: 4/5
**Entry:**
- Price closes at $445.50 (above EMA20)
- LONG signal appears
- Enter at $445.50
**Risk Management:**
- Stop: $443 (2 ATR = $2.50)
- Target: $451.75 (2.5:1 = $6.25)
- Risk: $2.50 per share
- Position: 80 shares (2% of $10k = $200 risk)
**Outcome:**
- Price rallies to $452 in 3 days
- Target hit
- Profit: $6.50 × 80 = $520
- Return: 2.6 × risk (excellent)
---
### Example 2: Bear Ranging - AAPL
**Setup:**
- Regime: BEAR RANGING
- Range: $165-$175
- Price rallies to $174
- Resistance at $175
- RSI at 68
- Confluence: 3/5
**Entry:**
- Rejection candle at $174
- SHORT signal appears
- Enter at $173.50
**Risk Management:**
- Stop: $176 (above resistance)
- Target: $166 (support)
- Risk: $2.50
- Position: 80 shares
**Outcome:**
- Price drops to $167 in 2 days
- Target hit
- Profit: $6.50 × 80 = $520
- Return: 2.6 × risk
---
### Example 3: Consolidation Breakout - BTC
**Setup:**
- Regime: CONSOLIDATION
- Range: $28,000 - $30,000
- Compressed for 2 weeks
- Volume declining
**Breakout:**
- Price breaks $30,000
- Volume surges 200%
- Close at $30,500
- LONG signal
**Entry:**
- Enter at $30,500
**Risk Management:**
- Stop: $29,500 (back in range)
- Target: $32,000 (range height = $2k)
- Risk: $1,000
- Position: 0.2 BTC ($200 risk on $10k)
**Outcome:**
- Price runs to $33,000
- Target exceeded
- Profit: $2,500 × 0.2 = $500
- Return: 2.5 × risk
---
### Example 4: Avoiding Chaos - Tesla
**Setup:**
- Regime: BULL TRENDING
- LONG position from $240
- Elon tweets something crazy
- Regime changes to CHAOS
**Action:**
- EXIT signal appears
- Close position immediately
- Current price: $242 (small profit)
**Outcome:**
- Next 3 days: wild swings
- High $255, Low $230
- By staying out, avoided:
- Potential stop out
- Whipsaw losses
- Stress
**Result:**
- Small profit preserved
- Capital protected
- Re-enter when regime stabilizes
---
## ALERTS SETUP
### Available Alerts
1. **Bull Trending Regime** - Market goes bullish
2. **Bear Trending Regime** - Market goes bearish
3. **Chaos Regime** - High volatility, stay out
4. **Long Entry Signal** - Buy opportunity
5. **Short Entry Signal** - Sell opportunity
6. **Long Exit Signal** - Close long
7. **Short Exit Signal** - Close short
### How to Set Up
1. Click **⏰ (Alert)** icon in TradingView
2. Select **Condition**: Choose indicator + alert type
3. **Options**: Popup, Email, Webhook, etc.
4. **Message**: Customize notification
5. Click **Create**
### Recommended Alert Strategy
**For Active Traders:**
- Long Entry Signal
- Short Entry Signal
- Long Exit Signal
- Short Exit Signal
**For Position Traders:**
- Bull Trending Regime (enter longs)
- Bear Trending Regime (enter shorts)
- Chaos Regime (exit all)
**For Conservative:**
- Only regime change alerts
- Manually review entries
- More selective
---
## TIPS FOR SUCCESS
### 1. Start Small
- Paper trade first
- Then 0.5% risk
- Build to 1-2% over time
### 2. Follow the Regime
- Don't fight it
- Adapt your style
- Different tactics for each
### 3. Trust the Confluence
- 4-5/5 = Best trades
- 2-3/5 = Good trades
- 1/5 = Skip unless desperate
### 4. Respect Exits
- Don't hope and hold
- Cut losses quickly
- Take profits at targets
### 5. Avoid Chaos
- Seriously, just stay out
- Protect your capital
- Wait for clarity
### 6. Keep a Journal
- Record every trade
- Note regime and confluence
- Review weekly
- Learn patterns
### 7. Backtest Thoroughly
- 3+ years minimum
- Multiple market conditions
- Different assets
- Walk-forward test
### 8. Be Patient
- Best setups are rare
- 1-3 trades per week is normal
- Quality over quantity
- Compound over time
---
## COMMON QUESTIONS
**Q: How many trades per month should I expect?**
A: Depends on timeframe and settings. Daily chart: 5-15 trades/month. 4H chart: 15-30 trades/month.
**Q: What's a good win rate?**
A: 55-65% is excellent. 50-55% is good. Below 50% needs adjustment.
**Q: Should I trade all regimes?**
A: Beginners: Only trending. Intermediate: Trending + ranging. Advanced: All except chaos.
**Q: Can I use this on any timeframe?**
A: Best on Daily and 4H. Works on 1H with more noise. Not recommended <1H.
**Q: What if I'm in a trade and regime changes?**
A: Exit immediately (if using indicator) or let strategy handle it automatically.
**Q: How do I know if I'm over-optimizing?**
A: If results are perfect on one period but fail on another. Use walk-forward testing.
**Q: Should I always take 5/5 confluence trades?**
A: Yes, but they're rare (1-2/month). Don't wait only for these.
**Q: Can I combine this with other indicators?**
A: Yes, but keep it simple. RSI, MACD already included. Maybe add volume profile.
**Q: What assets work best?**
A: Liquid stocks, major crypto, futures. Avoid forex spot (use futures), penny stocks.
**Q: How long to hold positions?**
A: Trending: Days to weeks. Ranging: Hours to days. Breakout: Days. Let the regime guide you.
---
## FINAL THOUGHTS
This system gives you:
- ✅ Clear market context (regime)
- ✅ High-probability entries (confluence)
- ✅ Defined exits (automatic signals)
- ✅ Adaptable tactics (regime-specific)
- ✅ Backtestable results (strategy version)
**Success requires:**
- 📚 Understanding each regime
- 🎯 Following the signals
- 💪 Discipline to wait
- 🧠 Emotional control
- 📊 Proper risk management
**Start your journey:**
1. Load the indicator
2. Watch for 1 week (no trading)
3. Identify regime patterns
4. Paper trade for 1 month
5. Go live with small size
6. Scale up as you gain confidence
**Remember:** The market will always be here. There's no rush. Master one regime at a time, and you'll be profitable in all conditions!
Good luck! 🚀

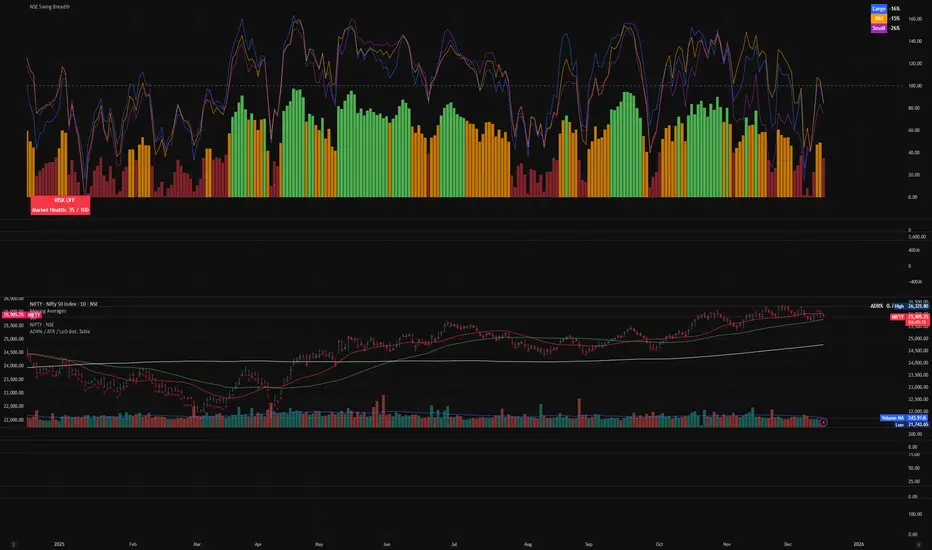
NSE Swing Breadth NSE Swing Breadth – Market Health Dashboard (0–200, % from Neutral)
Overview
NSE Swing Breadth – Market Health Dashboard is a market-wide health and regime indicator designed to track internal strength and participation across Large-, Mid-, and Small-cap indices in the Indian equity market.
Instead of focusing on price alone, this tool measures how strongly each segment is behaving relative to its own swing trend, normalizes those movements, and combines them into a single Market Health score. The result is a clean, objective dashboard that helps traders identify Risk-On, Caution, and Risk-Off regimes.
This indicator is best used for position sizing, exposure control, and timing aggressiveness, rather than individual stock entries.
Data Used
The indicator internally tracks three broad NSE indices:
Large Caps → NIFTY100EQUALWEIGHT
Mid Caps → NIFTYMIDCAP150
Small Caps → NIFTYSMLCAP250
Using equal-weighted and broad indices ensures the signal reflects true market participation, not just index heavyweights.
Core Logic
1. Swing Strength Model
For each index, the script calculates normalized swing strength:
Price is compared to its EMA swing baseline
The deviation from the EMA is normalized using the EMA of absolute deviations
This creates a volatility-adjusted strength value, allowing fair comparison across market regimes
This answers the question:
Is this segment pushing meaningfully above or below its recent trend?
2. Strength Converted to % from Neutral (Baseline = 100)
Each segment’s strength is converted into percentage-style points around a neutral baseline of 100:
100 = Neutral
+15 = +15% strength above neutral
–20 = –20% weakness below neutral
These values are plotted as three smooth lines:
Blue → Large Caps
Orange → Mid Caps
Purple → Small Caps
This makes relative leadership and divergence immediately visible.
3. Market Health Score (0–100)
The indicator combines all three segments into a single Market Health score:
Large Caps → 40% weight
Mid Caps → 35% weight
Small Caps → 25% weight
Extreme values are clamped to avoid distortion, and the final score is normalized to a 0–100 scale:
70–100 → Strong, broad participation
40–69 → Mixed / unstable participation
0–39 → Weak, risk-off conditions
Visual Components
📊 Market Health Histogram
A vertical histogram displays Market Health (0–100) with enhanced visibility:
🟢 Green (≥ 70) → Strong Risk-On regime
🟠 Orange (40–69) → Caution / Transition
🔴 Red (< 40) → Risk-Off regime
The histogram is visually compact and designed to reflect true market health, not exaggerated spikes.
📈 Strength Lines (Baseline = 100)
Three strength lines show % deviation from neutral:
Above 100 → Positive internal strength
Below 100 → Internal weakness
These lines help identify:
Leadership (which segment is driving the market)
Early deterioration (small/mid caps weakening first)
Broad confirmation (all segments rising together)
Dashboard Tables
📌 Market Regime Table (Bottom-Left)
Displays the current market regime:
🟢 RISK ON
🟡 CAUTION
🔴 RISK OFF
Along with the exact Market Health score (0–100).
📌 Strength Table (Top-Right)
Shows Large / Mid / Small cap strength as % from neutral, for example:
+18% → 18% above neutral
–12% → 12% below neutral
This avoids misleading interpretations and keeps values intuitive and actionable.
How to Use This Indicator
Risk-On (Green)
Favor full position sizes, trend-following strategies, and broader participation trades.
Caution (Orange)
Reduce leverage, tighten stops, and be selective. Expect choppiness.
Risk-Off (Red)
Prioritize capital protection, reduce exposure, and avoid aggressive longs.
This indicator is not an entry signal — it is a market environment filter.
⚠️ Important Style Setting (Required)
For correct visualization:
Settings → Style → Uncheck “Labels on price scale”
This prevents the indicator’s internal 0–200 model scale from interfering with the chart’s price scale and keeps the pane clean and readable.
Summary
NSE Swing Breadth – Market Health Dashboard provides a clear, objective view of market internals, helping traders align their risk with the true underlying condition of the market — not just price movement.
It is especially effective for:
Market regime identification
Exposure management
Avoiding false breakouts in weak breadth environments
SMAHiLO- 2 EMA/SMA can be used for trend following default value is 50 and 200
- green box and red box incorporated to chart for visual representation for Week ,Daily, H4, H2,H1
- blue line representation for opening candle, previous low and previous high and by clicking prev. close open alert at setting it will alert if prev. low or high are reach and current opening candle is breakdown or breakout
settings:
- engulfing alert it will alert bullish engulfing entry if 50 is above 200 vise versa
- harami alert it will alert bullish harami if 50 is above 200 vise versa
- pullback alert it will alert bullish pullback if 50 is above 200 or bearish pullback if 50 below 200
- mcd ob/os alert it will display green circle above candle if macd getting weaker from bearish to bullish vise versa
- spot play alert most of the time buy alert only no sell alert.
- engul/harami alert it will alert if harami or engulfing is met unlike on engulfing alert and harami alert it will follow the trend if 50 above 200 vise versa.

RSI + STOCH RSI - Marx_CapitalSimple RSI + STOCH RSI indicator in one pane. In addition to the standard 30/70 and 20/80 RSI levels you have three adjustable levels (eg. 0, 50, 100) to indicate STOCH RSI overbought/oversold scenarios.

Volume Orderblock Breakout v3.6this is indicator that shows long short siganl and tp lines can be checked.
you can get profit by this forever.
we can win over whales
keep going don't give up!!!

BTC - Bitcoin Strategic Dashboard by RM Title: BTC - Bitcoin Strategic Dashboard | RM
Overview & Philosophy
The Bitcoin Strategic Dashboard is a comprehensive analytics tool designed to provide deeper market context beyond simple price action.
While a standard chart displays price history, this dashboard focuses on the structural health of the market. It aims to answer clearer questions: Is the asset statistically overextended? Is the current volatility compressed or expanding? How is Bitcoin currently correlating with traditional equity markets?
This script aggregates key data points—Performance, Risk, Valuation, and Macro Correlations—into a single, organized table. It is designed to be a quiet, high-density reference tool that sits unobtrusively in the corner of your screen, helping to contextualize daily price movements without cluttering your workspace.
Methodology & Module Breakdown
The dashboard is divided into 5 strategic modules. Here is exactly how to read them, how they are calculated, and how to interpret the data.
1. PERFORMANCE
This section answers: "Is Bitcoin actually beating the traditional market, and by how much?"
BTC Return : The raw percentage growth of Bitcoin.
Timeframes: 1-Year (Tactical Trend) and 4-Year (The Halving Cycle).
Alpha (vs SPX / Gold):
Meaning : "Alpha" measures true outperformance. It tells you how much better your capital worked in Bitcoin compared to the S&P 500 (Stocks) or Gold.
Calculation : We use a Relative Growth Ratio. Instead of simple subtraction, we calculate the growth factor of BTC divided by the growth factor of the Benchmark.
Interpretation :
Green: Bitcoin is outperforming. It is the superior vehicle for capital.
Red: Bitcoin is underperforming traditional assets (Opportunity Cost is high).
2. RISK PROFILE
This section answers: "How dangerous is the market right now?"
Drawdown (DD):
Meaning : The percentage loss from the 1-Year High.
Interpretation : Deep Drawdowns (e.g., > -50%) historically signal generational buying opportunities (Deep Red). Small Drawdowns (< -5%) signal we are near "Discovery Mode" (Blue/Green).
Sharpe Ratio:
Meaning : The industry standard for "Risk-Adjusted Return." It asks: "Is the profit worth the stress?"
Timeframe : Annualized over 365 Days.
Interpretation :
> 1.0: Good. The return justifies the risk.
> 2.0: Excellent. (Dark Green).
< 0.0: Bad. You are taking risk for negative returns.
Sortino Ratio:
Meaning : Similar to Sharpe, but it only counts downside volatility as "risk." Bitcoin often rallies aggressively (Good Volatility); Sortino ignores the upside "risk" and focuses only on minimizing losses.
Volatility (Vol) & Rank:
Meaning : How violently the price is moving.
Calculation : We compare the current 30-Day Volatility against the last 4 Years of volatility history (Rank 0-100).
Interpretation (The Squeeze Strategy) :
BLUE (Cold / <25%): Volatility is historically low. The market is "compressed." Big moves often follow these periods.
RED (Hot / >75%): Volatility is extreme. High risk of mean reversion or panic.
3. VALUATION & MOMENTUM
This section answers: "Is Bitcoin cheap or expensive?"
Mayer Multiple (MM):
Meaning: A "Godfather" of Bitcoin ratios.
Calculation : Current Price divided by the 200-Day Moving Average.
Interpretation :
< 0.8 (Blue): Historically "Cheap."
1.0: Fair Value (Price = Trend).
> 2.4 (Red): Speculative Bubble territory.
RSI (Relative Strength Index):
Timeframe : 14 Days.
Interpretation : >70 suggests the market is overheated (Red). <30 suggests oversold conditions (Blue).
Trend (ADX) :
Meaning : The Average Directional Index measures the strength of a trend, not the direction.
Interpretation : Values >25 (Green) indicate a strong trend is present. Values <20 (Gray) indicate a choppy/sideways market (no trend).
vs 200W (Macro):
Meaning : The distance to the 200-Week Moving Average.
Interpretation : This line is historically the "Cycle Bottom" or "Absolute Support" for Bitcoin. Being close to it (or below it) is rare and often marks cycle lows.
4. MACRO CORRELATIONS
This section answers: "Is Bitcoin moving on its own, or just following the Stock Market?"
vs TradFi (SPX):
Timeframe : 90-Day Correlation Coefficient.
Interpretation :
High Positive (Red): BTC is just acting like a tech stock. No "Safe Haven" status.
Negative/Zero (Green): BTC is "decoupled." It is moving independently of Wall Street.
vs DXY (US Dollar):
Interpretation : Bitcoin usually moves inverse to the Dollar.
Negative (Green): Normal healthy behavior.
Positive (Red): Warning signal. If both DXY and BTC rise, something is breaking in the system.
5. HISTORICAL LEDGER
A Year-by-Year breakdown of returns.
Feature : You can toggle the comparison column in the settings to compare Bitcoin against either S&P 500 or Gold.
Usage : Helps visualize the cyclical nature of returns (e.g., the 4-year cycle pattern of Green-Green-Green-Red).
How to Read the Visuals (Heatmap)
The dashboard uses a standardized Bloomberg-style heatmap to let you assess the market state in milliseconds:
🟢 Green: Profit / Good Performance / Positive Alpha.
🔴 Red: Loss / Overheating / High Risk.
🔵 Blue: "Cold" / Cheap / Low Volatility (Potential Buy Zones).
🟠 Orange: Warning / High Drawdown.
⚫ Gray/Black: Neutral or Fair Value.
Settings & Customization
Visuals: Change the text size (Tiny, Small, Normal) to fit your screen resolution.
Modules: You can toggle individual sections on/off to save screen space.
Calculation: Switch the Historical Benchmark between "S&P 500" and "Gold" depending on your thesis.
Disclaimer
This script is for research and educational purposes only. The metrics provided (Sharpe, Sortino, Mayer Multiple) are derived from historical data and do not guarantee future performance. "Cheap" (Low Mayer Multiple) does not mean the price cannot go lower. Always manage your own risk.
Tags
bitcoin, btc, bloomberg, terminal, dashboard, onchain, mayer multiple, sharpe ratio, volatility, alpha, risk management, Rob Maths

Entry / TP / SL Alert Bands (Simple & Stable)
Get an alert before you reach your take profit or stop loss. Set as a percentage over the distance to your stop loss and take profit and improve your Money Management

CRT+ Advance Engulfing | @stefandimovCRT+ Lite implements institutional-style Candle Range Theory logic to identify displacement-driven engulfing structures with precision.
The script focuses on wick-based liquidity grabs, strict body closes, and optional higher-timeframe confirmation to highlight structurally valid bullish and bearish reversals.
Includes a Daily-only multi-market scanner and a compact dashboard for fast top-down analysis.
Designed for traders who prioritize structure, execution precision, and HTF alignment.

Risk & Order Size Calculatorhello,
this will calculate the risk and you may change the script as per your risk appetite, my advise do not risk more than 2% of your capital.
Thank you
