HelperFunctionsLibrary "HelperFunctions"
A collection of my most used functions
apply_smoothing()
Apply one of Pine Script's built-in smoothing functions to a series
Indicatori e strategie

X48_LibaryStrategyStatusLibrary "X48_LibaryStrategyStatus"
// Thanks For Code by Cayoshi this code back up for my strategy, make sure when use libary direct the code in my libary
//****** HOW TO ********//
// COPY THIS CODE AND PASTE TO YOUR STRATEGY
// ⬇️⬇️⬇️⬇️⬇️⬇️⬇️⬇️⬇️⬇️⬇️
// >> เรียกใช้ library ( import lib) <<<
import X4815162342/X48_LibaryStrategyStatus/1 as fuLi
//>>> แสดงผล Backtest (Show BackTest In Your Chart) <<<<
show_Net = input.bool(true,'Show Net', inline = 'Lnet')
position_ = input.string('bottom_center','Position', options = , inline = 'Lnet')
size_i = input.string('auto','size', options = , inline = 'Lnet')
color_Net = input.color(color.blue,"" , inline = 'Lnet')
fuLi.NetProfit_Show(show_Net , position_ , size_i, color_Net )

DatasetWeatherTokyoMeanAirTemperatureLibrary "DatasetWeatherTokyoMeanAirTemperature"
Provides a data set of the monthly mean air temperature (°C) for the city of Tokyo in Japan.
this was just for fun, no financial implications in this.
reference:
www.data.jma.go.jp
TOKYO WMO Station ID:47662 Lat 35o41.5'N Lon 139o45.0'E
year_()
the years of the data set.
Returns: array : year values.
january()
the january values of the dataset
Returns: array\ : data values for january.
february()
the february values of the dataset
Returns: array\ : data values for february.
march()
the march values of the dataset
Returns: array\ : data values for march.
april()
the april values of the dataset
Returns: array\ : data values for april.
may()
the may values of the dataset
Returns: array\ : data values for may.
june()
the june values of the dataset
Returns: array\ : data values for june.
july()
the july values of the dataset
Returns: array\ : data values for july.
august()
the august values of the dataset
Returns: array\ : data values for august.
september()
the september values of the dataset
Returns: array\ : data values for september.
october()
the october values of the dataset
Returns: array\ : data values for october.
november()
the november values of the dataset
Returns: array\ : data values for november.
december()
the december values of the dataset
Returns: array\ : data values for december.
annual()
the annual values of the dataset
Returns: array\ : data values for annual.
select_month(idx)
get the temperature values for a specific month.
Parameters:
idx : int, month index (1 -> 12 | any other value returns annual average values).
Returns: array\ : data values for selected month.
select_value(year_, month_)
get the temperature value of a specified year and month.
Parameters:
year_ : int, year value.
month_ : int, month index (1 -> 12 | any other value returns annual average values).
Returns: float : value of specified year and month.
diff_to_median(month_)
the difference of the month air temperature (ºC) to the median of the sample.
Parameters:
month_ : int, month index (1 -> 12 | any other value returns annual average values).
Returns: float : difference of current month to median in (Cº)

LevelsManagerLibrary "LevelsManager"
TODO: Track up to 6 TakeProfits and 1 StopLoss achievement for one or many of your buy/sell conditions.
manageTrade(bool, bool, bool, string, string, float, float, bool, bool, bool, bool, bool, bool, float, float, float, float, float, float, float)
Track TakeProfits and StopLoss achievement for one or many of your buy/sell conditions. CHECK the commented section: "Function @manageTrade" for Description
Parameters:
bool : useSignal.
bool : b_gameOVer.
bool : b_gameOVer.
string : bName.
string : sName.
float : buyEntrySource.
float : sellEntrySource.
bool : useTp1.
bool : useTp2.
bool : useTp3.
bool : useTp4.
bool : useTp5.
bool : useTp6.
float : tp1x.
float : tp2x.
float : tp3x.
float : tp4x.
float : tp5x.
float : tp6x.
float : slx.
Returns: check commented section: "Function @manageTrade".
showOnlyFirstOccurence(booleanInput)
Single out the occurence of a bool series between to 2 bool series.
Parameters:
booleanInput : to activate or deactivate occurences filtering.
Returns: filterred or not bool series.

TR_HighLow_LibLibrary "TR_HighLow_Lib"
TODO: add library description here
ShowLabel(_Text, _X, _Y, _Style, _Size, _Yloc, _Color)
TODO: Function to display labels
Parameters:
_Text : TODO: text (series string) Label text.
_X : TODO: x (series int) Bar index.
_Y : TODO: y (series int/float) Price of the label position.
_Style : TODO: style (series string) Label style.
_Size : TODO: size (series string) Label size.
_Yloc : TODO: yloc (series string) Possible values are yloc.price, yloc.abovebar, yloc.belowbar.
_Color : TODO: color (series color) Color of the label border and arrow
Returns: TODO: No return values
GetColor(_Index)
TODO: Function to take out 12 colors in order
Parameters:
_Index : TODO: color number.
Returns: TODO: color code
Tbl_position(_Pos)
TODO: Table display position function
Parameters:
_Pos : TODO: position.
Returns: TODO: Table position
DeleteLine()
TODO: Delete Line
Parameters:
: TODO: No parameter
Returns: TODO: No return value
DeleteLabel()
TODO: Delete Label
Parameters:
: TODO: No parameter
Returns: TODO: No return value
ZigZag(_a_PHiLo, _a_IHiLo, _a_FHiLo, _a_DHiLo, _Histories, _Provisional_PHiLo, _Provisional_IHiLo, _Color1, _Width1, _Color2, _Width2, _ShowLabel, _ShowHighLowBar, _HighLowBarWidth, _HighLow_LabelSize)
TODO: Draw a zig-zag line.
Parameters:
_a_PHiLo : TODO: High-Low price array
_a_IHiLo : TODO: High-Low INDEX array
_a_FHiLo : TODO: High-Low flag array sequence 1:High 2:Low
_a_DHiLo : TODO: High-Low Price Differential Array
_Histories : TODO: Array size (High-Low length)
_Provisional_PHiLo : TODO: Provisional High-Low Price
_Provisional_IHiLo : TODO: Provisional High-Low INDEX
_Color1 : TODO: Normal High-Low color
_Width1 : TODO: Normal High-Low width
_Color2 : TODO: Provisional High-Low color
_Width2 : TODO: Provisional High-Low width
_ShowLabel : TODO: Label display flag True: Displayed False: Not displayed
_ShowHighLowBar : TODO: High-Low bar display flag True:Show False:Hide
_HighLowBarWidth : TODO: High-Low bar width
_HighLow_LabelSize : TODO: Label Size
Returns: TODO: No return value
TrendLine(_a_PHiLo, _a_IHiLo, _Histories, _MultiLine, _StartWidth, _EndWidth, _IncreWidth, _StartTrans, _EndTrans, _IncreTrans, _ColorMode, _Color1_1, _Color1_2, _Color2_1, _Color2_2, _Top_High, _Top_Low, _Bottom_High, _Bottom_Low)
TODO: Draw a Trend Line
Parameters:
_a_PHiLo : TODO: High-Low price array
_a_IHiLo : TODO: High-Low INDEX array
_Histories : TODO: Array size (High-Low length)
_MultiLine : TODO: Draw a multiple Line.
_StartWidth : TODO: Line width start value
_EndWidth : TODO: Line width end value
_IncreWidth : TODO: Line width increment value
_StartTrans : TODO: Transparent rate start value
_EndTrans : TODO: Transparent rate finally
_IncreTrans : TODO: Transparent rate increase value
_ColorMode : TODO: 0:Nomal 1:Gradation
_Color1_1 : TODO: Gradation Color 1_1
_Color1_2 : TODO: Gradation Color 1_2
_Color2_1 : TODO: Gradation Color 2_1
_Color2_2 : TODO: Gradation Color 2_2
_Top_High : TODO: _Top_High Value for Gradation
_Top_Low : TODO: _Top_Low Value for Gradation
_Bottom_High : TODO: _Bottom_High Value for Gradation
_Bottom_Low : TODO: _Bottom_Low Value for Gradation
Returns: TODO: No return value
Fibonacci(_a_Fibonacci, _a_PHiLo, _Provisional_PHiLo, _Index, _FrontMargin, _BackMargin)
TODO: Draw a Fibonacci line
Parameters:
_a_Fibonacci : TODO: Fibonacci Percentage Array
_a_PHiLo : TODO: High-Low price array
_Provisional_PHiLo : TODO: Provisional High-Low price (when _Index is 0)
_Index : TODO: Where to draw the Fibonacci line
_FrontMargin : TODO: Fibonacci line front-margin
_BackMargin : TODO: Fibonacci line back-margin
Returns: TODO: No return value
Fibonacci(_a_Fibonacci, _a_PHiLo, _Provisional_PHiLo, _Index1, _FrontMargin1, _BackMargin1, _Transparent1, _Index2, _FrontMargin2, _BackMargin2, _Transparent2)
TODO: Draw a Fibonacci line
Parameters:
_a_Fibonacci : TODO: Fibonacci Percentage Array
_a_PHiLo : TODO: High-Low price array
_Provisional_PHiLo : TODO: Provisional High-Low price (when _Index is 0)
_Index1 : TODO: Where to draw the Fibonacci line 1
_FrontMargin1 : TODO: Fibonacci line front-margin 1
_BackMargin1 : TODO: Fibonacci line back-margin 1
_Transparent1 : TODO: Transparent rate 1
_Index2 : TODO: Where to draw the Fibonacci line 2
_FrontMargin2 : TODO: Fibonacci line front-margin 2
_BackMargin2 : TODO: Fibonacci line back-margin 2
_Transparent2 : TODO: Transparent rate 2
Returns: TODO: No return value
High_Low_Judgment(_Length, _Extension, _Difference)
TODO: Judges High-Low
Parameters:
_Length : TODO: High-Low Confirmation Length
_Extension : TODO: Length of extension when the difference did not open
_Difference : TODO: Difference size
Returns: TODO: _HiLo=High-Low flag 0:Neither high nor low、1:High、2:Low、3:High-Low
_PHi=high price、_PLo=low price、_IHi=High Price Index、_ILo=Low Price Index、
_Cnt=count、_ECnt=Extension count、
_DiffHi=Difference from Start(High)、_DiffLo=Difference from Start(Low)、
_StartHi=Start value(High)、_StartLo=Start value(Low)
High_Low_Data_AddedAndUpdated(_HiLo, _Histories, _PHi, _PLo, _IHi, _ILo, _DiffHi, _DiffLo, _a_PHiLo, _a_IHiLo, _a_FHiLo, _a_DHiLo)
TODO: Adds and updates High-Low related arrays from given parameters
Parameters:
_HiLo : TODO: High-Low flag
_Histories : TODO: Array size (High-Low length)
_PHi : TODO: Price Hi
_PLo : TODO: Price Lo
_IHi : TODO: Index Hi
_ILo : TODO: Index Lo
_DiffHi : TODO: Difference in High
_DiffLo : TODO: Difference in Low
_a_PHiLo : TODO: High-Low price array
_a_IHiLo : TODO: High-Low INDEX array
_a_FHiLo : TODO: High-Low flag array 1:High 2:Low
_a_DHiLo : TODO: High-Low Price Differential Array
Returns: TODO: _PHiLo price array、_IHiLo indexed array、_FHiLo flag array、_DHiLo price-matching array、
Provisional_PHiLo Provisional price、Provisional_IHiLo 暫定インデックス
High_Low(_a_PHiLo, _a_IHiLo, _a_FHiLo, _a_DHiLo, _a_Fibonacci, _Length, _Extension, _Difference, _Histories, _ShowZigZag, _ZigZagColor1, _ZigZagWidth1, _ZigZagColor2, _ZigZagWidth2, _ShowZigZagLabel, _ShowHighLowBar, _ShowTrendLine, _TrendMultiLine, _TrendStartWidth, _TrendEndWidth, _TrendIncreWidth, _TrendStartTrans, _TrendEndTrans, _TrendIncreTrans, _TrendColorMode, _TrendColor1_1, _TrendColor1_2, _TrendColor2_1, _TrendColor2_2, _ShowFibonacci1, _FibIndex1, _FibFrontMargin1, _FibBackMargin1, _FibTransparent1, _ShowFibonacci2, _FibIndex2, _FibFrontMargin2, _FibBackMargin2, _FibTransparent2, _ShowInfoTable1, _TablePosition1, _ShowInfoTable2, _TablePosition2)
TODO: Draw the contents of the High-Low array.
Parameters:
_a_PHiLo : TODO: High-Low price array
_a_IHiLo : TODO: High-Low INDEX array
_a_FHiLo : TODO: High-Low flag sequence 1:High 2:Low
_a_DHiLo : TODO: High-Low Price Differential Array
_a_Fibonacci : TODO: Fibonacci Gnar Matching
_Length : TODO: Length of confirmation
_Extension : TODO: Extension Length of extension when the difference did not open
_Difference : TODO: Difference size
_Histories : TODO: High-Low Length
_ShowZigZag : TODO: ZigZag Display
_ZigZagColor1 : TODO: Colors of ZigZag1
_ZigZagWidth1 : TODO: Width of ZigZag1
_ZigZagColor2 : TODO: Colors of ZigZag2
_ZigZagWidth2 : TODO: Width of ZigZag2
_ShowZigZagLabel : TODO: ZigZagLabel Display
_ShowHighLowBar : TODO: High-Low Bar Display
_ShowTrendLine : TODO: Trend Line Display
_TrendMultiLine : TODO: Trend Multi Line Display
_TrendStartWidth : TODO: Line width start value
_TrendEndWidth : TODO: Line width end value
_TrendIncreWidth : TODO: Line width increment value
_TrendStartTrans : TODO: Starting transmittance value
_TrendEndTrans : TODO: Transmittance End Value
_TrendIncreTrans : TODO: Increased transmittance value
_TrendColorMode : TODO: color mode
_TrendColor1_1 : TODO: Trend Color 1_1
_TrendColor1_2 : TODO: Trend Color 1_2
_TrendColor2_1 : TODO: Trend Color 2_1
_TrendColor2_2 : TODO: Trend Color 2_2
_ShowFibonacci1 : TODO: Fibonacci1 Display
_FibIndex1 : TODO: Fibonacci1 Index No.
_FibFrontMargin1 : TODO: Fibonacci1 Front margin
_FibBackMargin1 : TODO: Fibonacci1 Back Margin
_FibTransparent1 : TODO: Fibonacci1 Transmittance
_ShowFibonacci2 : TODO: Fibonacci2 Display
_FibIndex2 : TODO: Fibonacci2 Index No.
_FibFrontMargin2 : TODO: Fibonacci2 Front margin
_FibBackMargin2 : TODO: Fibonacci2 Back Margin
_FibTransparent2 : TODO: Fibonacci2 Transmittance
_ShowInfoTable1 : TODO: InfoTable1 Display
_TablePosition1 : TODO: InfoTable1 position
_ShowInfoTable2 : TODO: InfoTable2 Display
_TablePosition2 : TODO: InfoTable2 position
Returns: TODO: 無し

TR_HighLowLibrary "TR_HighLow"
TODO: add library description here
ShowLabel(_Text, _X, _Y, _Style, _Size, _Yloc, _Color)
TODO: Function to display labels
Parameters:
_Text : TODO: text (series string) Label text.
_X : TODO: x (series int) Bar index.
_Y : TODO: y (series int/float) Price of the label position.
_Style : TODO: style (series string) Label style.
_Size : TODO: size (series string) Label size.
_Yloc : TODO: yloc (series string) Possible values are yloc.price, yloc.abovebar, yloc.belowbar.
_Color : TODO: color (series color) Color of the label border and arrow
Returns: TODO: No return values
GetColor(_Index)
TODO: Function to take out 12 colors in order
Parameters:
_Index : TODO: color number.
Returns: TODO: color code
Tbl_position(_Pos)
TODO: Table display position function
Parameters:
_Pos : TODO: position.
Returns: TODO: Table position
DeleteLine()
TODO: Delete Line
Parameters:
: TODO: No parameter
Returns: TODO: No return value
DeleteLabel()
TODO: Delete Label
Parameters:
: TODO: No parameter
Returns: TODO: No return value
ZigZag(_a_PHiLo, _a_IHiLo, _a_FHiLo, _a_DHiLo, _Histories, _Provisional_PHiLo, _Provisional_IHiLo, _Color1, _Width1, _Color2, _Width2, _ShowLabel, _ShowHighLowBar, _HighLowBarWidth, _HighLow_LabelSize)
TODO: Draw a zig-zag line.
Parameters:
_a_PHiLo : TODO: High-Low price array
_a_IHiLo : TODO: High-Low INDEX array
_a_FHiLo : TODO: High-Low flag array sequence 1:High 2:Low
_a_DHiLo : TODO: High-Low Price Differential Array
_Histories : TODO: Array size (High-Low length)
_Provisional_PHiLo : TODO: Provisional High-Low Price
_Provisional_IHiLo : TODO: Provisional High-Low INDEX
_Color1 : TODO: Normal High-Low color
_Width1 : TODO: Normal High-Low width
_Color2 : TODO: Provisional High-Low color
_Width2 : TODO: Provisional High-Low width
_ShowLabel : TODO: Label display flag True: Displayed False: Not displayed
_ShowHighLowBar : TODO: High-Low bar display flag True:Show False:Hide
_HighLowBarWidth : TODO: High-Low bar width
_HighLow_LabelSize : TODO: Label Size
Returns: TODO: No return value
TrendLine(_a_PHiLo, _a_IHiLo, _Histories, _MultiLine, _StartWidth, _EndWidth, _IncreWidth, _StartTrans, _EndTrans, _IncreTrans, _ColorMode, _Color1_1, _Color1_2, _Color2_1, _Color2_2, _Top_High, _Top_Low, _Bottom_High, _Bottom_Low)
TODO: Draw a Trend Line
Parameters:
_a_PHiLo : TODO: High-Low price array
_a_IHiLo : TODO: High-Low INDEX array
_Histories : TODO: Array size (High-Low length)
_MultiLine : TODO: Draw a multiple Line.
_StartWidth : TODO: Line width start value
_EndWidth : TODO: Line width end value
_IncreWidth : TODO: Line width increment value
_StartTrans : TODO: Transparent rate start value
_EndTrans : TODO: Transparent rate finally
_IncreTrans : TODO: Transparent rate increase value
_ColorMode : TODO: 0:Nomal 1:Gradation
_Color1_1 : TODO: Gradation Color 1_1
_Color1_2 : TODO: Gradation Color 1_2
_Color2_1 : TODO: Gradation Color 2_1
_Color2_2 : TODO: Gradation Color 2_2
_Top_High : TODO: _Top_High Value for Gradation
_Top_Low : TODO: _Top_Low Value for Gradation
_Bottom_High : TODO: _Bottom_High Value for Gradation
_Bottom_Low : TODO: _Bottom_Low Value for Gradation
Returns: TODO: No return value
Fibonacci(_a_Fibonacci, _a_PHiLo, _Provisional_PHiLo, _Index, _FrontMargin, _BackMargin)
TODO: Draw a Fibonacci line
Parameters:
_a_Fibonacci : TODO: Fibonacci Percentage Array
_a_PHiLo : TODO: High-Low price array
_Provisional_PHiLo : TODO: Provisional High-Low price (when _Index is 0)
_Index : TODO: Where to draw the Fibonacci line
_FrontMargin : TODO: Fibonacci line front-margin
_BackMargin : TODO: Fibonacci line back-margin
Returns: TODO: No return value
Fibonacci(_a_Fibonacci, _a_PHiLo, _Provisional_PHiLo, _Index1, _FrontMargin1, _BackMargin1, _Transparent1, _Index2, _FrontMargin2, _BackMargin2, _Transparent2)
TODO: Draw a Fibonacci line
Parameters:
_a_Fibonacci : TODO: Fibonacci Percentage Array
_a_PHiLo : TODO: High-Low price array
_Provisional_PHiLo : TODO: Provisional High-Low price (when _Index is 0)
_Index1 : TODO: Where to draw the Fibonacci line 1
_FrontMargin1 : TODO: Fibonacci line front-margin 1
_BackMargin1 : TODO: Fibonacci line back-margin 1
_Transparent1 : TODO: Transparent rate 1
_Index2 : TODO: Where to draw the Fibonacci line 2
_FrontMargin2 : TODO: Fibonacci line front-margin 2
_BackMargin2 : TODO: Fibonacci line back-margin 2
_Transparent2 : TODO: Transparent rate 2
Returns: TODO: No return value
High_Low_Judgment(_Length, _Extension, _Difference)
TODO: Judges High-Low
Parameters:
_Length : TODO: High-Low Confirmation Length
_Extension : TODO: Length of extension when the difference did not open
_Difference : TODO: Difference size
Returns: TODO: _HiLo=High-Low flag 0:Neither high nor low、1:High、2:Low、3:High-Low
_PHi=high price、_PLo=low price、_IHi=High Price Index、_ILo=Low Price Index、
_Cnt=count、_ECnt=Extension count、
_DiffHi=Difference from Start(High)、_DiffLo=Difference from Start(Low)、
_StartHi=Start value(High)、_StartLo=Start value(Low)
High_Low_Data_AddedAndUpdated(_HiLo, _Histories, _PHi, _PLo, _IHi, _ILo, _DiffHi, _DiffLo, _a_PHiLo, _a_IHiLo, _a_FHiLo, _a_DHiLo)
TODO: Adds and updates High-Low related arrays from given parameters
Parameters:
_HiLo : TODO: High-Low flag
_Histories : TODO: Array size (High-Low length)
_PHi : TODO: Price Hi
_PLo : TODO: Price Lo
_IHi : TODO: Index Hi
_ILo : TODO: Index Lo
_DiffHi : TODO: Difference in High
_DiffLo : TODO: Difference in Low
_a_PHiLo : TODO: High-Low price array
_a_IHiLo : TODO: High-Low INDEX array
_a_FHiLo : TODO: High-Low flag array 1:High 2:Low
_a_DHiLo : TODO: High-Low Price Differential Array
Returns: TODO: _PHiLo price array、_IHiLo indexed array、_FHiLo flag array、_DHiLo price-matching array、
Provisional_PHiLo Provisional price、Provisional_IHiLo 暫定インデックス
High_Low(_a_PHiLo, _a_IHiLo, _a_FHiLo, _a_DHiLo, _a_Fibonacci, _Length, _Extension, _Difference, _Histories, _ShowZigZag, _ZigZagColor1, _ZigZagWidth1, _ZigZagColor2, _ZigZagWidth2, _ShowZigZagLabel, _ShowHighLowBar, _ShowTrendLine, _TrendMultiLine, _TrendStartWidth, _TrendEndWidth, _TrendIncreWidth, _TrendStartTrans, _TrendEndTrans, _TrendIncreTrans, _TrendColorMode, _TrendColor1_1, _TrendColor1_2, _TrendColor2_1, _TrendColor2_2, _ShowFibonacci1, _FibIndex1, _FibFrontMargin1, _FibBackMargin1, _FibTransparent1, _ShowFibonacci2, _FibIndex2, _FibFrontMargin2, _FibBackMargin2, _FibTransparent2, _ShowInfoTable1, _TablePosition1, _ShowInfoTable2, _TablePosition2)
TODO: Draw the contents of the High-Low array.
Parameters:
_a_PHiLo : TODO: High-Low price array
_a_IHiLo : TODO: High-Low INDEX array
_a_FHiLo : TODO: High-Low flag sequence 1:High 2:Low
_a_DHiLo : TODO: High-Low Price Differential Array
_a_Fibonacci : TODO: Fibonacci Gnar Matching
_Length : TODO: Length of confirmation
_Extension : TODO: Extension Length of extension when the difference did not open
_Difference : TODO: Difference size
_Histories : TODO: High-Low Length
_ShowZigZag : TODO: ZigZag Display
_ZigZagColor1 : TODO: Colors of ZigZag1
_ZigZagWidth1 : TODO: Width of ZigZag1
_ZigZagColor2 : TODO: Colors of ZigZag2
_ZigZagWidth2 : TODO: Width of ZigZag2
_ShowZigZagLabel : TODO: ZigZagLabel Display
_ShowHighLowBar : TODO: High-Low Bar Display
_ShowTrendLine : TODO: Trend Line Display
_TrendMultiLine : TODO: Trend Multi Line Display
_TrendStartWidth : TODO: Line width start value
_TrendEndWidth : TODO: Line width end value
_TrendIncreWidth : TODO: Line width increment value
_TrendStartTrans : TODO: Starting transmittance value
_TrendEndTrans : TODO: Transmittance End Value
_TrendIncreTrans : TODO: Increased transmittance value
_TrendColorMode : TODO: color mode
_TrendColor1_1 : TODO: Trend Color 1_1
_TrendColor1_2 : TODO: Trend Color 1_2
_TrendColor2_1 : TODO: Trend Color 2_1
_TrendColor2_2 : TODO: Trend Color 2_2
_ShowFibonacci1 : TODO: Fibonacci1 Display
_FibIndex1 : TODO: Fibonacci1 Index No.
_FibFrontMargin1 : TODO: Fibonacci1 Front margin
_FibBackMargin1 : TODO: Fibonacci1 Back Margin
_FibTransparent1 : TODO: Fibonacci1 Transmittance
_ShowFibonacci2 : TODO: Fibonacci2 Display
_FibIndex2 : TODO: Fibonacci2 Index No.
_FibFrontMargin2 : TODO: Fibonacci2 Front margin
_FibBackMargin2 : TODO: Fibonacci2 Back Margin
_FibTransparent2 : TODO: Fibonacci2 Transmittance
_ShowInfoTable1 : TODO: InfoTable1 Display
_TablePosition1 : TODO: InfoTable1 position
_ShowInfoTable2 : TODO: InfoTable2 Display
_TablePosition2 : TODO: InfoTable2 position
Returns: TODO: 無し

DateNow█ OVERVIEW
Library "DateNow"
TODO: Provide today's date based on UNIX time
█ INSPIRATIONS
Use pinescript v4 functions such as year(), month() and dayofmonth().
Use pinescript v5 function such as switch.
Export as string variables.
Not using any match function such as math.floor.
█ CREDITS
RicardoSantos
█ KNOWN ISSUES
Date for Day display incorrectly by shortage 1 value especially Year equal to or before 1984
Timezone issue. Example : I using GMT+8 for my timezone, try using other GMT will not work. Al least, GMT+2 to GMT+13 is working. GMT-0 to GMT+1 is not working, although already attempt using UTC-10 to UTC-1.
dateNow()
: DateNow
Parameters:
: : _timezone
Returns: : YYYY, YY, M, MM, MMM, DD

catchChecksLibrary "catchChecks"
Type Check for Function Builders to allow Single item to be
passed in, and determine what to do with the item, ie: need an x value?
function that allows label, line, box, float, or even a string..
check item type? string ? 'str.tonumber(_item)' can be in the same
switch as a 'line.get_price(_item, bar_index)' both outputting float
or for pulling a value from simple, array, or matrix, one function
that can switch between them. reduce overhead of many functions.
there are many ways to use this tool, the simplest may be
string/floats on one switch or grabbing colors from line/fill/label
please Share any great recipes you come up with!
typeIs(_temp, _doMeth)
Input anything..
Determine what it is.
Parameters:
_temp : (any) Matrix, Array, or Simple Item
_doMeth : (bool) True for M/A/S , false for int/float/string.. etc..
Returns: (string) Type of item checked. ('bool' .. or 'array'.. etc..)
SumOfCandlesLibrary "SumOfCandles"
This function returns sum of candlestick's body.
calc(_open, _close, _len, _malen, _usema)
Returns the sum of candlestick body.
Parameters:
_open : Source
_close : Source
_len : Period
_malen : MA Period
_usema : A flag of using MA
Returns: sum
calc(_len, _malen, _usema)
Returns the sum of candlestick body.
Parameters:
_len : Period
_malen : MA period
_usema : A flag of using MA
Returns: sum

HexLibrary "Hex"
Hex String Utility
intToHex(_n)
helper Binary half octet to hex character
Parameters:
_n : Digits to convert
fromDigits(_input, _buffer)
Digits to Hex String output
Parameters:
_input : Integer Input
_buffer : Number of 0's to pad Hex with
Returns: string output hex character value buffered to desired length (00-ff default)
calcLibrary "calc"
Library for math functions. will expand over time.
split(_sumTotal, _divideBy, _forceMinimum, _haltOnError)
Split a large number into integer sized chunks
Parameters:
_sumTotal : (int) Total numbert of items
_divideBy : (int) Groups to make
_forceMinimum : (bool) force minimum number 1/group
_haltOnError : (bool) force error if too few groups
Returns: int array of items per group

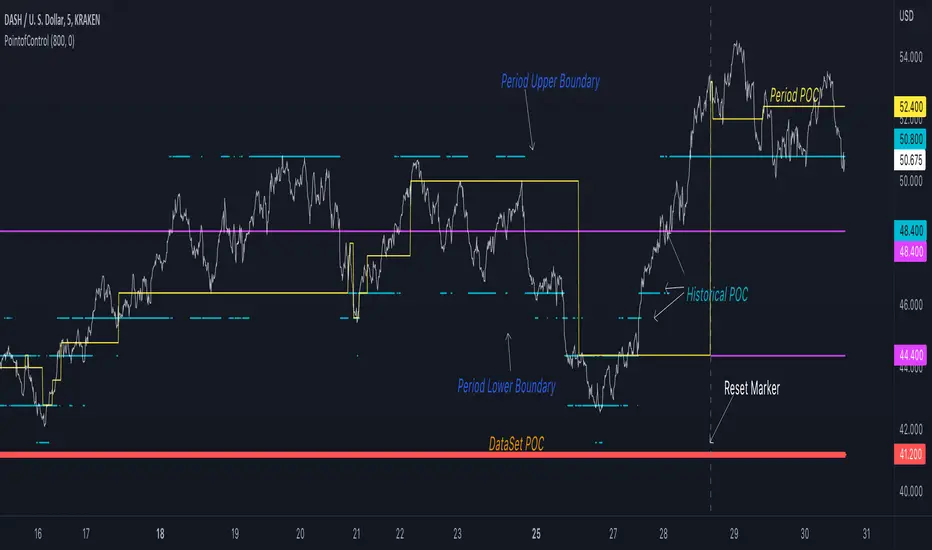
PointofControlLibrary "PointofControl"
POC_f()
The genesis of this project was to create a POC library that would be available to deliver volume profile information via pine to other scripts of indicators and strategies.
This is the indicator version of the library function.
A few things that would be unique with the built in
- it allows you to choose the kind of reset of the period, day/week or bars. This is simple enough to expand to other conditions
- it resets on bar count starting from the beginning of the data set (bar index =0) vs bars back from the end of the data set
- A 'period' in this context is the time between resets - the start of the POC until it resets (for example at the beginning of a new day or week)
- it will calculate an increment level rather than the user specifying ticks or price brackets
- it does not allow for setting the # of rows and then calculating the implied price levels
- When a period is complete it is often useful to look back at the POCs of historical periods, or extend them forward.
- This script will find the historical POCs around the current price and display them rather than extend all the historical POC lines to the right
- This script also looks across all the period POCs and identifies the master POC or what I call the Grand POC, and also the next 3 runner up POCs
There is a matching indicator to this library
FunctionDynamicTimeWarpingLibrary "FunctionDynamicTimeWarping"
"In time series analysis, dynamic time warping (DTW) is an algorithm for
measuring similarity between two temporal sequences, which may vary in
speed. For instance, similarities in walking could be detected using DTW,
even if one person was walking faster than the other, or if there were
accelerations and decelerations during the course of an observation.
DTW has been applied to temporal sequences of video, audio, and graphics
data — indeed, any data that can be turned into a linear sequence can be
analyzed with DTW. A well-known application has been automatic speech
recognition, to cope with different speaking speeds. Other applications
include speaker recognition and online signature recognition.
It can also be used in partial shape matching applications."
"Dynamic time warping is used in finance and econometrics to assess the
quality of the prediction versus real-world data."
~~ wikipedia
reference:
en.wikipedia.org
towardsdatascience.com
github.com
cost_matrix(a, b, w)
Dynamic Time Warping procedure.
Parameters:
a : array, data series.
b : array, data series.
w : int , minimum window size.
Returns: matrix optimum match matrix.
traceback(M)
perform a backtrace on the cost matrix and retrieve optimal paths and cost between arrays.
Parameters:
M : matrix, cost matrix.
Returns: tuple:
array aligned 1st array of indices.
array aligned 2nd array of indices.
float final cost.
reference:
github.com
report(a, b, w)
report ordered arrays, cost and cost matrix.
Parameters:
a : array, data series.
b : array, data series.
w : int , minimum window size.
Returns: string report.

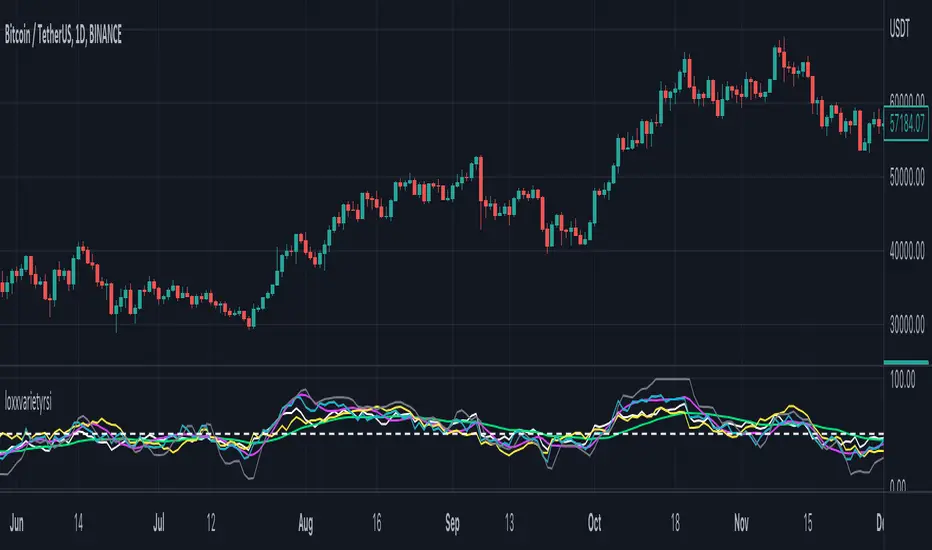
loxxvarietyrsiLibrary "loxxvarietyrsi"
7 varieties of RSI used in Loxx's indicators and strategies. Default is "rsi_rsi" which is just TV's built int ta.rsi() function.
"rsi_rsi" is regular ta.rsi()
"rsi_slo" is slowed down version of regular RSI
"rsi_rap" is ta.rsi() but uses SMA instead of RMA, this is the same as Cuttlers RSI
"rsi_har" is Michael Harris RSI, but a word of "warning". I left the Harris' rsi in the choices of rsi, but be advised that, due to the way how Harris rsi is calculated, if price filtering is used (ie: some randomness is taken away from price series) Harris RSI tends to produce results that can be "surprising" at the least in some cases. Even though Harris RSI is good when it comes to natural (semi-random) price usage, keep in mind what happens if the prices are filtered and why it happens
"rsi_rsx" is Jurik's RSX
"rsi_cut" is ta.rsi() but uses SMA instead of RMA, this is the same as Rapid RSI
"rsi_ehl" is Ehles' Smoothed RSI
rsiVariety(rsiMode, src, per)
method for returning 1 of 7 different RSI calculation outputs.
Parameters:
rsiMode : string, rsi mode, can be 1 of 7 of the following: "rsi_rsi", "rsi_slo", "rsi_rap", "rsi_har", "rsi_rsx", "rsi_cut", "rsi_ehl"; defaults to "rsi_rsi"
src : float, source, either regular source type or some other caculated value.
per : int, period lookback.
Returns: float RSI.
usage:
rsiVariety("rsi_rsi", src, per)
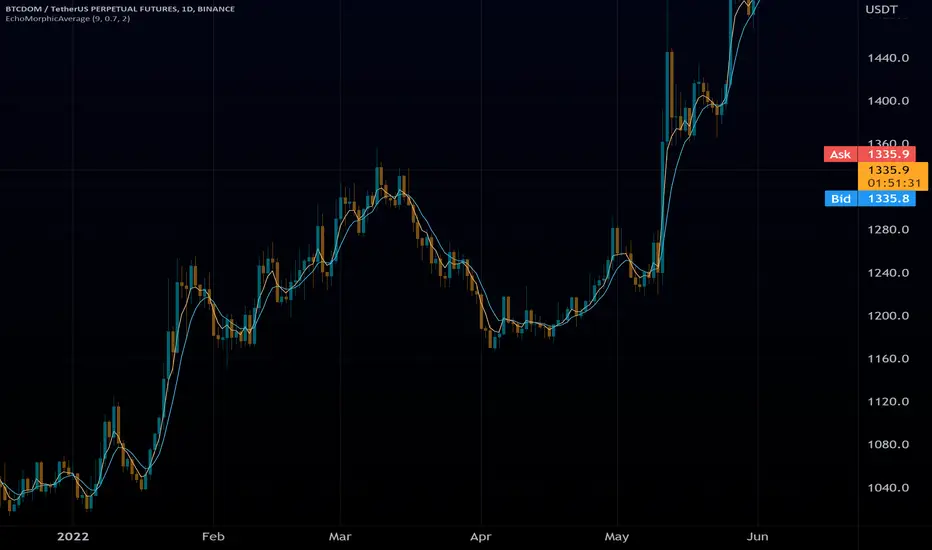
EchoMorphicAverageLibrary "EchoMorphicAverage"
Original Self Referencing Moving Average which references
it's own output agsainst itself and the incoming source to dynamically
alter smoothness and length internally per calculation cycle.
@kaigouthro
Inputs are float length series.
Contact Me for More Dynamic Float Length Indicators.
wema(src, mod, len)
Waited Echo-Morphic Average
Parameters:
src : (float) input value
mod : (float) modifier(0-1) mix of current value
len : (float) length
Returns: output processed smoothed value
wemaStack(src, mod, len)
Stacked Multipass Waited Echo-Morphic Average
Parameters:
src : (float) input value
mod : (float) modifier(0-1) mix of current value
len : (float) length
Returns: output processed smoothed value
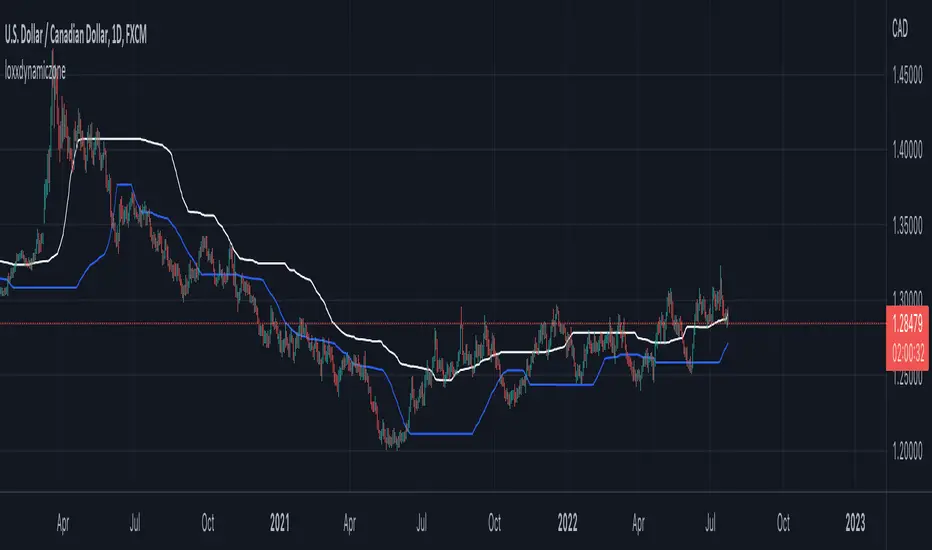
loxxdynamiczoneLibrary "loxxdynamiczone"
Dynamic Zones
Derives Leo Zamansky and David Stendahl's Dynamic Zone,
see "Stocks & Commodities V15:7 (306-310): Dynamic Zones by Leo Zamansky, Ph .D., and David Stendahl"
What are Dynamic Zones?
As explained in "Stocks & Commodities V15:7 (306-310): Dynamic Zones by Leo Zamansky, Ph .D., and David Stendahl"
Most indicators use a fixed zone for buy and sell signals. Here’ s a concept based on zones that are responsive to past levels of the indicator.
One approach to active investing employs the use of oscillators to exploit tradable market trends. This investing style follows a very simple form of logic: Enter the market only when an oscillator has moved far above or below traditional trading lev- els. However, these oscillator- driven systems lack the ability to evolve with the market because they use fixed buy and sell zones. Traders typically use one set of buy and sell zones for a bull market and substantially different zones for a bear market. And therein lies the problem.
Once traders begin introducing their market opinions into trading equations, by changing the zones, they negate the system’s mechanical nature. The objective is to have a system automatically define its own buy and sell zones and thereby profitably trade in any market — bull or bear. Dynamic zones offer a solution to the problem of fixed buy and sell zones for any oscillator-driven system.
An indicator’s extreme levels can be quantified using statistical methods. These extreme levels are calculated for a certain period and serve as the buy and sell zones for a trading system. The repetition of this statistical process for every value of the indicator creates values that become the dynamic zones. The zones are calculated in such a way that the probability of the indicator value rising above, or falling below, the dynamic zones is equal to a given probability input set by the trader.
To better understand dynamic zones, let's first describe them mathematically and then explain their use. The dynamic zones definition:
Find V such that:
For dynamic zone buy: P{X <= V}=P1
For dynamic zone sell: P{X >= V}=P2
where P1 and P2 are the probabilities set by the trader, X is the value of the indicator for the selected period and V represents the value of the dynamic zone.
The probability input P1 and P2 can be adjusted by the trader to encompass as much or as little data as the trader would like. The smaller the probability, the fewer data values above and below the dynamic zones. This translates into a wider range between the buy and sell zones. If a 10% probability is used for P1 and P2, only those data values that make up the top 10% and bottom 10% for an indicator are used in the construction of the zones. Of the values, 80% will fall between the two extreme levels. Because dynamic zone levels are penetrated so infrequently, when this happens, traders know that the market has truly moved into overbought or oversold territory.
Calculating the Dynamic Zones
The algorithm for the dynamic zones is a series of steps. First, decide the value of the lookback period t. Next, decide the value of the probability Pbuy for buy zone and value of the probability Psell for the sell zone.
For i=1, to the last lookback period, build the distribution f(x) of the price during the lookback period i. Then find the value Vi1 such that the probability of the price less than or equal to Vi1 during the lookback period i is equal to Pbuy. Find the value Vi2 such that the probability of the price greater or equal to Vi2 during the lookback period i is equal to Psell. The sequence of Vi1 for all periods gives the buy zone. The sequence of Vi2 for all periods gives the sell zone.
In the algorithm description, we have: Build the distribution f(x) of the price during the lookback period i. The distribution here is empirical namely, how many times a given value of x appeared during the lookback period. The problem is to find such x that the probability of a price being greater or equal to x will be equal to a probability selected by the user. Probability is the area under the distribution curve. The task is to find such value of x that the area under the distribution curve to the right of x will be equal to the probability selected by the user. That x is the dynamic zone.
dZone(type, src, pval, per)
method for retrieving the dynamic zone levels from input source.
Parameters:
type : string, value of either 'buy' or 'sell'.
src : float, source, either regular source type or some other caculated value.
pval : float, probability defined by extension over/under source, a number <= 1.0.
per : int, period lookback.
Returns: float dynamic zone level.
usage:
dZone("buy", close, 0.2, 70)