Market Shift Levels [ChartPrime]Market Shift Levels
This indicator detects trend shifts and visualizes key market structure turning points using Hull Moving Average logic. It highlights potential areas of support and resistance where price is likely to react, empowering traders to spot early trend transitions.
Market Shift Levels are horizontal zones that mark the moment of a directional change in market behavior. These shifts are based on crossovers between two smoothed Hull Moving Averages (HMA), allowing the indicator to detect potential reversals with minimal lag.
Once a shift is detected:
A dashed horizontal Market Shift Level is plotted at the low (for bullish shift) or high (for bearish shift) of the candle.
These levels often become key reaction points during pullbacks and trend retests.
Volume or price labels are added when price wicks into these levels, helping traders gauge the strength of rejection or acceptance.
⯁ KEY FEATURES
Uses HMA-based logic to detect when price momentum shifts.
Plots clean Market Shift Levels (MSLs) that act as dynamic support and resistance.
Automatically colors bars and candles based on the price positioning relative to levels.
Labels wick-based retests with either:
Volume data of the 3-bar cluster (default).
Price level if toggled.
⯁ HOW TO USE
Look for trend shifts where the HMA crossover triggers a new level — this marks a possible structural pivot .
Use the horizontal level as a dynamic support or resistance zone — especially when price returns with wick rejections.
Watch for volume labels near the level — higher values signal stronger rejection and potential continuation.
Combine with confluence tools like Smart Money concepts or Fibonacci levels for added edge.
⯁ EXAMPLE SETUPS
After a bullish shift, wait for price to return and wick into the level — if volume spikes and candle closes strong, it’s a retest confirmation entry .
After a bearish shift, bearish wick rejections with volume may signal short re-entry zones .
⯁ CONCLUSION
The Market Shift Levels indicator offers a visual and data-backed approach to spotting trend reversals and critical retest zones. It’s a simple yet powerful tool to structure your trades around objective, repeatable market behavior — all in real-time.
Indicatori e strategie

Volumatic Support/Resistance Levels [BigBeluga]🔵 OVERVIEW
A smart volume-powered tool for identifying key support and resistance zones—enhanced with real-time volume histogram fills and high-volume markers.
Volumatic Support/Resistance Levels detects structural levels from swing highs and lows, and wraps them in dynamic histograms that reflect the relative volume strength around those zones. It highlights the strongest price levels not just by structure—but by the weight of market participation.
🔵 CONCEPTS
Price Zones: Support and resistance levels are drawn from recent price pivots, while volume is used to visually enhance these zones with filled histograms and highlight moments of peak activity using markers.
Histogram Fill = Activity Zone: The width and intensity of each filled zone adjusts to recent volume bursts.
High-Volume Alerts: Circle markers highlight moments of volume dominance directly on the levels—revealing pressure points of support/resistance.
Clean Visual Encoding: Red = resistance zones, green = support zones, orange = high-volume bars.
🔵 FEATURES
Detects pivot-based resistance (highs) and support (lows) using a customizable range length.
Wraps these levels in volume-weighted bands that expand/contract based on percentile volume.
Color fill intensity increases with rising volume pressure, creating a live histogram feel.
When volume > user-defined threshold , the indicator adds circle markers at the top and bottom of that price level zone.
Bar coloring highlights the candles that generated this high-volume behavior (orange by default).
Adjustable settings for all thresholds and colors, so traders can dial in volume sensitivity.
🔵 HOW TO USE
Identify volume-confirmed resistance and support zones for potential reversal or breakout setups.
Focus on levels with intense histogram fill and circle markers —they indicate strong participation.
Use bar coloring to track when key activity started and align it with broader market context.
Works well in combination with order blocks, trend indicators, or liquidity zones.
Ideal for day traders, scalpers, and volume-sensitive setups.
🔵 CONCLUSION
Volumatic Support/Resistance Levels elevates traditional support and resistance logic by anchoring it in volume context. Instead of relying solely on price action, it gives traders insight into where real conviction lies—by mapping how aggressively the market defended or rejected key levels. It's a visual, reactive, and volume-conscious upgrade to your structural toolkit.

Opening Candle Indicator FinalAll previous versions were subject to bugs after review, so this final version has been released with the same features as previous versions and is error-free.
Note for those trading outside the Saudi and US markets: You can track any market with a specific trading session start and end time by selecting "Custom" from the settings menu and then setting the start and end times for the trading session.
جميع الاصدارات الماضية كانت بعد الفحص تصدر بعض الأخطاء البرمجية لذلك تم إصدار هذا الاصدار النهائي بنفس المميزات للإصدارات الماضية ولا يوجد بها أخطاء.
ملاحظة لكل من يتدوال خارج السوق السعودي والأمريكي : يمكن متابعة أي سوق له وقت بداية ونهاية جلسة تدوال وذلك عن طريق إختيار مخصص من قائمة الاعدادت ثم وضع وقت بداية ونهاية جلسة التدوال

Session HL + Candles + AMD (Nephew_Sam_)Session HL + Candles + AMD (Nephew_Sam_)
This indicator marks out intraday sessions summarized into single candles, with an additional option to mark out the HL of each session. Perfect for understanding AMD within a glance (accumulation-manipulation-distribution)
Features:
Session High/Low lines with customizable colors and labels
Optional session candles displayed on the right side of the chart
Timezone support for global traders
Customizable bull/bear candle colors
Works on timeframes up to 1 hour
Perfect for:
Identifying session liquidity levels
Tracking session ranges and breakouts
Multi-timeframe session analysis
ICT methodology traders
Settings:
Choose your timezone for accurate session detection
Toggle session candles and HL lines independently
Customize colors, line styles, and labels
Set maximum timeframe (up to 1 hour)

Boomerang Trading Indicator# Boomerang News Trading Indicator
## Overview
The Boomerang Trading Indicator is designed to identify potential reversal opportunities following major economic news releases. This indicator analyzes the initial market reaction to news events and provides visual cues for potential counter-trend trading opportunities based on Fibonacci retracement levels.
## How It Works
### News Event Detection
- Automatically detects major news release times (NFP, CPI, FOMC, etc.)
- Analyzes the first significant price movement following news releases
- Requires minimum candle size threshold to filter out weak reactions
### First Move Analysis
The indicator employs multiple analytical methods to determine the initial market direction:
**Simple Analysis (High Confidence):**
- When the news candle has ≥70% body-to-total ratio, uses straightforward bullish/bearish classification
**Advanced Analysis (Complex Cases):**
- Volume-weighted direction analysis
- Momentum and wick pattern analysis
- Market structure and gap analysis
- Weighted voting system combining all methods
### Entry Signal Generation
Based on the "boomerang" concept where markets often reverse after initial news reactions:
**For Bullish First Moves (Price Up Initially):**
- Generates SHORT entry signals when price retraces to 1.25-1.5 Fibonacci levels
- Visual: Red triangles above price bars
**For Bearish First Moves (Price Down Initially):**
- Generates LONG entry signals when price retraces to -0.25 to -0.5 Fibonacci levels
- Visual: Green triangles below price bars
## Key Features
### Visual Elements
- **Fibonacci Levels**: Displays key retracement levels based on the initial reaction range
- **Entry Zones**: Clear visual marking of optimal entry areas
- **Direction Arrows**: Shows the initial market reaction direction
- **Target Levels**: Displays profit target zones at 50% and 100% retracement levels
### Information Panel
Real-time display showing:
- Current setup status
- First move direction and body percentage
- Recommended trade direction
- Key price levels (reaction high/low)
- Profit targets with historical success rates
### Alert System
- Pre-news warnings (customizable timing)
- News event notifications
- Setup activation alerts
- Entry signal notifications
### Success Tracking
- Visual "BOOM!" animations when targets are hit
- Target 1 (50% level): ~95% historical success rate
- Target 2 (Main target): ~80% historical success rate
## Configuration Options
### Time Settings
- News release hour and minute (customizable for different events)
- Pre-news alert timing
- Setup duration (default 60 bars after news)
### Fibonacci Levels
- Adjustable retracement percentages
- Customizable target levels
- Mid-level importance weighting
### Risk Management
- Minimum reaction candle size filter
- Maximum risk point setting
- Visual risk/reward display
### Display Options
- Toggle Fibonacci level visibility
- Toggle target level display
- Toggle animation effects
- Customizable alert preferences
## Applicable News Events
This indicator is designed for high-impact economic releases:
- Non-Farm Payrolls (NFP) - First Friday, 8:30 AM ET
- Consumer Price Index (CPI) - Monthly, 8:30 AM ET
- Producer Price Index (PPI) - Monthly, 8:30 AM ET
- Gross Domestic Product (GDP) - Quarterly, 8:30 AM ET
- FOMC Interest Rate Decisions - 8 times yearly, 2:00 PM ET
## Trading Strategy Framework
### Core Principle
Markets often overreact to news initially, then reverse toward more rational price levels. This "boomerang effect" creates short-term trading opportunities.
### Entry Strategy
1. Wait for significant initial reaction (>10 points minimum)
2. Identify the initial direction using multi-factor analysis
3. Trade opposite to the initial reaction when price reaches sweet spot zones
4. Use Fibonacci retracement levels as entry triggers
### Risk Management
- Always use appropriate position sizing
- Set stop losses beyond recent swing levels
- Consider market volatility and news importance
- Monitor for setup invalidation signals
## Important Notes
### Educational Purpose
This indicator is for educational and analytical purposes. Users should:
- Thoroughly test strategies in demo environments
- Understand the risks involved in news trading
- Consider market conditions and volatility
- Use proper risk management techniques
### Market Considerations
- High volatility during news events increases both opportunity and risk
- Spreads may widen significantly during news releases
- Different brokers may have varying execution conditions
- Economic calendar timing may vary between sources
### Limitations
- Past performance does not guarantee future results
- Market conditions can change, affecting strategy effectiveness
- News events may have unexpected outcomes affecting normal patterns
- Technical analysis should be combined with fundamental analysis
## Version Information
- Compatible with TradingView Pine Script v5
- Designed for 1-minute timeframe optimal performance
- Works on major forex pairs, indices, and commodities
- Regular updates based on market condition changes
---
**Disclaimer:** This indicator is provided for educational purposes only. Trading involves substantial risk and is not suitable for all investors. Past performance is not indicative of future results. Users should conduct their own research and consider their financial situation before making trading decisions.

IDKFAIDKFA - Advanced Order Blocks & Volume Profile with Market Structure Analysis
Why IDKFA?
Named after the legendary DOOM cheat code that gives players "all weapons and full ammo," IDKFA provides traders with a comprehensive arsenal of market analysis tools. Just as the cheat code arms players with everything needed for combat, this indicator equips traders with essential market structure tools: Order Blocks, Volume Profile, LVN/HVN areas, Fibonacci retracements, and intelligent buy/sell signals - all in one unified system.
Core Features
Order Blocks Detection
Automatically identifies institutional order blocks using pivot high/low analysis
Extends blocks dynamically until price interaction occurs
Bullish blocks (demand zones) and bearish blocks (supply zones)
Customizable opacity and extend functionality
Advanced Volume Profile
Real-time volume profile calculation for multiple session types
Point of Control (POC), Value Area High (VAH), and Value Area Low (VAL)
Mode 1: Side-by-side bull/bear volume display
Mode 2: Overlapped volume display with percentage analysis
Shows buying vs selling pressure at each price level
LVN/HVN Area Detection
Low Volume Nodes (LVN): Areas below VAL where price moves quickly
High Volume Nodes (HVN): Areas above VAH with strong resistance
NPOC (Naked Point of Control): Single print areas within Value Area
Volume-based gradient coloring shows relative activity levels
Smart Fibonacci Retracements
Auto-detects trend direction for proper fibonacci orientation
Dynamic color coding: Red levels in uptrends, Gold in downtrends
Special 88.6% level turns lime green in downtrends
Key levels: 23.6%, 38.2%, 50%, 61.8%, 65%, 78.6%, 88.6%
Intelligent Signal System
Works best on higher timeframes
Identifies high-probability reversal setups at key levels
Buy signals: Large bearish rejection followed by bullish reclaim
Sell signals: Large bullish rejection followed by bearish breakdown
Signals only trigger near significant support/resistance areas
Signal Analysis & Usage Guidelines
Buy Signal Mechanics
The buy signal triggers when:
Previous candle shows significant bearish movement (minimum ATR multiplier)
Current candle reclaims a configurable percentage of the previous candle's range
Price is near a key support level (order blocks, fibonacci, volume levels)
Sell Signal Mechanics
The sell signal triggers when:
Previous candle shows significant bullish movement (minimum ATR multiplier)
Current candle rejects below a configurable percentage of the previous candle's range
Price is near a key resistance level (order blocks, fibonacci, volume levels)
When to TAKE Signals
High Probability Buy Signals:
Signal appears AT or BELOW the VAL (Value Area Low)
Signal occurs at bullish order block confluence
Price is in LVN area below VAL (momentum acceleration zone)
Signal aligns with fibonacci 61.8% or 78.6% support
Multiple session POC levels provide support confluence
Previous session's VAL acting as current support
High Probability Sell Signals:
Signal appears AT or ABOVE the VAH (Value Area High)
Signal occurs at bearish order block confluence
Price is in HVN area above VAH (heavy resistance zone)
Signal aligns with fibonacci 61.8% or 78.6% resistance
Multiple session POC levels provide resistance confluence
Previous session's VAH acting as current resistance
When to AVOID Signals
Avoid Buy Signals When:
Signal appears ABOVE the VAH (buying into resistance)
Price is in HVN red zones (high volume resistance areas)
No clear support structure below current price
Volume profile shows heavy selling pressure (high bear percentages)
Signal occurs during low-volume periods between major sessions
Multiple bearish order blocks exist below current price
Avoid Sell Signals When:
Signal appears BELOW the VAL (selling into support)
Price is in LVN green zones (momentum could continue)
No clear resistance structure above current price
Volume profile shows heavy buying pressure (high bull percentages)
Signal occurs during Asian session ranges without clear direction
Multiple bullish order blocks exist above current price
Volume Profile Context for Signals
Understanding Bull/Bear Percentages:
70%+ Bull dominance at a level = Strong support expected
70%+ Bear dominance at a level = Strong resistance expected
50/50 Split = Neutral zone, less predictable
Use percentages to gauge conviction behind moves
POC (Point of Control) Interactions:
Signals above POC in uptrend = Higher probability
Signals below POC in downtrend = Higher probability
Signals against POC bias require extra confirmation
POC often acts as magnetic level for price return
Trading Strategies
Strategy 1: VAL/VAH Bounce Strategy
Wait for price to approach VAL (support) or VAH (resistance)
Look for signal confirmation at these critical levels
Enter with tight stops beyond the Value Area
Target opposite boundary or next session's levels
Strategy 2: Order Block + Volume Confluence
Identify order block alignment with VAL/VAH
Wait for signal within the confluence zone
Enter on signal with stop beyond order block
Use LVN areas as acceleration zones for targets
Strategy 3: LVN/HVN Strategy
LVN (Green) Areas: "Go Zones" - expect quick price movement through low volume
HVN (Red) Areas: "Stop Zones" - expect resistance and potential reversals
NPOC Areas: "Fill Zones" - price often returns to fill single print gaps
Strategy 4: Multi-Session Analysis
Use Daily/Weekly for major structure context
Use 4H for intermediate levels
Use 1H for precise entry timing
Ensure all timeframes align before taking signals
Strategy 5: Fibonacci + Volume Profile
Buy signals at 61.8% or 78.6% fibonacci near VAL
Sell signals at 61.8% or 78.6% fibonacci near VAH
Use 88.6% level as final support/resistance before major moves
50% level often aligns with POC for confluence
Signal Quality Assessment
Grade A Signals (Highest Probability):
Signal at VAL/VAH with order block confluence
Fibonacci level alignment (61.8%, 78.6%)
Volume profile shows 70%+ dominance in signal direction
Multiple timeframe structure alignment
Signal occurs during high-volume sessions (London/NY)
Grade B Signals (Moderate Probability):
Signal near POC with some confluence
Fibonacci 50% or 38.2% alignment
Mixed volume profile readings (50-70% dominance)
Some timeframe alignment present
Signal during overlap sessions
Grade C Signals (Lower Probability):
Signal with minimal confluence
Weak fibonacci alignment or none
Volume profile neutral or against signal
Conflicting timeframe signals
Signal during low-volume periods
Risk Management Guidelines
Position Sizing Based on Signal Quality:
Grade A: Standard position size
Grade B: Reduced position size (50-75%)
Grade C: Minimal position size (25%) or skip entirely
Stop Loss Placement:
Beyond order block boundaries
Outside Value Area (VAL/VAH)
Below/above fibonacci confluence levels
Account for session volatility ranges
Profit Targets:
First target: Opposite VAL/VAH boundary
Second target: Next session's key levels
Final target: Major order blocks or fibonacci extensions
Credits & Attribution
Original components derived from:
Market Sessions & Volume Profile by © Leviathan (Mozilla Public License 2.0)
Volume Profile elements inspired by @LonesomeTheBlue's volume profile script
Pivot Order Blocks by TradingWolf / © MensaTrader (Mozilla Public License 2.0)
Auto Fibonacci Retracement code (public domain)
Significant enhancements and modifications include:
Advanced LVN/HVN detection and visualization
Bull/Bear percentage analysis for Mode 2/3
Comprehensive alert system with market context
Integrated buy/sell signals at key levels
Performance optimizations and extended session support
Enhanced Mode 2/3 with percentage pressure analysis
Important Disclaimers
This indicator is a technical analysis tool designed for educational purposes. It does not provide financial advice, investment recommendations, or trading signals that guarantee profits. All trading involves substantial risk of loss, and past performance does not guarantee future results. Users should conduct their own research, understand the risks involved, and consider consulting with qualified financial advisors before making trading decisions. The signals and analysis provided are based on historical price patterns and volume data, which may not predict future market movements accurately.
Best Practices
Never trade signals blindly - always consider volume profile context
Wait for confluence between multiple tools before entering
Respect the Value Area - avoid buying above VAH or selling below VAL
Use session context - Asian ranges vs London/NY breakouts
Practice proper risk management - position size based on signal quality
Understand the bigger picture - use multiple timeframes for context
Remember: Like the IDKFA cheat code, having all the tools doesn't guarantee success. The key is learning to use them together effectively and understanding when NOT to take a signal is often more important than knowing when to take one.


Squeeze & V8 Momentum ComboEMA Distance
8/21 Cross
B/S for initial change in signal
b/s yellow for price action second confirm.
x for 8/21 break

Order Blocks v2Order Blocks v2 – Smart OB Detection with Time & FVG Filters
Order Blocks v2 is an advanced tool designed to identify potential institutional footprints in the market by dynamically plotting bullish and bearish order blocks.
This indicator refines classic OB logic by combining:
Fractal-based break conditions
Time-level filtering (Power of 3)
Optional Fair Value Gap (FVG) confirmation
Real-time plotting and auto-invalidation
Perfect for traders using ICT, Smart Money, or algorithmic timing models like Hopplipka.
🧠 What the indicator does
Detects order blocks after break of bullish/bearish fractals
Supports 3-bar or 5-bar fractal structures
Allows OB detection based on close breaks or high/low breaks
Optionally confirms OBs only if followed by a Fair Value Gap within N candles
Filters OBs based on specific time levels (3, 7, 11, 14) — core anchors in many algorithmic models
Automatically deletes invalidated OBs once price closes through the zone
⚙️ How it works
The indicator:
Tracks local fractal highs/lows
Once a fractal is broken by price, it backtracks to identify the best OB candle (highest bullish or lowest bearish)
Validates the level by checking:
OB type logic (close or HL break)
Time stamp match with algorithmic time anchors (e.g. 3, 7, 11, 14 – known from the Power of 3 concept)
Optional FVG confirmation after OB
Plots OB zones as lines (body or wick-based) and removes them if invalidated by a candle close
This ensures traders see only valid, active levels — removing noise from broken or out-of-context zones.
🔧 Customization
Choose 3-bar or 5-bar fractals
OB detection type: close break or HL break
Enable/disable OBs only on times 3, 7, 11, 14 (Hopplipka style)
Optional: require nearby FVG for validation
Line style: solid, dashed, or dotted
Adjust OB length, width, color, and use body or wick for OB height
🚀 How to use it
Add the script to your chart
Choose your preferred OB detection mode and filters
Use plotted OB zones to:
Anticipate price rejections and reversals
Validate Smart Money or ICT-based entry zones
Align setups with algorithmic time sequences (3, 7, 11, 14)
Filter out invalid OBs automatically, keeping your chart clean
The tool is useful on any timeframe but performs best when combined with a liquidity-based or time-anchored trading model.
💡 What makes it original
Combines fractal logic with OB confirmation and time anchors
Implements time-based filtering inspired by Hopplipka’s interpretation of the "Power of 3"
Allows OB validation via optional FVG follow-up — rarely available in public indicators
Auto-cleans invalidated OBs to reduce clutter
Designed to reflect market structure logic used by institutions and algorithms
💬 Why it’s worth using
Order Blocks v2 simplifies one of the most nuanced parts of SMC: identifying clean and high-probability OBs.
It removes subjectivity, adds clear timing logic, and integrates optional confluence tools — like FVG.
For traders serious about algorithmic-level structure and clean setups, this tool delivers both logic and clarity.
⚠️ Important
This indicator:
Is not a signal generator or financial advice tool
Is intended for experienced traders using OB/SMC/time-based logic
Does not predict market direction — it provides visual structural levels only

Mariam 5m Scalping Breakout StrategyPurpose
A 5-minute scalping breakout strategy designed to capture fast 3-5 pip moves with high probability, using premium/discount zone filters and market bias conditions. Developed for traders seeking consistent scalps with a proven win rate above 95–98% in optimal conditions.
How It Works
The script monitors price action in 5-minute intervals, forming a 15-minute high and low range by tracking the highs and lows of the first 3 consecutive 5-minute candles starting from a custom time. In the next 3 candles, it waits for a breakout above the 15m high or below the 15m low while confirming market bias using custom equilibrium zones.
Buy signals trigger when price breaks the 15m high while in a discount zone
Sell signals trigger when price breaks the 15m low while in a premium zone
The strategy simulates trades with fixed 3-5 pip take profit and stop loss values (configurable). All trades are recorded in a table with live trade results and an automatically updated win rate, typically achieving over 90–95% accuracy in favorable market conditions.
Features
Designed exclusively for the 5-minute timeframe
Custom 15-minute high/low breakout logic
Premium, Discount, and Equilibrium zone display
Built-in backtest tracker with live trade results, statistics, and win rate
Customizable start time, take profit, and stop loss settings
Real-time alerts on breakout signals
Visual markers for trade entries and failed trades
Consistent win rate exceeding 90–95% on average when following market conditions
Usage Tips
Use strictly on 5-minute charts for accurate signal performance. Avoid during high-impact news releases.
Important: Once a trade is opened, manually set your take profit at +3 to +5 pips immediately to secure the move, as these quick scalps often hit the target within a single candle. This prevents missed exits during rapid price action.

MACD Triple divergence signalsThis script is a basic combination of several scripts that I found very useful. It's a MACD divergence on steroids. Instead of using only one plot as a source for detecting divergence, I use all of the plots.
The idea is that if more divergence signals appear—especially after a prolonged downtrend or uptrend—they can be interpreted as a strong divergence signal.
The third divergence signal is taken from the MACD signal line. It has a longer-term lookback range, which could provide a more reliable divergence signal.
The default minimum lookback range is 15, much greater than the usual value of 5. This makes it more suitable for long-term trading or for lower timeframes (lower than 4H) to reduce noise from excessive signals. For timeframes higher than 4H, the setting can be reduced to around 10 or even 5.
For the 1W (weekly) timeframe, try using a value of 3.
I also added a band to give a clear visual of overbought and oversold areas. It works similarly to Bollinger Bands (BB). You can spot when the price is ranging or when a stop-loss hunt occurs (i.e., the price breaks the band).
Please do your homework—backtest it yourself to find which timeframe suits you best. You can also tweak the settings if you find the default values too aggressive or too mild.
I’ve found that MACD is more reliable on timeframes greater than 1H. Personally, I use it on the 4H and 1D timeframes.
in bahasa:
MACD dengan 3 sinyal divergence, kalau muncul lebih banyak, bisa jadi sinyal lebih menyakinkan.
Minimum lookback range default-nya 15 agar tidak muncul terlalu banyak sinyal. 15 lebih panjang, lebih ok. Kalau main di higher timeframe seperti 1D, bisa 5-10, kalau weeky timeframe = 3.
Untuk band, cek ketika plot-nya keluar dari band, itu bisa jadi jackpot, apalagi kalau plot-nya membentuk double bottom.
Backtest sendiri, siapa tahu kalian bisa dapet setting sendiri.
MACD with upper and lower band will give you a clear visual of price movements
More divergence signals are generated and when the price breaks out of the oversold band = jackpot.

Sabina's TRAMA Crossover Color Bands💡 TRAMA Bullish - Bearish Crossover 20/50
This indicator uses two TRAMAs (Trend Regularity Adaptive Moving Averages) with lengths 20 and 50 to detect high-quality crossover points between short- and long-term price behavior signaling potential trend shifts with visual clarity.
Why TRAMA?
Unlike traditional moving averages, TRAMA dynamically adjusts its responsiveness based on market regularity. This makes it faster in trending conditions and smoother in choppy markets, reducing noise and enhancing signal reliability.
🟢 Green line: Bullish crossover (TRAMA 20 crosses above TRAMA 50)
🔴 Red line: Bearish crossover (TRAMA 20 crosses below TRAMA 50)
Perfect for trend-following strategies, scalping, or multi-timeframe confirmation

SMA/EMA Cross SignalFor short-term swing traders (such as I am) this is a simple indicator that plots 2 moving average lines of your choice, the SMA and EMA to the screen and has built in buy/sell signal when they cross.
I personally use this when price action is above the 50 SMA. The default setting (5SMA/10EMA) is what I use and has been working for me as long price action is above the 50 SMA.
Features:
1) Alerts are triggered when SMA (Signal line) and the EMA (Baseline) cross - a Long signal is called if the cross is above the EMA, a exit if the cross is below EMA
2) Signals are represented visually on the chart, below the candles is a long, above is a short.
Good luck!

Navy Seal Trading - EdgarTrader📌 Navy Seal Trading – Asia, London, and NY Sessions
This indicator clearly displays the ranges of the Asia, London, and New York sessions, featuring:
✅ Full range visualization for each session
✅ Asia session high, low, and midline, with extended projection lines for precise reaction analysis
✅ Clean, minimalistic, and professional colors to keep your chart focused
🔷 Designed for the Navy Seal Trading community, focused on precision, discipline, and professional execution in the markets.
Use it to:
✔️ Mark liquidity zones
✔️ Identify Asia manipulation ranges
✔️ Prepare executions in London and NY with clear context
💡 Remember: Clarity in your zones gives you the confidence and discipline to execute like a true Navy Seal Trader.

OG SuperTrend + RSI Option + Enhanced ORB v2 © 2025This elite-level indicator combines the precision of SuperTrend and RSI signals with a mathematically accurate Opening Range Breakout (ORB) system and Previous Day High/Low zones, providing traders with real-time directional bias and sniper-level entry guidance.
🔍 Core Features:
✅ SuperTrend + RSI Buy/Sell Signals
✅ Real-time RSI Tracker (Top Right)
✅ Clean visual BUY/SELL labels on trend shifts
✅ Mathematically accurate 5-Min & 10-Min ORB Levels
✅ Live tracking of Previous Day High/Low Zones
✅ Clean chart layout with elite color-coded precision
✅ Instant alert conditions for both bullish and bearish setups
🔔 Recommended Use:
Combine with price action, candlestick patterns, and volume spikes
Ideal for options flow, intraday scalping, and breakout strategies
Works beautifully on 1m, 5m, 15m, and 1H timeframes
📊 Settings Include:
Adjustable ATR Period & SuperTrend Multiplier
Toggle Buy/Sell Labels
Customizable RSI Length

Aetherium Institutional Market Resonance EngineAetherium Institutional Market Resonance Engine (AIMRE)
A Three-Pillar Framework for Decoding Institutional Activity
🎓 THEORETICAL FOUNDATION
The Aetherium Institutional Market Resonance Engine (AIMRE) is a multi-faceted analysis system designed to move beyond conventional indicators and decode the market's underlying structure as dictated by institutional capital flow. Its philosophy is built on a singular premise: significant market moves are preceded by a convergence of context , location , and timing . Aetherium quantifies these three dimensions through a revolutionary three-pillar architecture.
This system is not a simple combination of indicators; it is an integrated engine where each pillar's analysis feeds into a central logic core. A signal is only generated when all three pillars achieve a state of resonance, indicating a high-probability alignment between market organization, key liquidity levels, and cyclical momentum.
⚡ THE THREE-PILLAR ARCHITECTURE
1. 🌌 PILLAR I: THE COHERENCE ENGINE (THE 'CONTEXT')
Purpose: To measure the degree of organization within the market. This pillar answers the question: " Is the market acting with a unified purpose, or is it chaotic and random? "
Conceptual Framework: Institutional campaigns (accumulation or distribution) create a non-random, organized market environment. Retail-driven or directionless markets are characterized by "noise" and chaos. The Coherence Engine acts as a filter to ensure we only engage when institutional players are actively steering the market.
Formulaic Concept:
Coherence = f(Dominance, Synchronization)
Dominance Factor: Calculates the absolute difference between smoothed buying pressure (volume-weighted bullish candles) and smoothed selling pressure (volume-weighted bearish candles), normalized by total pressure. A high value signifies a clear winner between buyers and sellers.
Synchronization Factor: Measures the correlation between the streams of buying and selling pressure over the analysis window. A high positive correlation indicates synchronized, directional activity, while a negative correlation suggests choppy, conflicting action.
The final Coherence score (0-100) represents the percentage of market organization. A high score is a prerequisite for any signal, filtering out unpredictable market conditions.
2. 💎 PILLAR II: HARMONIC LIQUIDITY MATRIX (THE 'LOCATION')
Purpose: To identify and map high-impact institutional footprints. This pillar answers the question: " Where have institutions previously committed significant capital? "
Conceptual Framework: Large institutional orders leave indelible marks on the market in the form of anomalous volume spikes at specific price levels. These are not random occurrences but are areas of intense historical interest. The Harmonic Liquidity Matrix finds these footprints and consolidates them into actionable support and resistance zones called "Harmonic Nodes."
Algorithmic Process:
Footprint Identification: The engine scans the historical lookback period for candles where volume > average_volume * Institutional_Volume_Filter. This identifies statistically significant volume events.
Node Creation: A raw node is created at the mean price of the identified candle.
Dynamic Clustering: The engine uses an ATR-based proximity algorithm. If a new footprint is identified within Node_Clustering_Distance (ATR) of an existing Harmonic Node, it is merged. The node's price is volume-weighted, and its magnitude is increased. This prevents chart clutter and consolidates nearby institutional orders into a single, more significant level.
Node Decay: Nodes that are older than the Institutional_Liquidity_Scanback period are automatically removed from the chart, ensuring the analysis remains relevant to recent market dynamics.
3. 🌊 PILLAR III: CYCLICAL RESONANCE MATRIX (THE 'TIMING')
Purpose: To identify the market's dominant rhythm and its current phase. This pillar answers the question: " Is the market's immediate energy flowing up or down? "
Conceptual Framework: Markets move in waves and cycles of varying lengths. Trading in harmony with the current cyclical phase dramatically increases the probability of success. Aetherium employs a simplified wavelet analysis concept to decompose price action into short, medium, and long-term cycles.
Algorithmic Process:
Cycle Decomposition: The engine calculates three oscillators based on the difference between pairs of Exponential Moving Averages (e.g., EMA8-EMA13 for short cycle, EMA21-EMA34 for medium cycle).
Energy Measurement: The 'energy' of each cycle is determined by its recent volatility (standard deviation). The cycle with the highest energy is designated as the "Dominant Cycle."
Phase Analysis: The engine determines if the dominant cycles are in a bullish phase (rising from a trough) or a bearish phase (falling from a peak).
Cycle Sync: The highest conviction timing signals occur when multiple cycles (e.g., short and medium) are synchronized in the same direction, indicating broad-based momentum.
🔧 COMPREHENSIVE INPUT SYSTEM
Pillar I: Market Coherence Engine
Coherence Analysis Window (10-50, Default: 21): The lookback period for the Coherence Engine.
Lower Values (10-15): Highly responsive to rapid shifts in market control. Ideal for scalping but can be sensitive to noise.
Balanced (20-30): Excellent for day trading, capturing the ebb and flow of institutional sessions.
Higher Values (35-50): Smoother, more stable reading. Best for swing trading and identifying long-term institutional campaigns.
Coherence Activation Level (50-90%, Default: 70%): The minimum market organization required to enable signal generation.
Strict (80-90%): Only allows signals in extremely clear, powerful trends. Fewer, but potentially higher quality signals.
Standard (65-75%): A robust filter that effectively removes choppy conditions while capturing most valid institutional moves.
Lenient (50-60%): Allows signals in less-organized markets. Can be useful in ranging markets but may increase false signals.
Pillar II: Harmonic Liquidity Matrix
Institutional Liquidity Scanback (100-400, Default: 200): How far back the engine looks for institutional footprints.
Short (100-150): Focuses on recent institutional activity, providing highly relevant, immediate levels.
Long (300-400): Identifies major, long-term structural levels. These nodes are often extremely powerful but may be less frequent.
Institutional Volume Filter (1.3-3.0, Default: 1.8): The multiplier for detecting a volume spike.
High (2.5-3.0): Only registers climactic, undeniable institutional volume. Fewer, but more significant nodes.
Low (1.3-1.7): More sensitive, identifying smaller but still relevant institutional interest.
Node Clustering Distance (0.2-0.8 ATR, Default: 0.4): The ATR-based distance for merging nearby nodes.
High (0.6-0.8): Creates wider, more consolidated zones of liquidity.
Low (0.2-0.3): Creates more numerous, precise, and distinct levels.
Pillar III: Cyclical Resonance Matrix
Cycle Resonance Analysis (30-100, Default: 50): The lookback for determining cycle energy and dominance.
Short (30-40): Tunes the engine to faster, shorter-term market rhythms. Best for scalping.
Long (70-100): Aligns the timing component with the larger primary trend. Best for swing trading.
Institutional Signal Architecture
Signal Quality Mode (Professional, Elite, Supreme): Controls the strictness of the three-pillar confluence.
Professional: Loosest setting. May generate signals if two of the three pillars are in strong alignment. Increases signal frequency.
Elite: Balanced setting. Requires a clear, unambiguous resonance of all three pillars. The recommended default.
Supreme: Most stringent. Requires perfect alignment of all three pillars, with each pillar exhibiting exceptionally strong readings (e.g., coherence > 85%). The highest conviction signals.
Signal Spacing Control (5-25, Default: 10): The minimum bars between signals to prevent clutter and redundant alerts.
🎨 ADVANCED VISUAL SYSTEM
The visual architecture of Aetherium is designed not merely for aesthetics, but to provide an intuitive, at-a-glance understanding of the complex data being processed.
Harmonic Liquidity Nodes: The core visual element. Displayed as multi-layered, semi-transparent horizontal boxes.
Magnitude Visualization: The height and opacity of a node's "glow" are proportional to its volume magnitude. More significant nodes appear brighter and larger, instantly drawing the eye to key levels.
Color Coding: Standard nodes are blue/purple, while exceptionally high-magnitude nodes are highlighted in an accent color to denote critical importance.
🌌 Quantum Resonance Field: A dynamic background gradient that visualizes the overall market environment.
Color: Shifts from cool blues/purples (low coherence) to energetic greens/cyans (high coherence and organization), providing instant context.
Intensity: The brightness and opacity of the field are influenced by total market energy (a composite of coherence, momentum, and volume), making powerful market states visually apparent.
💎 Crystalline Lattice Matrix: A geometric web of lines projected from a central moving average.
Mathematical Basis: Levels are projected using multiples of the Golden Ratio (Phi ≈ 1.618) and the ATR. This visualizes the natural harmonic and fractal structure of the market. It is not arbitrary but is based on mathematical principles of market geometry.
🧠 Synaptic Flow Network: A dynamic particle system visualizing the engine's "thought process."
Node Density & Activation: The number of particles and their brightness/color are tied directly to the Market Coherence score. In high-coherence states, the network becomes a dense, bright, and organized web. In chaotic states, it becomes sparse and dim.
⚡ Institutional Energy Waves: Flowing sine waves that visualize market volatility and rhythm.
Amplitude & Speed: The height and speed of the waves are directly influenced by the ATR and volume, providing a feel for market energy.
📊 INSTITUTIONAL CONTROL MATRIX (DASHBOARD)
The dashboard is the central command console, providing a real-time, quantitative summary of each pillar's status.
Header: Displays the script title and version.
Coherence Engine Section:
State: Displays a qualitative assessment of market organization: ◉ PHASE LOCK (High Coherence), ◎ ORGANIZING (Moderate Coherence), or ○ CHAOTIC (Low Coherence). Color-coded for immediate recognition.
Power: Shows the precise Coherence percentage and a directional arrow (↗ or ↘) indicating if organization is increasing or decreasing.
Liquidity Matrix Section:
Nodes: Displays the total number of active Harmonic Liquidity Nodes currently being tracked.
Target: Shows the price level of the nearest significant Harmonic Node to the current price, representing the most immediate institutional level of interest.
Cycle Matrix Section:
Cycle: Identifies the currently dominant market cycle (e.g., "MID ") based on cycle energy.
Sync: Indicates the alignment of the cyclical forces: ▲ BULLISH , ▼ BEARISH , or ◆ DIVERGENT . This is the core timing confirmation.
Signal Status Section:
A unified status bar that provides the final verdict of the engine. It will display "QUANTUM SCAN" during neutral periods, or announce the tier and direction of an active signal (e.g., "◉ TIER 1 BUY ◉" ), highlighted with the appropriate color.
🎯 SIGNAL GENERATION LOGIC
Aetherium's signal logic is built on the principle of strict, non-negotiable confluence.
Condition 1: Context (Coherence Filter): The Market Coherence must be above the Coherence Activation Level. No signals can be generated in a chaotic market.
Condition 2: Location (Liquidity Node Interaction): Price must be actively interacting with a significant Harmonic Liquidity Node.
For a Buy Signal: Price must be rejecting the Node from below (testing it as support).
For a Sell Signal: Price must be rejecting the Node from above (testing it as resistance).
Condition 3: Timing (Cycle Alignment): The Cyclical Resonance Matrix must confirm that the dominant cycles are synchronized with the intended trade direction.
Signal Tiering: The Signal Quality Mode input determines how strictly these three conditions must be met. 'Supreme' mode, for example, might require not only that the conditions are met, but that the Market Coherence is exceptionally high and the interaction with the Node is accompanied by a significant volume spike.
Signal Spacing: A final filter ensures that signals are spaced by a minimum number of bars, preventing over-alerting in a single move.
🚀 ADVANCED TRADING STRATEGIES
The Primary Confluence Strategy: The intended use of the system. Wait for a Tier 1 (Elite/Supreme) or Tier 2 (Professional/Elite) signal to appear on the chart. This represents the alignment of all three pillars. Enter after the signal bar closes, with a stop-loss placed logically on the other side of the Harmonic Node that triggered the signal.
The Coherence Context Strategy: Use the Coherence Engine as a standalone market filter. When Coherence is high (>70%), favor trend-following strategies. When Coherence is low (<50%), avoid new directional trades or favor range-bound strategies. A sharp drop in Coherence during a trend can be an early warning of a trend's exhaustion.
Node-to-Node Trading: In a high-coherence environment, use the Harmonic Liquidity Nodes as both entry points and profit targets. For example, after a BUY signal is generated at one Node, the next Node above it becomes a logical first profit target.
⚖️ RESPONSIBLE USAGE AND LIMITATIONS
Decision Support, Not a Crystal Ball: Aetherium is an advanced decision-support tool. It is designed to identify high-probability conditions based on a model of institutional behavior. It does not predict the future.
Risk Management is Paramount: No indicator can replace a sound risk management plan. Always use appropriate position sizing and stop-losses. The signals provided are probabilistic, not certainties.
Past Performance Disclaimer: The market models used in this script are based on historical data. While robust, there is no guarantee that these patterns will persist in the future. Market conditions can and do change.
Not a "Set and Forget" System: The indicator performs best when its user understands the concepts behind the three pillars. Use the dashboard and visual cues to build a comprehensive view of the market before acting on a signal.
Backtesting is Essential: Before applying this tool to live trading, it is crucial to backtest and forward-test it on your preferred instruments and timeframes to understand its unique behavior and characteristics.
🔮 CONCLUSION
The Aetherium Institutional Market Resonance Engine represents a paradigm shift from single-variable analysis to a holistic, multi-pillar framework. By quantifying the abstract concepts of market context, location, and timing into a unified, logical system, it provides traders with an unprecedented lens into the mechanics of institutional market operations.
It is not merely an indicator, but a complete analytical engine designed to foster a deeper understanding of market dynamics. By focusing on the core principles of institutional order flow, Aetherium empowers traders to filter out market noise, identify key structural levels, and time their entries in harmony with the market's underlying rhythm.
"In all chaos there is a cosmos, in all disorder a secret order." - Carl Jung
— Dskyz, Trade with insight. Trade with confluence. Trade with Aetherium.

XAUUSD Scalping System [MACD + EMA + UT Bot + LinReg]//@version=5
indicator("XAUUSD Scalping System ", overlay=true)
// === INPUTS ===
fastLen = input.int(8, title="MACD Fast Length")
slowLen = input.int(21, title="MACD Slow Length")
signalLen = input.int(5, title="MACD Signal Smoothing")
linregLen = input.int(14, title="Linear Regression Length")
emaLen = input.int(21, title="EMA Length")
atrPeriod = input.int(10, title="UT Bot ATR Period")
atrMultiplier = input.float(2.0, title="UT Bot ATR Multiplier")
// === EMA ===
ema = ta.ema(close, emaLen)
plot(ema, title="21 EMA", color=color.orange, linewidth=1)
// === MACD ===
macdLine = ta.ema(close, fastLen) - ta.ema(close, slowLen)
signalLine = ta.ema(macdLine, signalLen)
hist = macdLine - signalLine
macdBull = hist > 0 and hist > hist
macdBear = hist < 0 and hist < hist
// === Linear Regression ===
linreg = ta.linreg(close, linregLen, 0)
bullCandle = close > linreg
bearCandle = close < linreg
barcolor(bullCandle ? color.new(color.green, 40) : bearCandle ? color.new(color.red, 40) : na)
// === UT Bot ===
atr = ta.atr(atrPeriod)
upperBand = close + atr * atrMultiplier
lowerBand = close - atr * atrMultiplier
var float trend = na
trend := na(trend ) ? 1 : trend
trend := close > upperBand ? 1 : close < lowerBand ? -1 : trend
buyUT = ta.crossover(trend, 0)
sellUT = ta.crossunder(trend, 0)
// === ENTRY CONDITIONS ===
longCondition = buyUT and bullCandle and macdBull and close > ema
shortCondition = sellUT and bearCandle and macdBear and close < ema
plotshape(longCondition, title="BUY Signal", location=location.belowbar, color=color.green, style=shape.labelup, text="BUY", size=size.small)
plotshape(shortCondition, title="SELL Signal", location=location.abovebar, color=color.red, style=shape.labeldown, text="SELL", size=size.small)
bgcolor(longCondition ? color.new(color.green, 85) : shortCondition ? color.new(color.red, 85) : na, title="Signal Background")
// === Alerts ===
alertcondition(longCondition, title="BUY Alert", message="XAUUSD BUY setup triggered!")
alertcondition(shortCondition, title="SELL Alert", message="XAUUSD SELL setup triggered!")

LOVE JINSwing highs and lows are calculated based on the Dow Theory. The current trend is visually depicted.
Fibonacci charts are also drawn automatically.
Swing high and low lines for the higher time frame are also displayed to assist with trading.

MTF Dashboard 9 Timeframes + Signals📊 MTF Dashboard — Multi-Timeframe Market Signal Matrix
Overview
The MTF Dashboard is an open-source Pine Script tool that enables traders to monitor key trend and momentum indicators across nine timeframes simultaneously—ranging from 1 minute to monthly—within a single unified view. This script is designed to support both discretionary and rules-based traders by improving efficiency in multi-timeframe analysis.
✅ Key Features
🔄 Multi-Timeframe Coverage
1m, 5m, 15m, 30m, 1H, 4H, 1D, 1W, 1M supported
Toggle individual timeframes on/off as per your trading style
📈 Built-in Technical Indicators
Trend Detection: Based on moving average (EMA) crossovers
Momentum Evaluation: Using Relative Strength Index (RSI)
MACD Status: Displays histogram trend
Volume Confirmation: Compares current volume to average
Confluence Rating: Optional logic combining indicator signals
🎨 Custom Dashboard Appearance
Supports light/dark chart modes
Adjustable panel positioning (Top/Bottom/Center Left/Right)
Multiple text size options
Color settings for bullish, bearish, and neutral signals
🔔 Optional Alerts
Alert conditions for confluence setups or trend changes (user must configure manually)
Use Cases
Identify trend alignment across short, medium, and long timeframes
Confirm entry or exit signals with high-confidence confluence
Detect early shifts in trend direction using EMA, RSI, MACD divergence
Quickly assess overall market sentiment in one glance
Limitations:
This script does not provide financial advice or guaranteed signals
Not intended for automatic trading or strategy backtesting
Users should interpret dashboard signals in the context of price structure and risk management
How to Use:
Add the script to your chart from your favorites
Open the settings panel:
Enable only the timeframes you want to analyze
Customize colors, position, and table layout
Optionally, right-click the script to configure alerts based on confluence or indicator changes
Technical Notes
EMA settings can be adjusted to match your trading system
Designed for visual clarity and performance with multiple timeframes enabled
Credits
This tool was developed to help the TradingView community simplify MTF analysis. Inspired by institutional-grade dashboards and adapted for manual charting use by retail traders.
Tags
#multi-timeframe #EMA #RSI #MACD #volume #confluence #dashboard #trend #momentum #open-source #pine-script #tradingview
License
Published as open-source under the TradingView community sharing model. Users are encouraged to modify, improve, and credit respectfully.

Enhanced Smoothed Heiken Ashi CandlesSmooth Heikin Ashi is a modified version of the traditional Heikin Ashi candlestick charting technique that applies additional smoothing to reduce noise and provide clearer trend signals.
Traditional Heikin Ashi Basics
Heikin Ashi (Japanese for "average bar") transforms regular candlesticks using these formulas:
Close = (Open + High + Low + Close) / 4
Open = (Previous HA Open + Previous HA Close) / 2
High = Maximum of (High, HA Open, HA Close)
Low = Minimum of (Low, HA Open, HA Close)
Smooth Heikin Ashi Enhancement
The smooth version applies moving averages to the Heikin Ashi values, typically using:
Simple Moving Average (SMA)
Exponential Moving Average (EMA)
Weighted Moving Average (WMA)
Common smoothing periods range from 5 to 21, with 14 being popular.
Key Benefits
Noise Reduction: Further filters out market noise compared to standard Heikin Ashi, making trends more apparent.
Clearer Signals: Produces smoother transitions between bullish and bearish phases, reducing false signals.
Trend Identification: Makes it easier to identify the dominant trend direction and potential reversals.
Trading Applications
Trend Following: Green/white candles indicate uptrends, red/black indicate downtrends
Entry/Exit Points: Color changes can signal potential trade entries or exits
Support/Resistance: Smoother price action helps identify key levels
Multiple Timeframe Analysis: Works well across different timeframes
The main tradeoff is that increased smoothing creates more lag, so signals may come later than with traditional Heikin Ashi or regular candlesticks.

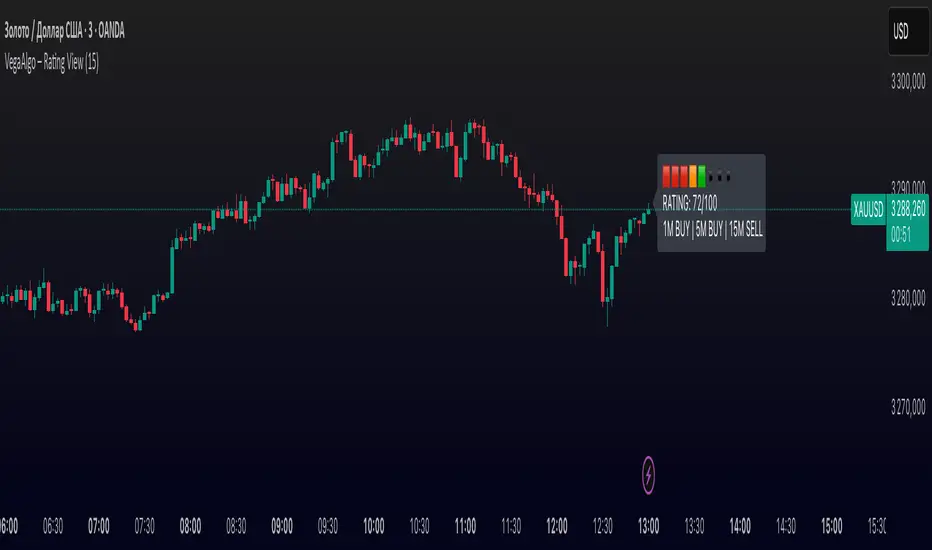
VegaAlgo – Rating ViewVegaAlgo – Rating View is a market condition analysis tool designed to evaluate the current price structure.
The indicator calculates a RATING (from 0 to 100) that reflects how clean, directional, and structured the recent price movement is. The rating is based on the number of price direction changes (from bullish to bearish candles and vice versa) within a selected period. Fewer direction changes indicate a clearer trend and result in a higher rating, while a choppy or highly volatile market leads to a lower score.
Additionally, the indicator provides directional signals on three key timeframes — 1M, 5M, and 15M, using a comparison of fast and slow moving averages. This allows traders to quickly assess the dominant trend both locally and across higher timeframes.
This script is intended for visual market analysis only and should not be considered financial advice.
PH, PD High/LowWhen applied, this script draws the previous day's high and low lines. It also plots the open price of the current 1-hour and 4-hour candles. Additionally, it displays the high and low of the previous 1-hour and 4-hour candles. Please note that 4-hour lines are shown only on the 15-minute and 4-hour charts, while 1-hour lines are shown only on the 5-minute and 1-hour charts.

Vol > 2×MA20Vol > 2×MA20 – שער-נפח לפריצות אמיתיות
הסקריפט מדגיש בר־דקה שבו נפח המסחר הנוכחי גדול פי 2 מהממוצע-נע של 20 נרות (SMA-20).
מטרתו לסנן “פריצות דקיקות” ולאמת שתנועה טכנית נתמכת בכסף אמיתי.
חישוב – trigger = volume > 2 * sma(volume, 20)
תצוגה –
עמודות נפח כחולות רגילות
קו אדום = 2 × SMA20 להצגת הסף
נקודת Alert (💠) כאשר התנאי מתקיים
AlertCondition – מובנה בשם “VolumeGate” (Once Per Bar Close מומלץ)
טיימפריים מומלץ – גרף 1-דקה או 5-דקות; מתאים גם ל-Higher TF אם משנים את המכפיל.
שימוש עיקרי – Day-Trading / סקאלפ: כניסה רק כשפריצה במחיר מלוּוָה בנפח כפול.
פרמטרים ניתנים לשינוי –
len (בר־אורך ממוצע; ברירת-מחדל = 20)
mult (מכפיל נפח; ברירת-מחדל = 2)
פשוט הוסף בקוד:
len = input.int(20, "Length")
mult = input.float(2.0, "Multiplier")
כתב-ויתור – הסקריפט מספק אינדיקציה כמותית בלבד ואינו המלצה לביצוע עסקה.
אשר נתוני Real-Time, חדשות וספרי פקודות לפני כל החלטה.
Vol > 2 × MA20 — Volume Gate for Genuine Breakouts
This script highlights any bar whose trading volume is at least twice the 20-bar simple moving average (SMA-20).
Its goal is to filter out “thin” price spikes and confirm that a breakout is backed by real buying power.
Logic – trigger = volume > 2 * sma(volume, 20)
Visuals
Regular volume columns in blue
Red line = 2 × SMA-20 (the threshold)
Diamond marker whenever the condition is met
AlertCondition – Built-in under the name “VolumeGate” (use Once Per Bar Close for best results)
Recommended time-frames – 1-minute or 5-minute charts; works on higher TFs if you adjust the multiplier.
Primary use-case – Day-trading / scalping: enter trades only when a price breakout is accompanied by at least double the average volume.
Customizable inputs
pinescript
Copy
Edit
len = input.int(20, "Length")
mult = input.float(2, "Multiplier")
Change them to suit different assets or market conditions.
Disclaimer – This script provides a quantitative signal only and is not financial advice. Always confirm with real-time data, news, and order-book depth before acting.
Ask ChatGPT
