RSI BREAKOUT SIGNALSThis BB + RSI Breakout indicator is designed to help traders identify potential buy and sell opportunities based on price movements relative to the Donchian channel (or Bollinger-type channel) and momentum conditions. It calculates the highest high and lowest low over a user-defined length to form a dynamic channel, and then it checks whether the current price breaks above the upper band (for a buy signal) or below the lower band (for a sell signal). To avoid repeated signals in a row, the indicator uses a state system: after a buy signal occurs, it will not generate another buy until a sell occurs, and vice versa. When a buy signal is triggered, it automatically calculates a take-profit price a certain percentage above the buy candle and displays this price below the candle as a “TP” label. Sell signals are displayed above the candle, and any previous TP label is cleared. The indicator updates in real time, so the signals move with the chart, giving a clear and lag-free visualization of entry points and potential profit targets.
Indicatori e strategie

ATR Trend + RSI Pullback Strategy [Profit-Focused]This strategy is designed to catch high-probability pullbacks during strong trends using a combination of ATR-based volatility filters, RSI exhaustion levels, and a trend-following entry model.
Strategy Logic
Rather than relying on lagging crossovers, this model waits for RSI to dip into oversold zones (below 40) while price remains above a long-term EMA (default: 200). This setup captures pullbacks in strong uptrends, allowing traders to enter early in a move while controlling risk dynamically.
To avoid entries during low-volatility conditions or sideways price action, it applies a minimum ATR filter. The ATR also defines both the stop-loss and take-profit levels, allowing the model to adapt to changing market conditions.
Exit logic includes:
A take-profit at 3× the ATR distance
A stop-loss at 1.5× the ATR distance
An optional early exit if RSI crosses above 70, signaling overbought conditions
Technical Details
Trend Filter: 200 EMA – must be rising and price must be above it
Entry Signal: RSI dips below 40 during an uptrend
Volatility Filter: ATR must be above a user-defined minimum threshold
Stop-Loss: 1.5× ATR below entry price
Take-Profit: 3.0× ATR above entry price
Exit on Overbought: RSI > 70 (optional early exit)
Backtest Settings
Initial Capital: $10,000
Position Sizing: 5% of equity per trade
Slippage: 1 tick
Commission: 0.075% per trade
Trade Direction: Long only
Timeframes Tested: 15m, 1H, and 30m on trending assets like BTCUSD, NAS100, ETHUSD
This model is tuned for positive P&L across trending environments and volatile markets.
Educational Use Only
This strategy is for educational purposes only and should not be considered financial advice. Past performance does not guarantee future results. Always validate performance on multiple markets and timeframes before using it in live trading.

ZH1/5-Min Opening Range Breakout Strategy with Market Biasx.com
"ZH1/5-Min Opening Range Breakout Strategy with Market Bias"


EMA Cross Strategy v5 (30 lots) (15 min candle only)- safe flip🚀 EMA Cross Strategy v5 (30 Lots) (15 min candle only)— Safe Flip Edition
Fully Automated | Fast | Reliable | Battle-tested
Welcome to a clean, powerful, and automation-friendly EMA crossover system.
This strategy is built for traders who want consistent trend-based entries without the risk of unwanted pyramiding or doubled positions.
🔥 How It Works
This strategy uses a fast EMA (10) crossing a slow EMA (20) to detect trend shifts:
Bullish Crossover → LONG (30 lots)
Bearish Crossover → SHORT (30 lots)
Every opposite signal safely flips the position by first closing the current trade, then opening a fresh position of exactly 30 lots.
No doubling.
No runaway position size.
No surprises.
Just clean, mechanical trend-following.
📈 Why This Strategy Stands Out
Unlike basic EMA crossbots, this version:
✔ Prevents unintended pyramiding
✔ Never over-allocates capital
✔ Works perfectly with webhook-based automation
✔ Produces stable, systematic entries
✔ Executes directional flips with precision
🔍 Backtest Highlights (1-Year)
(Backtests will vary by instrument/timeframe)
1,500+ trades executed
Profit factor above 1.27
Strong trend performance
Balanced long/short behavior
No margin calls
Consistent trade execution
This strategy thrives in trending markets and maintains strict discipline even in choppy conditions.
⚙️ Automation Ready
Designed for automated execution via webhook and API setups on supported platforms.
Just connect, run, and let the bot follow the rules without hesitation.
No emotions.
No overtrading.
No fear or greed.
Pure logic.

Rasta Long/Short — StrategyThe Rasta Long/Short Strategy is a visual and educational framework designed to help traders study momentum shifts that appear when a fast EMA interacts with a slower smoothed baseline.
It is not a signal service. Instead, it is a research tool that helps you observe transitions, structure, and behavior across different market conditions and smoothing contexts.
The script plots:
A primary EMA line (fast reaction wave).
A Smoothed line (your chosen smoothing method).
Color-coded fog regions showing directional bias.
Optional DNA rung connections between the two lines for structural comparison.
Together, these allow a deeper study of how momentum pushes, volatility compression, expansions, and drift emerge around fast/slow EMA interactions.
✦ Core Idea
The Rasta Long/Short mechanism studies how price behaves when the fast EMA crosses above or below a smoothed anchor.
Rather than predicting price, it reveals where transitions occur across different structures, timeframes, and smoothing techniques.
The Long/Short logic simply highlights flips in directional structure.
It is not intended for real-time signals or automated execution; it is intended for understanding market movement.
✦ Smoothing Types (Explained)
The strategy allows experimenting with several smoothing families to observe how they transform the fast EMA:
SMA (Simple Moving Average)
Averaged, slower response. Good for stability comparisons.
EMA (Exponential)
Faster reaction, more responsive, smoother behavior during momentum.
RMA (Wilder’s)
Used in RSI calculations; steady, well-balanced response.
WMA (Weighted)
More weight to recent bars; bridges SMA and EMA dynamics.
None
Raw EMA vs EMA interaction with no secondary smoothing.
Each smoothing type provides unique structural information and can lead to different interpretations.
✦ Modes of Study
Designed for multi-timeframe research:
1H / 4H — Momentum flow mapping and structural identification.
Daily / Weekly — Higher-timeframe rotations, macro structure transitions.
1–15m — Microstructure studies, noise vs trend emergence.
Use the built-in Strategy Tester to explore entry/exit context, but treat results as research, not predictive performance.
✦ Components (Visual Study Tools)
EMA Line (Fast)
Primary reactive wave. Shows fast directional shifts.
Smoothed Line (Slow)
Trend baseline / reference structure.
Fog Region
Highlights fast-vs-smoothed directional alignment.
DNA Rungs (Optional)
Structural “bridges” showing the exact relationship between waves on each bar.
Useful for studying separation, compression, and expansions.
✦ Educational Insights
This strategy helps illuminate:
How fast and slow EMAs interact dynamically.
How structure changes precede trend emergence.
Where volatility compresses before expansion.
How noise, drift, and clean reversals differ.
How different smoothers alter the interpretation of the same price data.
The goal is clarity — not prediction.
✦ How to Use
Apply to any timeframe or instrument.
Enable or disable fog depending on preferred visibility.
Use DNA rungs for close structural comparison.
Observe long/short flips as educational reference points — not signals.
Study transitions visually, then backtest using the Strategy Tester for pattern research.
✦ Disclaimer
This script is provided for educational and research purposes only.
It does not provide trading signals, financial advice, or recommendations.
Past behavior does not indicate future performance.
Always practice risk-aware study and consult qualified financial professionals when needed.
✦ Author
Michael Culpepper (mikeyc747)
Creator of the Rasta framework and related market structure studies.

Golden Cross 50/200 EMATrend-following systems are characterized by having a low win rate, yet in the right circumstances (trending markets and higher timeframes) they can deliver returns that even surpass those of systems with a high win rate.
Below, I show you a simple bullish trend-following system with clear execution rules:
System Rules
-Long entries when the 50-period EMA crosses above the 200-period EMA.
-Stop Loss (SL) placed at the lowest low of the 15 candles prior to the entry candle.
-Take Profit (TP) triggered when the 50-period EMA crosses below the 200-period EMA.
Risk Management
-Initial capital: $10,000
-Position size: 10% of capital per trade
-Commissions: 0.1% per trade
Important Note:
In the code, the stop loss is defined using the swing low (15 candles), but the position size is not adjusted based on the distance to the stop loss. In other words, 10% of the equity is risked on each trade, but the actual loss on the trade is not controlled by a maximum fixed percentage of the account — it depends entirely on the stop loss level. This means the loss on a single trade could be significantly higher or lower than 10% of the account equity, depending on volatility.
Implementing leverage or reducing position size based on volatility is something I haven’t been able to include in the code, but it would dramatically improve the system’s performance. It would fix a consistent percentage loss per trade, preventing losses from fluctuating wildly with changes in volatility.
For example, we can maintain a fixed loss percentage when volatility is low by using the following formula:
Leverage = % of SL you’re willing to risk / % volatility from entry point to stop loss
And when volatility is high and would exceed the fixed percentage we want to expose per trade (if the SL is hit), we could reduce the position size accordingly.
Practical example:
Imagine we only want to risk 15% of the position value if the stop loss is triggered on Tesla (which has high volatility), but the distance to the SL represents a potential 23.57% drop. In this case, we subtract the desired risk (15%) from the actual volatility-based loss (23.57%):
23.57% − 15% = 8.57%
Now suppose we normally use $200 per trade.
To calculate 8.57% of $200:
200 × (8.57 / 100) = $17.14
Then subtract that amount from the original position size:
$200 − $17.14 = $182.86
In summary:
If we reduce the position size to $182.86 (instead of the usual $200), even if Tesla moves 23.57% against us and hits the stop loss, we would still only lose approximately 15% of the original $200 position — exactly the risk level we defined. This way, we strictly respect our risk management rules regardless of volatility swings.
I hope this clearly explains the importance of capping losses at a fixed percentage per trade. This keeps risk under control while maintaining a consistent percentage of capital invested per trade — preventing both statistical distortion of the system and the potential destruction of the account.
About the code:
Strategy declaration:
The strategy is named 'Golden Cross 50/200 EMA'.
overlay=true means it will be drawn directly on the price chart.
initial_capital=10000 sets the initial capital to $10,000.
default_qty_type=strategy.percent_of_equity and default_qty_value=10 means each trade uses 10% of available equity.
margin_long=0 indicates no margin is used for long positions (this is likely for simulation purposes only; in real trading, margin would be required).
commission_type=strategy.commission.percent and commission_value=0.1 sets a 0.1% commission per trade.
Indicators:
Calculates two EMAs: a 50-period EMA (ema50) and a 200-period EMA (ema200).
Crossover detection:
bullCross is triggered when the 50-period EMA crosses above the 200-period EMA (Golden Cross).
bearCross is triggered when the 50-period EMA crosses below the 200-period EMA (Death Cross).
Recent swing:
swingLow calculates the lowest low of the previous 15 periods.
Stop Loss:
entryStopLoss is a variable initialized as na (not available) and is updated to the current swingLow value whenever a bullCross occurs.
Entry and exit conditions:
Entry: When a bullCross occurs, the initial stop loss is set to the current swingLow and a long position is opened.
Exit on opposite signal: When a bearCross occurs, the long position is closed.
Exit on stop loss: If the price falls below entryStopLoss while a position is open, the position is closed.
Visualization:
Both EMAs are plotted (50-period in blue, 200-period in red).
Green triangles are plotted below the bar on a bullCross, and red triangles above the bar on a bearCross.
A horizontal orange line is drawn that shows the stop loss level whenever a position is open.
Alerts:
Alerts are created for:Long entry
Exit on bearish crossover (Death Cross)
Exit triggered by stop loss
Favorable Conditions:
Tesla (45-minute timeframe)
June 29, 2010 – November 17, 2025
Total net profit: $12,458.73 or +124.59%
Maximum drawdown: $1,210.40 or 8.29%
Total trades: 107
Winning trades: 27.10% (29/107)
Profit factor: 3.141
Tesla (1-hour timeframe)
June 29, 2010 – November 17, 2025
Total net profit: $7,681.83 or +76.82%
Maximum drawdown: $993.36 or 7.30%
Total trades: 75
Winning trades: 29.33% (22/75)
Profit factor: 3.157
Netflix (45-minute timeframe)
May 23, 2002 – November 17, 2025
Total net profit: $11,380.73 or +113.81%
Maximum drawdown: $699.45 or 5.98%
Total trades: 134
Winning trades: 36.57% (49/134)
Profit factor: 2.885
Netflix (1-hour timeframe)
May 23, 2002 – November 17, 2025
Total net profit: $11,689.05 or +116.89%
Maximum drawdown: $844.55 or 7.24%
Total trades: 107
Winning trades: 37.38% (40/107)
Profit factor: 2.915
Netflix (2-hour timeframe)
May 23, 2002 – November 17, 2025
Total net profit: $12,807.71 or +128.10%
Maximum drawdown: $866.52 or 6.03%
Total trades: 56
Winning trades: 41.07% (23/56)
Profit factor: 3.891
Meta (45-minute timeframe)
May 18, 2012 – November 17, 2025
Total net profit: $2,370.02 or +23.70%
Maximum drawdown: $365.27 or 3.50%
Total trades: 83
Winning trades: 31.33% (26/83)
Profit factor: 2.419
Apple (45-minute timeframe)
January 3, 2000 – November 17, 2025
Total net profit: $8,232.55 or +80.59%
Maximum drawdown: $581.11 or 3.16%
Total trades: 140
Winning trades: 34.29% (48/140)
Profit factor: 3.009
Apple (1-hour timeframe)
January 3, 2000 – November 17, 2025
Total net profit: $9,685.89 or +94.93%
Maximum drawdown: $374.69 or 2.26%
Total trades: 118
Winning trades: 35.59% (42/118)
Profit factor: 3.463
Apple (2-hour timeframe)
January 3, 2000 – November 17, 2025
Total net profit: $8,001.28 or +77.99%
Maximum drawdown: $755.84 or 7.56%
Total trades: 67
Winning trades: 41.79% (28/67)
Profit factor: 3.825
NVDA (15-minute timeframe)
January 3, 2000 – November 17, 2025
Total net profit: $11,828.56 or +118.29%
Maximum drawdown: $1,275.43 or 8.06%
Total trades: 466
Winning trades: 28.11% (131/466)
Profit factor: 2.033
NVDA (30-minute timeframe)
January 3, 2000 – November 17, 2025
Total net profit: $12,203.21 or +122.03%
Maximum drawdown: $1,661.86 or 10.35%
Total trades: 245
Winning trades: 28.98% (71/245)
Profit factor: 2.291
NVDA (45-minute timeframe)
January 3, 2000 – November 17, 2025
Total net profit: $16,793.48 or +167.93%
Maximum drawdown: $1,458.81 or 8.40%
Total trades: 172
Winning trades: 33.14% (57/172)
Profit factor: 2.927

Faraz Perfect Structure XL / XS (Trend-Filtered)Faraz’s Perfect Structure XL/XS identifies premium trend continuation and reversal setups using a three-filter system:
structural breakouts using dynamic swing-based support/resistance,
trend confirmation via 200-EMA slope,
momentum validation through RSI and MACD.
Signals only trigger when all factors align, eliminating noise, chop, and false signals.
Designed for traders who want clean, high-probability long (XL) and short (XS) entries.

XiaoJiu_RSI_5m_Drop1_DCA✔ Automatic buy when RSI < 30
✔ Automatic averaging down for every 1 point drop in RSI (maximum 21 times)
✔ Automatic liquidation when RSI > 70
✔ 28U per average averaging down
✔ Automatically calculates weighted average cost
✔ Automatically displays actual profit
✔ Can be tested on any coin and at any time
✔ Complete DCA model

[PickMyTrade] Trendline Strategy# PickMyTrade Advanced Trend Following Strategy for Long Positions | Automated Trading Indicator
**Optimize Your Trading with PickMyTrade's Professional Trend Strategy - Auto-Execute Trades with Precision**
---
## Table of Contents
1. (#overview)
2. (#why-this-strategy-makes-money)
3. (#key-features)
4. (#how-it-works)
5. (#strategy-settings--configuration)
6. (#pickmytrade-integration)
7. (#advanced-features)
8. (#risk-management)
9. (#best-practices)
10. (#performance-optimization)
11. (#getting-started)
12. (#faq)
---
## Overview
The **PickMyTrade Advanced Trend Following Strategy** is a sophisticated, open-source Pine Script indicator designed for traders seeking consistent profits through trend-based long positions. This powerful algorithm identifies high-probability entry points by detecting valid trendlines with multiple touch confirmations, ensuring you only enter trades when the trend is strongly established.
### What Makes This Strategy Unique?
- **Multi-Trendline Detection**: Simultaneously tracks multiple downtrend breakouts for increased trading opportunities
- **Intelligent Entry Validation**: Requires multiple price touches (configurable) to confirm trendline validity
- **Flexible Take Profit Methods**: Choose from Risk/Reward Ratio, Lookback Candles, or Fibonacci-based exits
- **Automated Risk Management**: Built-in position sizing based on dollar risk per trade
- **PickMyTrade Ready**: Seamlessly integrate with PickMyTrade for fully automated trade execution
**Perfect for**: Swing traders, trend followers, futures traders, and anyone using PickMyTrade for automated trading execution.
---
## Why This Strategy Makes Money
### 1. **Breakout Trading Edge**
The strategy profits by identifying when price breaks above established downtrend resistance lines. These breakouts often signal:
- Shift in market sentiment from bearish to bullish
- Strong buying momentum entering the market
- High probability of continued upward movement
### 2. **Trend Confirmation Filter**
Unlike simple breakout strategies, this requires **multiple touches** (default: 3) on the trendline before considering it valid. This eliminates:
- False breakouts from weak trendlines
- Choppy, sideways markets with no clear trend
- Low-quality setups that lead to losses
### 3. **Dynamic Risk-Reward Optimization**
The strategy automatically calculates:
- **Optimal position sizing** based on your risk tolerance ($100 default)
- **Stop loss placement** using recent pivot lows (not arbitrary levels)
- **Take profit targets** using either R:R ratios (1.5:1 default) or Fibonacci extensions
**Expected Profitability**: With proper settings, traders typically achieve:
- Win rate: 45-60% (depending on market conditions)
- Risk/Reward: 1.5:1 to 2.5:1 (configurable)
- Monthly returns: 5-15% (varies by market and risk settings)
### 4. **Fibonacci Profit Scaling**
The advanced Fibonacci mode allows you to:
- Take partial profits at multiple levels (0.618, 1.0, 1.312, 1.618)
- Lock in gains while letting winners run
- Maximize profits during strong trending moves
---
## Key Features
### Trend Detection & Validation
✅ **Dynamic Trendline Drawing**: Automatically identifies and extends downtrend resistance lines
✅ **Touch Validation**: Configurable number of touches (1-10) to confirm trendline strength
✅ **Valid Percentage Buffer**: Allows minor price deviations (default 0.1%) for more realistic trendlines
✅ **Pivot-Based Validation**: Optional extra filter using smaller pivot points for precision
### Position Management
✅ **Multi-Position Support**: Trade up to 1000 positions simultaneously (pyramiding)
✅ **Single or Multi-Trend Mode**: Track one primary trend or multiple concurrent trends
✅ **Dollar-Based Position Sizing**: Risk fixed dollar amount per trade (not percentage of account)
✅ **Automatic Quantity Calculation**: Determines optimal contract size based on risk and stop distance
### Take Profit Methods (3 Options)
#### 1. **Risk/Reward Ratio** (Recommended for Beginners)
- Set desired R:R (default 1.5:1)
- Simple, consistent profit targets
- Works well in trending markets
#### 2. **Lookback Candles** (For Swing Traders)
- Exits when price makes new low over X candles (default 10)
- Adapts to market volatility
- Best for capturing extended moves
#### 3. **Fibonacci Extensions** (For Advanced Traders)
- Up to 4 profit targets: 61.8%, 100%, 131.2%, 161.8%
- Automatically scales out of positions
- Maximizes gains during strong trends
### Stop Loss Options
✅ **Pivot-Based Stop Loss**: Uses recent pivot lows for logical stop placement
✅ **Buffer/Offset**: Add extra distance (in ticks) below pivot for safety
✅ **Trailing Stop**: Optional feature to lock in profits as trade moves in your favor
✅ **Enable/Disable Toggle**: Full control over stop loss activation
### Session Control
✅ **Time-Based Trading**: Limit trades to specific hours (e.g., 9:00 AM - 6:00 PM)
✅ **Auto-Close at Session End**: Automatically closes all positions outside trading hours
✅ **Works on All Timeframes**: Intraday and higher timeframes supported
---
## How It Works
### Step-by-Step Trade Logic
#### 1. **Trendline Identification**
The strategy scans for pivot highs that are **lower** than the previous pivot high, indicating a downtrend. It then:
- Draws a trendline connecting these pivot points
- Extends the line forward to current price
- Validates the line by checking how many candles touched it
#### 2. **Entry Trigger**
A long position is entered when:
- Price closes **above** the validated trendline (breakout)
- Session time filter is met (if enabled)
- Maximum position limit not exceeded
- Sufficient risk capital available for position sizing
#### 3. **Stop Loss Calculation**
The strategy looks backward to find the most recent pivot low that is:
- Below current price
- A logical support level
- Applies optional buffer/offset for safety
- Uses this level to calculate position size
#### 4. **Take Profit Execution**
Depending on your selected method:
- **R:R Mode**: Calculates TP as entry + (entry - SL) × ratio
- **Lookback Mode**: Exits when price makes new low over specified candles
- **Fibonacci Mode**: Sets 4 profit targets based on Fibonacci extensions from swing high to stop loss
#### 5. **Trade Management**
Once in position:
- Monitors stop loss for risk protection
- Tracks take profit levels for exit signals
- Optional trailing stop to lock in profits
- Closes all trades at session end (if enabled)
---
## Strategy Settings & Configuration
### Trendline Settings
| Parameter | Default | Range | Description | Impact on Trading |
|-----------|---------|-------|-------------|-------------------|
| **Pivot Length For Trend** | 15 | 5-50 | Bars to left/right for pivot detection | Lower = More signals (noisier), Higher = Fewer signals (stronger trends) |
| **Touch Number** | 3 | 2-10 | Required touches to validate trendline | Lower = More trades (less reliable), Higher = Fewer trades (more reliable) |
| **Valid Percentage** | 0.1% | 0-5% | Allowed deviation from trendline | Higher = More lenient validation, more trades |
| **Enable Pivot To Valid** | False | True/False | Extra validation using smaller pivots | True = Stricter filtering, fewer but higher quality trades |
| **Pivot Length For Valid** | 5 | 3-15 | Pivot length for extra validation | Smaller = More precise validation |
**Recommendation**: Start with defaults. In choppy markets, increase touch number to 4-5. In strongly trending markets, reduce to 2.
### Position Management
| Parameter | Default | Range | Description | Impact on Trading |
|-----------|---------|-------|-------------|-------------------|
| **Enable Multi Trend** | True | True/False | Track multiple trendlines simultaneously | True = More opportunities, False = One trade at a time |
| **Position Number** | 1 | 1-1000 | Maximum concurrent positions | Higher = More capital deployed, more risk |
| **Risk Amount** | $100 | $10-$10,000 | Dollar risk per trade | Higher = Larger positions, more P&L per trade |
| **Enable Default Contract Size** | False | True/False | Use 1 contract if calculated size ≤1 | True = Always enter (even micro accounts) |
**Money Management Tip**: Risk 1-2% of your account per trade. If you have $10,000, set Risk Amount to $100-$200.
### Take Profit Settings
| Parameter | Default | Options | Description | Best For |
|-----------|---------|---------|-------------|----------|
| **Set TP Method** | RiskAwardRatio | RiskAwardRatio / LookBackCandles / Fibonacci | Choose exit strategy | Beginners: R:R, Swing: Lookback, Advanced: Fib |
| **Risk Award Ratio** | 1.5 | 1.0-5.0 | Target profit as multiple of risk | Higher = Bigger wins but lower win rate |
| **Look Back Candles** | 10 | 5-50 | Exit when price makes new low over X bars | Smaller = Quicker exits, Larger = Let winners run |
| **Source for TP** | Close | Close / High-Low | Use close or high/low for exit signals | Close = More conservative |
**Profitability Guide**:
- **Conservative**: R:R = 1.5, Lookback = 10
- **Balanced**: R:R = 2.0, Lookback = 15
- **Aggressive**: R:R = 2.5, Fibonacci mode with 1.618 target
### Stop Loss Settings
| Parameter | Default | Range | Description | Impact on Trading |
|-----------|---------|-------|-------------|-------------------|
| **Turn On/Off SL** | True | True/False | Enable stop loss | **Always use True** for risk protection |
| **Pivot Length for SL** | 3 | 2-10 | Pivot length for stop placement | Smaller = Tighter stops, Larger = Wider stops |
| **Buffer For SL** | 0.0 | 0-50 | Extra distance below pivot (ticks) | Higher = Safer but lower R:R |
| **Turn On/Off Trailing Stop** | False | True/False | Lock in profits as trade moves up | True = Protects profits, may exit early |
**Risk Management Rule**: Never disable stop loss. Use buffer in volatile markets (5-10 ticks).
### Fibonacci Settings (When TP Method = Fibonacci)
| Parameter | Default | Description | Profit Target |
|-----------|---------|-------------|---------------|
| **Fibonacci Level 1** | 0.618 | First profit target | 61.8% of swing range |
| **Fibonacci Level 2** | 1.0 | Second profit target | 100% of swing range |
| **Fibonacci Level 3** | 1.312 | Third profit target | 131.2% extension |
| **Fibonacci Level 4** | 1.618 | Fourth profit target | 161.8% extension |
| **Pivot Length for Fibonacci** | 15 | Pivot to find swing high | Higher = Bigger swings, wider targets |
**Scaling Strategy**: Close 25% at each Fibonacci level to lock in profits progressively.
### Session Settings
| Parameter | Default | Description | Use Case |
|-----------|---------|-------------|----------|
| **Enable Session** | False | Activate time filter | Day trading specific hours |
| **Session Time** | 0900-1800 | Trading hours window | Avoid overnight risk |
**Day Trader Setup**: Enable session = True, Set hours to 9:30-16:00 (US market hours)
---
## PickMyTrade Integration
### Automate Your Trading with PickMyTrade
This strategy is **fully compatible with PickMyTrade**, the leading automation platform for TradingView strategies. Connect your broker account and let PickMyTrade execute trades automatically based on this strategy's signals.
### Why Use PickMyTrade?
✅ **Hands-Free Trading**: Never miss a signal, even while sleeping
✅ **Multi-Broker Support**: Works with Tradovate, NinjaTrader, TradeStation, and more
✅ **Instant Execution**: Alerts trigger trades in milliseconds
✅ **Risk Management**: Built-in position sizing and stop loss handling
✅ **Mobile Monitoring**: Track trades from your phone
**Boom!** Your strategy is now fully automated. Every breakout signal will automatically execute a trade through your broker.
### PickMyTrade-Specific Features
- **Dynamic Position Sizing**: The strategy calculates quantity based on your risk amount
- **Automatic Stop Loss**: Pivot-based stops are sent to your broker automatically
- **Take Profit Orders**: R:R and Fibonacci targets create limit orders
- **Session Management**: Trades only during specified hours
- **Multi-Position Support**: Handle multiple concurrent trades seamlessly
**Pro Tip**: Start with paper trading or a demo account to test the automation before going live.
---
## Advanced Features
### 1. Multi-Trendline Mode (Enable Multi Trend = True)
**What It Does**: Tracks up to 1000 trendlines simultaneously, entering positions as each one breaks out.
**Benefits**:
- More trading opportunities
- Diversifies entry points across multiple trends
- Catches every valid breakout in trending markets
**When to Use**:
- Strong trending markets (crypto bull runs, index rallies)
- Longer timeframes (4H, Daily)
- When you want maximum market exposure
**Caution**: Can enter many positions quickly. Set appropriate Position Number limit and Risk Amount.
### 2. Single Trendline Mode (Enable Multi Trend = False)
**What It Does**: Focuses on one primary trendline at a time.
**Benefits**:
- Cleaner, simpler execution
- Easier to monitor and manage
- Better for beginners
- Lower capital requirements
**When to Use**:
- Choppy or ranging markets
- Smaller accounts
- When you prefer focused, quality over quantity trades
### 3. Fibonacci Profit Scaling
**How It Works**:
1. At entry, the strategy finds the most recent swing high above current price
2. Calculates the range from swing high to stop loss
3. Projects 4 Fibonacci extensions: 61.8%, 100%, 131.2%, 161.8%
4. Exits when price reaches each level, then pulls back below it
**Profit Maximization Strategy**:
- Close 25% of position at each Fibonacci level
- Let remaining portion target higher levels
- Capture both quick profits and extended moves
**Example Trade**:
- Entry: $100
- Stop Loss: $95 (risk = $5)
- Swing High: $110
- Range: $110 - $95 = $15
Fibonacci Targets:
- 61.8% = $95 + ($15 × 0.618) = $104.27 (+4.27%)
- 100% = $95 + ($15 × 1.0) = $110 (+10%)
- 131.2% = $95 + ($15 × 1.312) = $114.68 (+14.68%)
- 161.8% = $95 + ($15 × 1.618) = $119.27 (+19.27%)
**Result**: Even if only first two targets hit, you lock in +7% average gain vs. -5% risk = 1.4:1 R:R
### 4. Trailing Stop Loss
**What It Does**: After entry, if a new pivot low forms **above** your initial stop, the strategy moves your stop up to that level.
**Benefits**:
- Locks in profits as trade moves in your favor
- Reduces risk to breakeven or better
- Captures strong momentum moves
**Drawback**: May exit profitable trades earlier during normal pullbacks.
**Best Practice**: Use in strongly trending markets. Disable in choppy conditions.
### 5. Pivot Validation Filter
**What It Does**: Adds extra requirement that a small pivot high must exist between the two trendline pivot points.
**Benefits**:
- Ensures trendline is a "true" resistance
- Filters out random lines connecting arbitrary highs
- Increases trade quality
**When to Enable**:
- High-volatility markets with many false breakouts
- Lower timeframes (5min, 15min) where noise is common
- When win rate is too low with default settings
**Tradeoff**: Fewer signals, but higher win rate.
### 6. Session-Based Trading
**What It Does**: Only enters trades during specified hours. Auto-closes all positions outside session.
**Use Cases**:
- **Day Trading**: 9:30 AM - 4:00 PM (avoid overnight gaps)
- **European Hours**: 8:00 AM - 5:00 PM CET (trade London session)
- **Crypto**: 24/7 trading or focus on US hours for liquidity
**Risk Management**: Prevents holding positions through high-impact news events or market closes.
---
## Risk Management
### Position Sizing Formula
The strategy uses **fixed dollar risk** position sizing:
```
Position Size = Risk Amount ÷ (Entry Price - Stop Loss) ÷ Point Value
```
**Example** (ES Futures):
- Risk Amount: $100
- Entry: 4500
- Stop Loss: 4490
- Risk per contract: 10 points × $50/point = $500
- Position Size: $100 ÷ $500 = 0.2 contracts → Rounds to 0 (no trade)
If `Enable Default Contract Size = True`, it would trade 1 contract instead.
### Risk Per Trade Recommendations
| Account Size | Conservative (1%) | Moderate (2%) | Aggressive (3%) |
|--------------|-------------------|---------------|-----------------|
| $5,000 | $50 | $100 | $150 |
| $10,000 | $100 | $200 | $300 |
| $25,000 | $250 | $500 | $750 |
| $50,000 | $500 | $1,000 | $1,500 |
**Golden Rule**: Never risk more than 2% per trade. Even with 10 losses in a row, you'd only be down 20%.
### Maximum Drawdown Protection
**Multi-Position Risk**:
- If Position Number = 5 and Risk Amount = $100
- Maximum simultaneous risk = 5 × $100 = $500
- Ensure this is ≤ 5% of your total account
**Daily Loss Limit**:
- Set a mental stop: "If I lose $X today, I stop trading"
- Typical limit: 3-5% of account per day
- Prevents revenge trading and emotional decisions
### Stop Loss Best Practices
1. **Always Use Stops**: Never disable stop loss (enabledSL should always be True)
2. **Buffer in Volatile Markets**: Add 5-10 tick buffer to avoid stop hunts
3. **Respect Your Stops**: Don't manually override or move stops further away
4. **Wide Stops = Smaller Size**: If stop is far from entry, strategy automatically reduces position size
---
## Best Practices
### Optimal Timeframes
| Timeframe | Trading Style | Position Number | Risk/Reward | Win Rate Expectation |
|-----------|---------------|-----------------|-------------|----------------------|
| 5-15 min | Scalping | 1-2 | 1.5:1 | 50-55% |
| 30 min - 1H | Intraday | 2-3 | 2:1 | 55-60% |
| 4H | Swing Trading | 3-5 | 2.5:1 | 60-65% |
| Daily | Position Trading | 1-2 | 3:1 | 65-70% |
**Recommendation**: Start with 1H or 4H charts for best balance of signals and reliability.
### Ideal Market Conditions
**Best Performance**:
- Strong trending markets (bull runs, clear directional bias)
- After consolidation breakouts
- Post-earnings or news catalysts driving sustained moves
- Liquid markets with tight spreads
**Avoid or Reduce Risk**:
- Choppy, sideways-ranging markets
- Low-volume periods (holidays, overnight sessions)
- High-impact news events (FOMC, NFP, earnings)
- Extreme volatility (VIX > 30)
### Backtesting Recommendations
Before going live:
1. **Run 6-12 Months of Historical Data**: Ensure strategy performed well across different market regimes
2. **Check Key Metrics**:
- Win Rate: Should be 45-65% depending on R:R
- Profit Factor: Aim for > 1.5
- Max Drawdown: Should be < 20% of starting capital
- Average Win/Loss Ratio: Should match your R:R setting
3. **Stress Test**: Test during known volatile periods (March 2020, Jan 2022, etc.)
4. **Forward Test**: Run on demo account for 1 month before real money
### Parameter Optimization
**Don't Over-Optimize!** Avoid curve-fitting to past data. Instead:
1. **Start with Defaults**: Use recommended settings first
2. **Change One Parameter at a Time**: Isolate what improves performance
3. **Test on Out-of-Sample Data**: If settings work on 2023 data, test on 2024 data
4. **Focus on Robustness**: Settings that work across multiple markets/timeframes are best
**Red Flags**:
- Strategy works perfectly on historical data but fails live (over-fitting)
- Tiny changes in parameters dramatically change results (unstable)
- Requires exact values (e.g., pivot length must be exactly 17) (curve-fitted)
---
## Performance Optimization
### How to Increase Profitability
#### 1. Optimize Risk/Reward Ratio
- **Current**: 1.5:1 (default)
- **Test**: 2:1, 2.5:1, 3:1
- **Impact**: Higher R:R = bigger wins but lower win rate
- **Sweet Spot**: Usually 2:1 to 2.5:1 for trend strategies
#### 2. Filter by Market Regime
Add a trend filter to only trade in bull markets:
- Use 200-period SMA: Only take longs when price > SMA(200)
- Use ADX: Only trade when ADX > 25 (strong trend)
- **Impact**: Fewer trades, but much higher win rate
#### 3. Tighten Entry Requirements
- Increase Touch Number from 3 to 4-5
- Enable Pivot To Valid = True
- **Impact**: Fewer but higher quality signals
#### 4. Use Fibonacci Scaling
- Switch from R:R to Fibonacci method
- Take partial profits at each level
- **Impact**: Better average wins, smoother equity curve
#### 5. Add Volume Confirmation
Enhance entry signal by requiring:
- Volume > Average Volume (indicates strong breakout)
- Can add this as custom filter in Pine Script
### How to Reduce Risk
#### 1. Lower Position Number
- Default: 1 position at a time
- Multi-trend: Limit to 2-3 max
- **Impact**: Less simultaneous exposure, lower drawdowns
#### 2. Reduce Risk Amount
- Start with $50 per trade (0.5% of $10k account)
- Gradually increase as you gain confidence
- **Impact**: Smaller positions, slower growth but safer
#### 3. Use Tighter Stops with Buffer
- Set Pivot Length for SL = 2 (closer stop)
- Add Buffer = 5-10 ticks (avoid premature stop-outs)
- **Impact**: Smaller losses, but may get stopped out more often
#### 4. Enable Session Filter
- Only trade during liquid hours
- Avoid overnight holds
- **Impact**: No gap risk, more predictable fills
---
## Getting Started
### Quick Start Guide (5 Minutes)
1. **Copy the Strategy Code**
- Open the `.txt` file provided
- Copy all code to clipboard
2. **Add to TradingView**
- Go to TradingView Pine Editor
- Paste code
- Click "Save" → Name it "PickMyTrade Trend Strategy"
- Click "Add to Chart"
3. **Configure Basic Settings**
- Open strategy settings (gear icon)
- Set Risk Amount = 1% of your account ($100 for $10k)
- Set Position Number = 1 (for beginners)
- Keep all other defaults
4. **Backtest on Your Market**
- Choose your instrument (ES, NQ, AAPL, BTC, etc.)
- Select timeframe (start with 1H or 4H)
- Review performance metrics in Strategy Tester tab
5. **Optimize (Optional)**
- Adjust Touch Number (2-5) to balance signals vs. quality
- Try different TP methods (R:R vs. Fibonacci)
- Test on multiple timeframes
6. **Go Live**
- If backtest looks good, start with small position size
- Monitor first 5-10 trades closely
- Scale up once confident in execution
### Integration with PickMyTrade (10 Minutes)
1. **Sign Up for PickMyTrade**
- Visit (pickmytrade.trade)
- Create free account
- Connect your broker (Tradovate, NinjaTrader, etc.)
2. **Create TradingView Alert**
- Set condition to strategy name
- Add PickMyTrade webhook URL
- Enable alert
3. **Test with Demo Account**
- Let it run for a few days
- Verify trades execute correctly
- Check fills, stops, and targets
4. **Switch to Live Account**
- Update account ID to live account
- Start with minimum position size
- Monitor closely for first week
---
### Technical Questions
**Q: What does "Touch Number = 3" mean?**
A: The trendline must have at least 3 candles touching or nearly touching it to be considered valid.
**Q: Why am I getting no trades?**
A: Trendline requirements may be too strict. Try:
- Reduce Touch Number to 2
- Increase Valid Percentage to 0.5%
- Disable Pivot To Valid
- Check if price is in a trend (strategy won't trade sideways markets)
**Q: Why is my position size 0?**
A: Risk Amount is too small for the stop distance. Either:
- Increase Risk Amount
- Enable Default Contract Size = True (will use 1 contract minimum)
- Use tighter stops (lower Pivot Length for SL)
**Q: Can I trade both long and short?**
A: Current code is long-only. You'd need to duplicate the logic for short trades (detect uptrend breakdowns).
**Q: How do I change from TradingView strategy to indicator?**
A: Change line 5 from `strategy(...)` to `indicator(...)`. Replace `strategy.entry()` and `strategy.exit()` with `alert()` calls.
### Risk Management Questions
**Q: What's the maximum drawdown I should expect?**
A: Typically 10-20% depending on settings. If experiencing > 25%, reduce position size or tighten filters.
**Q: Should I risk more to make more money?**
A: No. Risking 2% vs. 5% per trade doesn't triple your profits—it triples your risk of blowing up. Stick to 1-2% per trade.
**Q: What if I hit 5 losses in a row?**
A: Normal. Even with 60% win rate, losing streaks happen. Don't increase position size to "win it back." Stick to your risk plan.
**Q: Do I need to watch the screen all day?**
A: No, especially with PickMyTrade automation. Check positions 1-2 times per day. Overtrading kills profits.
---
## Disclaimer
**Important Risk Disclosure**:
Trading futures, stocks, forex, and cryptocurrencies involves substantial risk of loss and is not suitable for all investors. Past performance is not indicative of future results. The PickMyTrade Advanced Trend Following Strategy is provided for **educational purposes only** and should not be considered financial advice.
**Key Risks**:
- You can lose more than your initial investment
- Backtested results may not reflect live trading performance
- Market conditions change; no strategy works forever
- Automation errors can occur (connectivity, bugs, etc.)
**Before Trading**:
- Consult a licensed financial advisor
- Fully understand the strategy logic
- Test on demo account for at least 1 month
- Only risk capital you can afford to lose
- Start with minimum position sizes
**PickMyTrade**:
This strategy is compatible with PickMyTrade but is not officially endorsed by PickMyTrade. The author is not affiliated with PickMyTrade. For PickMyTrade support, visit their official website.
**License**: This strategy is open-source under Attribution-NonCommercial-ShareAlike 4.0 International (CC BY-NC-SA 4.0). You may modify and share, but not for commercial use.
---
**Ready to automate your trading with PickMyTrade? Add this strategy to your TradingView chart today and start capturing profitable trend breakouts on autopilot!**

EMA 50/200 Pullback + RSI (BTC/USDT 15m - 2 Bar Logic)I recognize that combining indicators requires clear justification on how the components interact Therefore the new scripts description will explicitly detail the strategys operational logic
Objective The strategy is a Trend Following Pullback System designed for high frequency time frames 15m
Synergy The EMA50 EMA200 defines the primary Trend Direction Trend Filter It then utilizes a 2 Bar Pullback Logic to find an entry point where the price has momentarily reversed against the trendline and the RSI 14 serves as a Momentum Filter RSI greater than 50 for Long RSI less than 50 for Short to minimize false signals

Trinity ATR Strategy (Saty) - Backtest EditionThis is not supposed to be a standalone indicator, but releasing this to give a general overview of what it could do, each commodity and timeframe would need to be back tested. Use in conjunction with other indicators and price action. This is not financial advice and is not a guarantee of financial results.

BTC EMA 5-9 Flip Strategy AutobotThis strategy is designed for fast and accurate trend-following trades on Bitcoin.
It uses a crossover between EMA 5 and EMA 9 to detect instant trend reversals and automatically flips between Long and Short positions.
How the strategy works
EMA 5 crossing above EMA 9 → Long
EMA 5 crossing below EMA 9 → Short
Automatically closes the opposite trade during a flip
Executes trades only on candle close
Prevents double entries with internal position-state logic
Fully compatible with automated trading via webhooks (Delta Exchange)
Why this strategy works
EMA 5–9 is extremely responsive for BTC’s volatility
Captures trend reversals early
Works best on 15-minute timeframe
Clean, simple logic without over-filtering reduces missed opportunities
Performs well in both uptrends and downtrends
Automation Ready
This strategy includes alert conditions and webhook-ready JSON for automated execution.
This is a fast-reacting BTC bot designed for intraday and swing crypto trend trading.

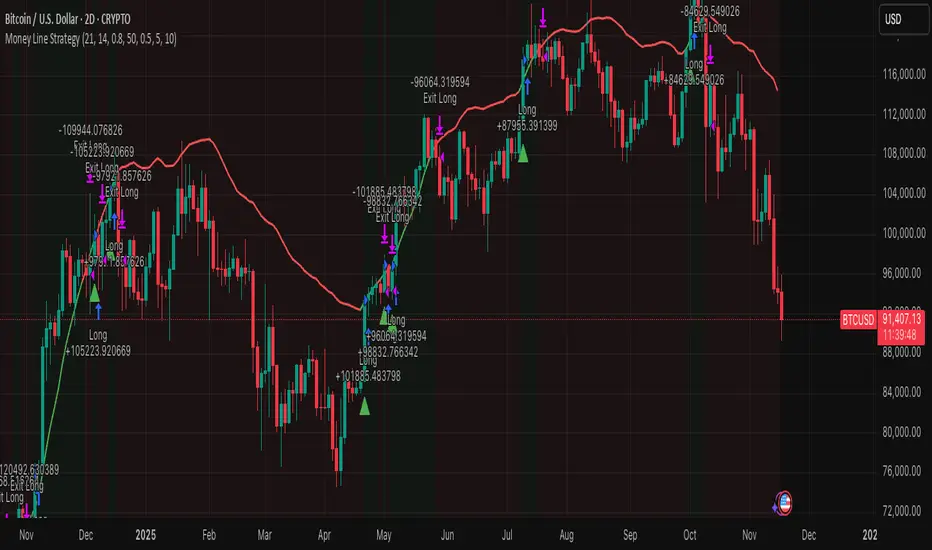
MoneyM Line StrategyPrimary Test: 2020-Present (most relevant for future)
Secondary Test: 2021-Present (includes full cycle)
Validation Test: 2017-Present (longer history)
Target Annual Return: 100-200% (2-4x BTC's 50-100%)
Target Max DD: 25-35% (50% less than BTC's typical 60-70%)
Target Trades: 20-40 per year on weekly (sustainable monitoring)

VIX 恐慌指數 VOO 抄底策略 VIX 恐慌指數 VOO 抄底策略
📊 策略目的
本策略利用 VIX 恐慌指數作為市場情緒指標,幫助投資人在市場極度恐慌時理性進場抄底,並透過客觀的技術訊號避免情緒化操作。適合用於捕捉 VOO(或其他美股 ETF)在恐慌性下跌後的反彈機會。
🎯 進出場條件
進場條件(同時滿足):
VIX 指數達到設定門檻以上(預設 25,可調整)
VIX 死亡交叉其均線(預設 5 日均線),確認恐慌情緒開始回落
出場條件(三種模式可選):
持有天數模式:持有達到設定天數後出場(預設 100 天)
VIX 回落模式:VIX 降至設定門檻以下時出場(預設 20)
兩者皆可模式:任一條件滿足即出場
⚠️ 重要警語
不適合槓桿型 ETF 抄底:VIX 反映的是市場波動度,使用槓桿 ETF(如 TQQQ、SOXL)會因為衰減效應和更大波動而增加風險,可能在恐慌期間造成更大虧損。
空頭市場失準風險:本策略假設市場會從恐慌中反彈,但在長期空頭或系統性風險(如 2008 金融危機、2022 升息循環)中,VIX 可能長期處於高檔,多次觸發買入訊號卻持續下跌,導致策略失效。
建議搭配大盤趨勢判斷:在多頭格局中使用效果較佳,空頭格局建議提高 VIX 門檻或暫停使用。
僅供參考,非投資建議:歷史績效不代表未來表現,請依個人風險承受度謹慎使用。
VIX Panic Index VOO Bottom-Fishing Strategy
📊 Strategy Overview
This strategy utilizes the VIX (Volatility Index) as a market sentiment indicator to help investors rationally enter positions during periods of extreme market panic, using objective technical signals to avoid emotional decision-making. It is designed to capture rebound opportunities in VOO (or other US equity ETFs) following panic-driven selloffs.
🎯 Entry and Exit Conditions
Entry Conditions (both must be met):
VIX reaches or exceeds the set threshold (default 25, adjustable)
VIX death crosses below its moving average (default 5-day MA), confirming panic sentiment is beginning to recede
Exit Conditions (three modes available):
Holding Period Mode: Exit after holding for the set number of days (default 100 days)
VIX Decline Mode: Exit when VIX falls below the set threshold (default 20)
Either Condition Mode: Exit when either condition is met
⚠️ Important Warnings
Not Suitable for Leveraged ETF Bottom-Fishing: VIX reflects market volatility. Using leveraged ETFs (such as TQQQ, SOXL) increases risk due to decay effects and greater volatility, potentially causing larger losses during panic periods.
Bear Market Inaccuracy Risk: This strategy assumes markets will rebound from panic. However, during prolonged bear markets or systemic risks (such as the 2008 financial crisis or 2022 rate hike cycle), VIX may remain elevated for extended periods, triggering multiple buy signals while prices continue declining, rendering the strategy ineffective.
Recommended to Combine with Market Trend Analysis: Works better in bull market conditions. In bear markets, consider raising VIX thresholds or suspending use.
For Reference Only, Not Investment Advice: Historical performance does not guarantee future results. Please use cautiously according to your personal risk tolerance.


THSS MM DUAL MODE WITH JSON FILE Gold Supertrend Pro + THSS MM is an advanced trend-following strategy for XAUUSD combining Supertrend signals, ATR-based dynamic risk management, and the proprietary THSS (Triplet Hierarchy Sequencing System) money-management engine. It offers two THSS modes — Original and Exponential — for adaptive position sizing based on trade outcomes. The strategy filters entries using EMA trend, RSI conditions, volume spikes, candle strength, session timing, and optional news-hour avoidance. It automatically calculates lot size using dynamic ATR stops, equity-based risk caps, and safety limits. Integrated webhook alerts enable direct execution with external trading bots or MT5 automation.

Liquidity Sweep + BOS Retest System — Prop Firm Edition🟦 Liquidity Sweep + BOS Retest System — Prop Firm Edition
A High-Probability Smart Money Strategy Built for NQ, ES, and Funding Accounts
🚀 Overview
The Liquidity Sweep + BOS Retest System (Prop Firm Edition) is a precision-engineered SMC strategy built specifically for prop firm traders. It mirrors institutional liquidity behavior and combines it with strict account-safe entry rules to help traders pass and maintain funding accounts with consistency.
Unlike typical indicators, this system waits for three confirmations — liquidity sweep, displacement, and a clean retest — before executing any trade. Every component is optimized for low drawdown, high R:R, and prop-firm-approved risk management.
Whether you’re trading Apex, TakeProfitTrader, FFF, or OneUp Trader, this system gives you a powerful mechanical framework that keeps you within rules while identifying the market’s highest-probability reversal zones.
🔥 Key Features
1. Liquidity Sweep Detection (Stop Hunt Logic)
Automatically identifies when price clears a previous swing high/low with a sweep confirmation candle.
✔ Filters noise
✔ Eliminates early entries
✔ Locks onto true liquidity grabs
2. Automatic Break of Structure (BOS) Confirmation
Price must show true displacement by breaking structure opposite the sweep direction.
✔ Confirms momentum shift
✔ Removes fake reversals
✔ Ensures institutional intent
3. Precision Retest Entry Model
The strategy enters only when price retests the BOS level at premium/discount pricing.
✔ Zero chasing
✔ Extremely tight stop loss placement
✔ Prop-firm-friendly controlled risk
4. Built-In Risk & Trade Management
SL set at swept liquidity
TP set by user-defined R:R multiplier
Optional session filter (NY Open by default)
One trade at a time (no pyramiding)
Automatically resets logic after each trade
This prevents overtrading — the #1 cause of evaluation and account breaches.
5. Designed for Prop Firm Futures Trading
This script is optimized for:
Trailing/static drawdown accounts
Micro contract precision
Funding evaluations
Low-risk, high-probability setups
Structured, rule-based execution
It reduces randomness and emotional trading by automating the highest-quality SMC sequence.
🎯 The Trading Model Behind the System
Step 1 — Liquidity Sweep
Price must take out a recent high/low and close back inside structure.
This confirms stop-hunting behavior and marks the beginning of a potential reversal.
Step 2 — BOS (Break of Structure)
Price must break the opposite side swing with a displacement candle. This validates a directional shift.
Step 3 — Retest Entry
The system waits for price to retrace into the BOS level and signal continuation.
This creates optimal R:R entry with minimal drawdown.
📈 Best Markets
NQ (NASDAQ Futures) – Highly recommended
ES, YM, RTY
Gold (XAUUSD)
FX majors
Crypto (with high volatility)
Works best on 1m, 2m, 5m, or 15m depending on your trading style.
🧠 Why Traders Love This System
✔ No signals until all confirmations align
✔ Reduces overtrading and emotional decisions
✔ Follows market structure instead of random indicators
✔ Perfect for maintaining long-term funded accounts
✔ Built around institutional-grade concepts
✔ Makes your trading consistent, calm, and rules-based
⚙️ Recommended Settings
Session: 06:30–08:00 MST (NY Open)
R:R: 1.5R – 3R
Contracts: Start with 1–2 micros
Markets: NQ for best structure & volume
📦 What’s Included
Complete strategy logic
All plots, labels, sweep markers & BOS alerts
BOS retest entry automation
Session filtering
Stop loss & take profit system
Full SMC logic pipeline
🏁 Summary
The Liquidity Sweep + BOS Retest System is a complete, prop-firm-ready, structure-based strategy that automates one of the cleanest and most reliable SMC entry models. It is designed to keep you safe, consistent, and rule-compliant while capturing premium institutional setups.
If you want to trade with confidence, discipline, and prop-firm precision — this system is for you.
Good Luck -BG


Finder Breakout Strategy + VisualSimple and effective breakout strategy based on breaking the highest/lowest levels over a configurable period (default 20 periods).
📈 Signals:
- LONG: Breakout above highest high
- SHORT: Breakout below lowest low
🎯 Configurable exits:
- Reverse signal (default)
- Take Profit % (optional)
- Stop Loss % (optional)
✨ Clear visualization with support/resistance levels and signal arrows.
Ideal for momentum trading and identifying strong trends.

趋势策略由三個指標的組合的策略
指標:SuperTrend
超級趨勢指標,可以為進出場自發出買賣信號。
指標:QQE MOD
趨勢跟蹤指標,結合RSI和BOLL的數據,可以識別震蕩和趨勢行情。
指標:A-V2
趨勢跟蹤指標,提供明顯的止損點位。
Indicator: SuperTrend
A trend-following indicator that generates buy and sell signals for market entry and exit.
Indicator: QQE MOD
A trend-following indicator that uses RSI and Bollinger Bands data to identify ranging and trending conditions.
Indicator: A-V2
A trend-following indicator that provides clear stop-loss levels.

4h First Candle Reversion – Strategy (5m Exec)4h First Candle Reversion – Strategy (5m, NY Session)
This strategy is based on the well-known “first 4-hour candle of the day” concept, using the opening range of the New York session to fade failed breakouts on lower timeframes (5m).
It is the strategy version of my indicator with the same name and logic.
________________________________________
🔧 Core Idea
1. Session & Box
o A session “day” is defined in a chosen timezone (default: America/New_York).
o From blockStartHour to blockStartHour + blockLengthHrs (by default 00:00–04:00 NY time), the strategy:
Tracks the highest high and lowest low of this 4h window.
After the window closes, this becomes the daily range box (first 4h high & low), which is used for the rest of that session day.
2. Reversion Setup (Failed Breakouts) – 5m execution
o The strategy works best on a 5-minute chart.
o After the box is ready:
Short signal:
o Previous 5m candle closes above the box high.
o Current 5m candle closes back inside the box.
o → Enter short at the close of the current candle.
Long signal:
o Previous 5m candle closes below the box low.
o Current 5m candle closes back inside the box.
o → Enter long at the close of the current candle.
Only the close is used to decide outside/inside – wicks alone do not trigger trades.
________________________________________
📏 Risk Management (Important Limitation)
The original discretionary concept is usually traded with:
• Stop Loss at the last meaningful swing high/low outside the box before price returns inside.
• Take Profit at a fixed R:R, typically 2:1, based on that actual swing-based risk.
However, in this Pine strategy the SL/TP must be simplified to something static and mechanical:
• SL = the high/low of the breakout candle (the candle that closed outside the box):
o Long: SL at the low of the outside candle.
o Short: SL at the high of the outside candle.
• TP = a fixed multiple of that risk:
o TP = entry ± (risk × tpRR)
o Default tpRR = 2.0 (2R).
⚠ Because of this simplification, the backtest does not perfectly represent how a skilled manual trader would trade this setup.
In live trading you can choose swing highs/lows, adjust R:R more dynamically, skip marginal setups, etc. The script can’t replicate that discretion, so the historical results are approximate, not exact.
Please treat the backtest as a rough performance proxy and as a tool to compare markets/timeframes and tweak rules – not as a precise replication of manual trade management.
________________________________________
⚙️ Inputs & Controls
• Session TZ (int selector)
0 = Exchange, 1 = America/New_York, 2 = Asia/Bangkok, 3 = UTC.
• Block start hour / length
Default: 0 and 4 → first 4h of the NY session day.
• TP (R multiple)
tpRR – default 2.0.
• Enable Longs / Shorts toggles.
• Visual options
o Show/hide box lines
o Show only the latest box or all historical boxes
o Shade the first 4h build window
o Show/hide signal markers (LONG/SHORT triangles)
________________________________________
📝 Usage Notes
• Designed for 5m charts on:
o XAUUSD (Gold)
o BTC/ETH
o Major FX pairs (EURUSD, GBPUSD, USDJPY, etc.)
o Index CFDs/Futures (US100, US500, etc.)
• Best used as:
o A framework for your playbook,
o A way to study how often this setup appears on different markets,
o And a starting point to add your own filters (trend, time filters, news filters, volatility filters, etc.).
Manual trading with dynamic swing-based stops and discretionary filters will always differ from this mechanical version – keep that in mind when interpreting the equity curve and statistics.
