Gann Fan Strategy [KedarArc Quant]Description
A single-concept, rule-based strategy that trades around a programmatic Gann Fan.
It anchors to a swing (or a manual point), builds 1×1 and related fan lines numerically, and triggers entries when price interacts with the 1×1 (breakout or bounce). Management is done entirely with the fan structure (next/previous line) plus optional ATR trailing.
What TV indicators are used
* Pivots: `ta.pivothigh/ta.pivotlow` to confirm swing highs/lows for anchor selection.
* ATR: `ta.atr` only to scale the 1×1 slope (optional) and for an optional trailing stop.
* EMA: `ta.ema` as a trend filter (e.g., only long above the EMA, short below).
No RSI/MACD/Stoch/Heikin/etc. The logic is one coherent framework: Gann price–time geometry, with ATR as a scale and EMA as a risk filter.
How it works
1. Anchor
* Auto: chooses the most recent *confirmed* pivot (you control Left/Right).
* Manual: set a price and bar index and the fan will hold that point (no re-anchoring).
* Optional Re-anchor when a newer pivot confirms.
2. 1×1 Slope (numeric, not cosmetic)
* ATR mode: `1×1 = ATR(Length) × Multiplier` (adapts to volatility).
* Fixed mode: `ticks per bar` (constant slope).
Because slope is numeric, it doesn’t change with chart zoom, unlike the drawing tool.
3. Fan Lines
Builds classic ratios around the 1×1: 1/8, 1/4, 1/3, 1/2, 1/1, 2/1, 3/1, 4/1, 8/1.
4. Signals
* Breakout: cross of price over/under the 1×1 in the EMA-aligned direction.
* Bounce (optional): touch + reversal across the 1×1 to reduce whipsaw.
5. Exits & Risk
* Take-profit at the next fan line; Stop at the previous fan line.
* If a level is missing (right after re-anchor), a fallback Risk-Reward (RR) is used.
* Optional ATR trailing stop.
Why this is unique
* True numeric fan: The 1×1 slope is calculated from ATR or fixed ticks—not from screen geometry—so it is scale-invariant and reproducible across users/timeframes.
* Deterministic anchor logic: Uses confirmed pivots (with your L/R settings). No look-ahead; anchors update only when the right bars complete.
* Fan-native trade management: Both entries and exits come from the fan structure itself (with a minimal ATR/EMA assist), keeping the method pure.
* Two entry archetypes: Breakout for momentum days; Bounce for range days—switchable without changing the core model.
* Manual mode: Lock a session’s bias by anchoring to a chosen swing (e.g., day’s first major low/high) and keep the fan constant all day.
Inputs (quick guide)
* Auto Anchor (Left/Right): pivot sensitivity. Higher values = fewer, stronger anchors.
* Re-anchor: refresh to newer pivots as they confirm.
* Manual Anchor Price / Bar Index: fixes the fan (turn Auto off).
* Scale 1×1 by ATR: on = adaptive; off = use ticks per bar.
* ATR Length / ATR Multiplier: controls adaptive slope; start around 14 / 0.25–0.35.
* Ticks per bar: exact fixed slope (match a hand-drawn fan by computing slope ÷ mintick).
* EMA Trend Filter: e.g., 50–100; trades only in EMA direction.
* Use Bounce: require touch + reverse across 1×1 (helps in chop).
* TP/SL at fan lines; Fallback RR for missing levels; ATR Trailing Stop optional.
* Transparency/Plot EMA: visual preferences.
Tips
* Range days: larger pivots (L/R 8–12), Bounce ON, ATR Multiplier \~0.30–0.40, EMA 100.
* Trend days: L/R 5–6, Breakout, Multiplier \~0.20–0.30, EMA 50, ATR trail 1.0–1.5.
* Match the TV Gann Fan drawing: turn ATR scale OFF, set ticks per bar = `(Δprice between anchor and 1×1 target) / (bars) / mintick`.
Repainting & testing notes
* Pivots require Right bars to confirm; anchors are set after confirmation (no look-ahead).
* Signals use the current bar close with TradingView strategy mechanics; real-time vs. bar-close can differ slightly, as with any strategy.
* Re-anchoring legitimately moves the structure when new pivots confirm—by design.
⚠️ Disclaimer
This script is provided for educational purposes only.
Past performance does not guarantee future results.
Trading involves risk, and users should exercise caution and use proper risk management when applying this strategy.
Indicatori e strategie

عكفة الماكد المتقدمة - أبو فارس ©// 🔒 Advanced MACD Curve © 2025
// 💡 Idea & Creativity: Engineer Abu Elias
// 🛠️ Development & Implementation: Abu Fares
// 📜 All intellectual rights reserved - Copying, modifying, or redistributing is not permitted
// 🚫 Any attempt to tamper with this code or violate intellectual property rights is legally prohibited
// 📧 For inquiries and licensing: Please contact the developer, Abu Fares

عكفة الماكد المتقدمة - أبو فارس ©// 🔒 عكفة الماكد المتقدمة © 2025
// 💡 فكرة وإبداع: المهندس أبو الياس
// 🛠️ تطوير وتنفيذ: أبو فارس
// 📜 جميع الحقوق الفكرية محفوظة - لا يُسمح بالنسخ أو التعديل أو إعادة التوزيع
// 🚫 أي محاولة للعبث بهذا الكود أو انتهاك الحقوق الفكرية مرفوضة قانونياً
// 📧 للاستفسارات والتراخيص: يرجى التواصل مع المطور أبو فارس
// 🔒 Advanced MACD Curve © 2025
// 💡 Idea & Creativity: Engineer Abu Elias
// 🛠️ Development & Implementation: Abu Fares
// 📜 All intellectual rights reserved - Copying, modifying, or redistributing is not permitted
// 🚫 Any attempt to tamper with this code or violate intellectual property rights is legally prohibited
// 📧 For inquiries and licensing: Please contact the developer, Abu Fares

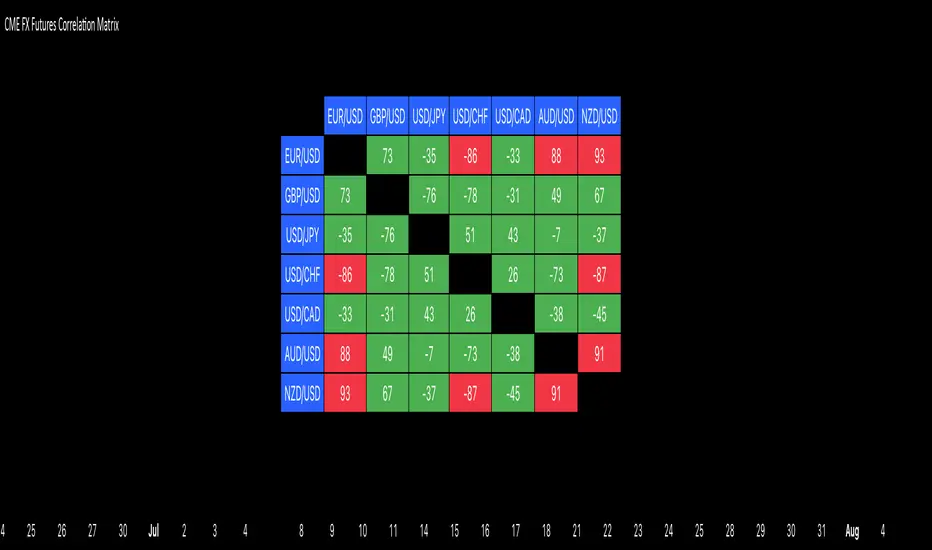
CME FX Futures Correlation MatrixThis indicator calculates the correlation between major CME FX futures and displays it in a visual table. It shows how closely pairs like EUR/USD, GBP/USD, USD/JPY, USD/CHF, USD/CAD, AUD/USD, and NZD/USD move together or in opposite directions.
The indicator inherits the timeframe of the chart it’s applied to.
Color coding:
Red: strong correlation (absolute value > 80%), both positive and negative
Green: moderate/low correlation
How to launch it
Apply the indicator to a CME chart (e.g., EUR/USD futures).
Set Numbers of Bars Back to the desired lookback period (default 100).
The table appears in the center of the chart, showing correlation percentages between all major FX futures.
tvunitLibrary "tvunit"
method assert(this, description, passed, bar)
Adds a test result to the test suite.
Namespace types: TestSuite
Parameters:
this (TestSuite) : The (TestSuite) instance.
description (string) : A description of the test.
passed (bool) : Whether the test passed or result.
bar (int) : The bar index at which the test was run.
Returns: Whether the assertion passed or result.
method assertWindow(this, runTests, description, bars, passed, stopOnFirstFailure)
Adds a test result to the test suite.
Namespace types: TestSuite
Parameters:
this (TestSuite) : The (TestSuite) instance.
runTests (bool) : Whether to run the tests.
description (string) : A description of the test.
bars (int) : The number of bars to test.
passed (bool) : A series of boolean values indicating whether each bar passed.
stopOnFirstFailure (bool) : Whether to stop on the first test failure.
Returns: Whether the assertion ran or not
method totalTests(this)
Returns the total number of tests in the test suite.
Namespace types: TestSuite
Parameters:
this (TestSuite) : The (TestSuite) instance.
Returns: The total number of tests.
method totalTests(this)
Returns the total number of tests in the test suite.
Namespace types: TestSession
Parameters:
this (TestSession) : The (TestSuite) instance.
Returns: The total number of tests.
method passedTests(this)
Returns the total number of passed tests in the test suite.
Namespace types: TestSuite
Parameters:
this (TestSuite) : The (TestSuite) instance.
Returns: The total number of passed tests.
method passedTests(this)
Returns the total number of passed tests in the test suite.
Namespace types: TestSession
Parameters:
this (TestSession) : The (TestSuite) instance.
Returns: The total number of passed tests.
method failedTests(this)
Returns the total number of result tests in the test suite.
Namespace types: TestSuite
Parameters:
this (TestSuite) : The (TestSuite) instance.
Returns: The total number of result tests.
method failedTests(this)
Returns the total number of result tests in the test suite.
Namespace types: TestSession
Parameters:
this (TestSession) : The (TestSuite) instance.
Returns: The total number of result tests.
newTestSession()
Creates a new test session instance.
Returns: A new (TestSession) instance.
method addNewTestSuite(this, name, description)
Creates a new test suite instance.
Namespace types: TestSession
Parameters:
this (TestSession) : The (TestSession) instance.
name (string) : The name of the test suite.
description (string) : (optional) A description of the test suite.
Returns: A new (TestSuite) instance.
method add(this, suite)
Creates a new test suite instance.
Namespace types: TestSession
Parameters:
this (TestSession) : The (TestSession) instance.
suite (TestSuite) : The (TestSuite) instance to add.
Returns: The (TestSession) instance.
method totalSuites(this)
Returns the total number of sessions in the test session.
Namespace types: TestSession
Parameters:
this (TestSession) : The (TestSession) instance.
Returns: The total number of sessions.
method report(this, show, showOnlyFailedTest)
Generates a report of the test session summary that is suitable for logging.
Namespace types: TestSession
Parameters:
this (TestSession) : The (TestSession) instance.
show (bool) : Optional: Whether to show the report or not. default: true
showOnlyFailedTest (bool) : Optional: Whether to show only result tests or not. default: false
Returns: A formatted string report of the test suite summary.
method reportGui(this, show, pages, pageSize)
Generates a report of the test suite summary for the GUI.
Namespace types: TestSession
Parameters:
this (TestSession) : The (TestSession) instance.
show (bool) : Optional: Whether to show the report or not. default: true
pages (int) : Optional: The number of pages to show (columns). default: 4
pageSize (int) : Optional: The number of results to show per page (rows), excluding the header. default: 5
approxEqual(a, b, tolerance)
Checks if two floating-point numbers are approximately equal within a specified tolerance.
Parameters:
a (float) : The first floating-point number.
b (float) : The second floating-point number.
tolerance (float) : The tolerance within which the two numbers are considered equal. Default is 1e-6.
Returns: True if the numbers are approximately equal, false otherwise. If both are na, returns true.
TestResult
Fields:
description (series string)
passed (series bool)
bar (series int)
TestSuite
Fields:
isEnabled (series bool)
name (series string)
description (series string)
tests (array)
TestSession
Fields:
suites (array)

RSI with Dual Smoothed MAs + Trend BackgroundRSI with two custom MAs (SMA, EMA, WMA, RMA, VWMA).
Slope-based MA coloring.
Background shading for quick trend confirmation.

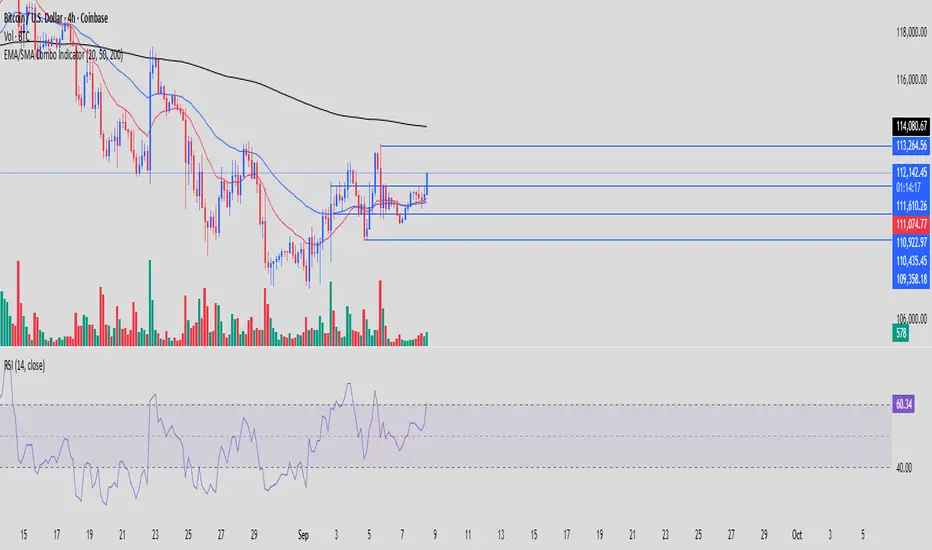
RTC EMA/SMA Combo IndicatorRTC Combo indicator with 20 EMA, 50 EMA and 200 SMA
Primarily used for Market Structure purpose
MA20 & MA50 RisingMA20 & MA50 Rising Scanner
Detects when both the 20-period and 50-period simple moving averages turn upward on the most recent bar. Designed as a lightweight screener column for TradingView’s watchlists.
Overview
This indicator plots a binary flag (0 or 1) per symbol, where
- 1 means SMA(20) > SMA(20) and SMA(50) > SMA(50)
- 0 means one or both moving averages did not rise
Add it as a custom column in your watchlist to instantly surface stocks with both short- and medium-term trend acceleration.
How It Works
- Calculates ma20 = simple moving average of the last 20 closes
- Calculates ma50 = simple moving average of the last 50 closes
- Compares each with its prior value (ma20 and ma50 )
- Sets flag to 1 only when both are higher than yesterday’s values
When you filter your watchlist for flag == 1, you see only symbols whose 20- and 50-period SMAs both rose on the latest bar.

Ajay Auto Pre-Market Gap + 3PM Signal (NIFTY/BANKNIFTY/SENSEX)Auto Pre-Market Gap + 3PM Signal (NIFTY/BANKNIFTY/SENSEX)

Big Candle Alert (Body Only + Strict Breakout)Beta script for assessing candle breakout strength relative to previous candles (thanks Chat GPT). Use in accordance with volume heat map

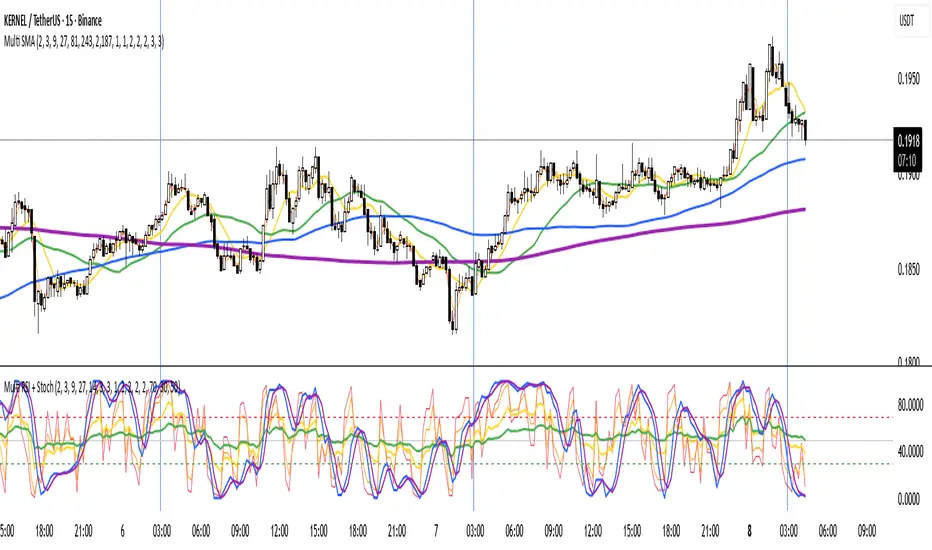
Multi-RSI with Stochastic Oscillator - flack0xA sophisticated momentum analysis tool combining 4 customizable RSI oscillators with an innovative Close/Close Stochastic implementation. Designed for traders seeking comprehensive momentum insights across multiple timeframes in a single, organized indicator.
Key Features:
4 Independent RSI Oscillators with default periods: 2, 3, 9, 27
Innovative Close/Close Stochastic - Compares closing prices to closing price ranges (not high/low)
Complete Customization - Individual control over periods, colors, line widths, and visibility
Reference Levels - Customizable overbought (70), oversold (30), and midline (50) levels
Smart Alert System - Crossover notifications for key momentum shifts
Unique Close/Close Stochastic Methodology:
Unlike traditional Stochastic oscillators that use high/low ranges.
Benefits of Close/Close Approach:
Eliminates Gap Noise - Ignores overnight gaps and intraday wicks
Smoother Signals - Reduces whipsaws common in traditional Stochastic
Position-Relevant - Focuses on actual settlement prices traders care about
Cleaner Momentum Reading - Pure closing price momentum without intraday volatility

Multi-Period SMA - flack0xA comprehensive moving average indicator featuring 7 fully customizable SMA periods designed for multi-timeframe trend analysis. Perfect for traders who want to visualize multiple moving average periods simultaneously without cluttering their charts with separate indicators.Key Features:
7 Independent SMAs with default periods: 2, 3, 9, 27, 81, 243, 2187
Individual Customization - Each SMA has its own period, color, line width, and visibility controls
Smart Defaults - Shorter SMAs use thinner lines, longer SMAs use thicker lines for visual hierarchy
Overlay Design - Properly overlays on price data without Y-axis attachment issues
Alert System - Built-in crossover alerts for key SMA levels (9 and 27 period)

Plot_4_Key_LevelsBollinger Bands (upper & lower)
- computes 12-bar Bollinger Bands on the chart’s current timeframe, with a 3σ (standard-deviation) multiplier.
- computes vwap
- computes VWMA(HL2, 36)—a smoothed, volume-weighted average price—plotted as a line.

Trajectory Channel (VWAP Highs/Lows) [Euler-Inspired]VPWA higha nd low Euler trajectory inspired script

Adaptive FoS LibraryThis library provides Adaptive Functions that I use in my scripts. For calculations, I use the max_bars_back function with a fixed length of 200 bars to prevent errors when a script tries to access data beyond its available history. This is a key difference from most other adaptive libraries — if you don’t need it, you don’t have to use it.
Some of the adaptive length functions are normalized. In addition to the adaptive length functions, this library includes various methods for calculating moving averages, normalized differences between fast and slow MA's, as well as several normalized oscillators.

XAUUSD/SPX Slope IndicatorThe XAUUSD/SPX Slope Indicator for TradingView calculates the slope of the XAUUSD (Gold) to SPX (S&P 500) ratio using linear regression over a customizable lookback period (default 20 bars). It plots the slope to show whether Gold is outperforming or underperforming the S&P 500, with a positive slope indicating Gold's strength and a negative slope favoring stocks. A zero line and color-coded background (green for positive, red for negative) enhance readability, making it a useful tool for analyzing relative market trends. Ensure your platform supports XAUUSD and SPX symbols.

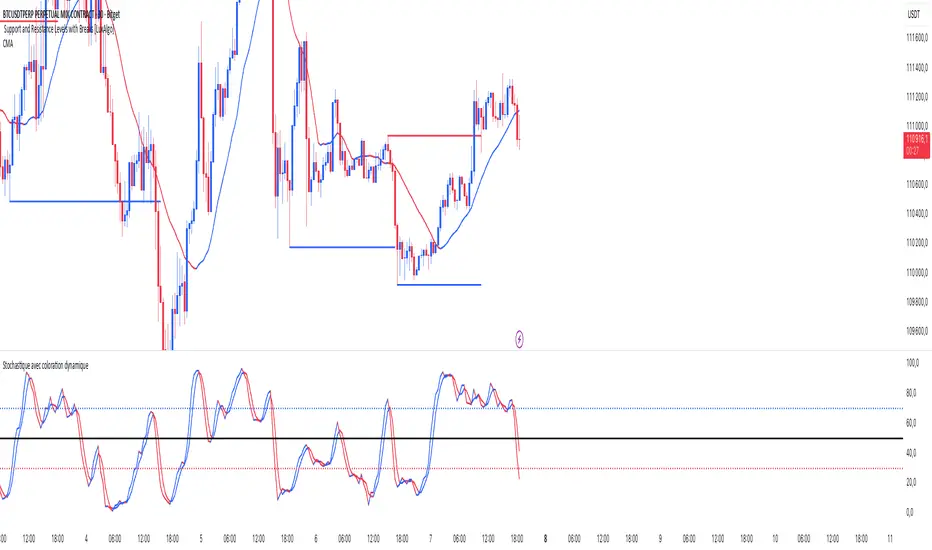
Stochastic ColorStochastic Color. A momentum indicator that compares a particular closing price of an asset to a range of its prices over a specific period of time. It helps identify overbought and oversold conditions in the market. The indicator ranges from 0 to 100, with readings above 80 typically considered overbought and readings below 20 considered oversold. It is often used to anticipate potential price reversals.
RSI SMA ColorRSI 14 with SMA 21 Color. A momentum oscillator that measures the speed and change of price movements. It ranges from 0 to 100 and is typically used to identify overbought or oversold conditions in a market. An RSI above 70 may indicate that an asset is overbought, while an RSI below 30 may suggest it is oversold.

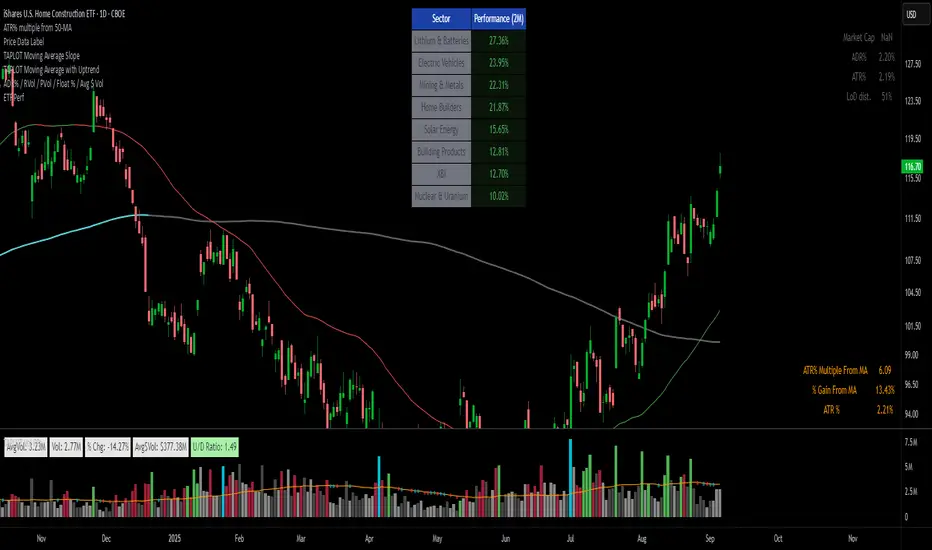
ETFs Sector PerformanceDisplays a table of the Top 8 performing ETFs over a selected period (1M / 2M / 3M / 6M) to quickly identify industry strength.
Pre-Set Universe (39 ETFs)
ITA — iShares U.S. Aerospace & Defense ETF
DBA — Invesco DB Agriculture Fund
BOTZ — Global X Robotics & Artificial Intelligence ETF
JETS — U.S. Global Jets ETF
XLB — Materials Select Sector SPDR Fund
XBI — SPDR S&P Biotech ETF
PKB — Invesco Dynamic Building & Construction ETF
ICLN — iShares Global Clean Energy ETF
SKYY — First Trust Cloud Computing ETF
DBC — Invesco DB Commodity Index Tracking Fund
XLY — Consumer Discretionary Select Sector SPDR Fund
XLP — Consumer Staples Select Sector SPDR Fund
BLOK — Amplify Transformational Data Sharing ETF
KARS — KraneShares Electric Vehicles & Future Mobility ETF
XLE — Energy Select Sector SPDR Fund
ESPO — VanEck Video Gaming and eSports ETF
XLF — Financial Select Sector SPDR Fund
PBJ — Invesco Dynamic Food & Beverage ETF
ITB — iShares U.S. Home Construction ETF
XLI — Industrial Select Sector SPDR Fund
PAVE — Global X U.S. Infrastructure Development ETF
PEJ — Invesco Dynamic Leisure & Entertainment ETF
LIT — Global X Lithium & Battery Tech ETF
IHI — iShares U.S. Medical Devices ETF
XME — SPDR S&P Metals & Mining ETF
FCG — First Trust Natural Gas ETF
URA — Global X Uranium ETF
PPH — VanEck Pharmaceutical ETF
QTUM — Defiance Quantum Computing & Machine Learning ETF
IYR — iShares U.S. Real Estate ETF
XRT — SPDR S&P Retail ETF
SOXX — iShares Semiconductor ETF
BOAT — SonicShares Global Shipping ETF
IGV — iShares Expanded Tech-Software Sector ETF
TAN — Invesco Solar ETF
SLX — VanEck Steel ETF
IYZ — iShares U.S. Telecommunications ETF
IYT — iShares U.S. Transportation ETF
XLU — Utilities Select Sector SPDR Fund
Bot Analyzer📌 Script Name: Bot Analyzer
This TradingView Pine Script v5 indicator creates a dashboard table on the chart that helps you analyze any asset for running a martingale grid bot on futures.
🔧 User Inputs
TP % (tpPct): Take Profit percentage.
SO step % (soStepPct): Step size between safety orders.
SO n (soCount): Number of safety orders.
M mult (martMult): Martingale multiplier (how much each next order increases in size).
Lev (leverage): Leverage used in futures.
BB len / BB mult: Bollinger Bands settings for measuring channel width.
ATR len: ATR period for volatility.
HV days: Lookback window (days) for Historical Volatility calculation.
📐 Calculations
ATR % (atrPct): Normalized ATR relative to price.
Bollinger Band width % (bbPct): Market channel width as percentage of basis.
Historical Volatility (hvAnn): Annualized volatility, calculated from daily log returns.
Dynamic Step % (dynStepPct): Step size for safety orders, automatically adjusted from ATR and clamped between 0.3% and 5%.
Covered Move % (coveredPct): Total percentage move the bot can withstand before last safety order.
Martingale Size Factor (sizeFactor): Total position size multiplier after all safety orders, based on martingale multiplier.
Risk Score (riskLabel): Simple risk estimate:
Low if risk < 30
Mid if risk < 60
High if risk ≥ 60
📊 Output (Table on Chart)
At the top-right of the chart, the script draws a table with 9 rows:
Metric Value
BB % Bollinger Band width in %
HV % Historical Volatility (annualized %)
TP % Take profit setting
SO step % Safety order step size
SO n Number of safety orders
M mult Martingale multiplier
Dyn step % Dynamic step based on ATR
Size x Total position size factor (e.g., 4.5x)
Risk Risk label (Low / Mid / High)
⚙️ Use Case
Helps choose coins for a martingale bot:
If BB% is wide and HV% is high → the asset is volatile enough.
If Risk shows "High" → parameters are aggressive, you may need to adjust step size, SO count, or leverage.
The dashboard lets you compare assets quickly without switching between multiple indicators.
