Pair Creation🙏🏻 The one and only pair construction tech you need, unlike others:
Applies one consistent operation to all the data features (not only prices). Then, the script outputs these, so you can apply other calculations on these outputs.
calculates a very fast and native volatility based hedge ratio, that also takes into account point value (think SPY vs ES) so you can easily use it in position sizing
Has built-in forward pricing aka cost of carry model , so you can de-drift pairs from cost of carry, discover spot price of oil based on futures, and ofc find arbitrage opportunities
Also allows to make a pair as a product of 2 series, useful for triangular arbitrage
This script can make a pair in 2 ways:
Ratio, by dividing leg 1 by leg 2
Product, by multiplying leg 1 by leg 2
The real mathematically right way to construct a pair is a ratio/product (Spreads are in fact = 2 legged portfolio, but I ain't told ya that ok). Why? Because a pair of 2 entities has a mathematically unique beauty, it allows direct comparisons and relationship analysis, smth you can't do directly with 3 and more components.
Multiplication (think inversions like (EURUSD -> USDEUR), and use cases for triangular arbitrage) is useful sometimes too.
...
Quickguide:
First, "Legs" are pair components: make a pair of related assets. Don’t be guided exclusively by clustering, cointegrations, mutual information etc. Common sense and exogenous info can easily made them all Forward pricing model: is useful when u work with spot vs futures pairs. Otherwise: put financing, storage and yield all on zeros, this way u will turn it off and have a pure ratio/product of 2 legs.
Look at the 2 numbers on the script’s status line: the first one would always be 1), and the second one is a variable.
First number (always 1) is multiplier for your position size on leg 1
The second number is the multiplier for your position size on leg 2 in the opposite direction.
If both legs are related, trading your sizes with these multipliers makes you do statistical arbitrage -> trading ~ volatility in risk free mode, while the relationship between the assets is still in place.
Also guys srsly, nobody ‘ever’ made a universal law that somewhy somehow for whatever secret conspiracy reason one shall only trade pairs in mean reverting style xd. You can do whatever you want:
Tilt hedge ratio significantly based on relative strength of legs
Trade the pair in momentum style
Ignore hedge ratio all together
And more and more, the limit is your imagination, e.g.:
Anticipate hedge ratio changes based on exogenous info and act accordingly
Scalp a pair just like any other asset
Make a pair out of 2 pairs
Like I mean it, whatever you desire
About forward pricing model:
It’s applied only to leg 2;
Direct: takes spot price and finds out implied futures price
Inverse: takes futures price and finds out implied spot price (try on oil)
Pls read online how to choose parameters, it’s open access reliable info
About the hedge ratio I use:
You prolly noticed the way I prefer to use inferred volumes vs the “real” ones. In pairs it’s especially meaningful, because real volumes lose sense in pair creation. And while volumes are closely tied to volatility, the inferred volumes ‘Are’ volatility irl (and later can be converted to currency space by using point value, allowing direct comparisons symbol vs symbol).
This hedge ratio is a good example of how discovering the real nature of entities beats making 100s of inventions, why domain knowledge and proper feature engineering beats difficult bulky models, neural networks etc. How simple data understanding & operations on it is all you need.
This script simply does this:
Takes inferred volume delta of both assets, makes a ratio, normalizes it by tick sizes and points values of both legs, calculates a typical value of this series.
That’s it, no step 2, we’re done. No Kalman filters, no TLS regression, no vine copulas, or whatever new fancy keywords you can come up with etc.
...
^^ comparing real ES prices vs theoretical ones by forward-pricing model. Financing: 0.04, yield 0.0175
^^ EURUSD, 6E futures with theoretical futures price calculated with interest rate differential 0.02 (4% USD - 2% EUR interest rates)
^^4 different pairs (RTY/ES, YM/ES, NQ/ES, ES/ZN) each with different plot style (pick one you like in script's Style settings)
^^ YM/RTY pair, each plot represents ratio of different features: ratio of prices, ratio of inferred volume deltas, ratio of inferred volumes, ratio of inferred tick counts (also can be turned on/off in Style settings)
...
How can u upgrade it and make a step forward yourself:
On tradingview missing values are automatically fixed by backfilling, and this never becomes a thing until you hit high frequency data. You can do better and use Kalman filter for filling missing values.
Script contains the functions I use everywhere to calculate inferred volume delta, inferred volume, and inferred tick count.
...
∞
Pairstrading

Static Beta for Pair and Quant Trading A beta coefficient shows the volatility of an individual stock compared to the systematic risk of the entire market. Beta represents the slope of the line through a regression of data points. In finance, each point represents an individual stock's returns against the market.
Beta effectively describes the activity of a security's returns as it responds to swings in the market. It is used in the capital asset pricing model (CAPM), which describes the relationship between systematic risk and expected return for assets. CAPM is used to price risky securities and to estimate the expected returns of assets, considering the risk of those assets and the cost of capital.
Calculating Beta
A security's beta is calculated by dividing the product of the covariance of the security's returns and the market's returns by the variance of the market's returns over a specified period. The calculation helps investors understand whether a stock moves in the same direction as the rest of the market. It also provides insights into how volatile—or how risky—a stock is relative to the rest of the market.
For beta to provide useful insight, the market used as a benchmark should be related to the stock. For example, a bond ETF's beta with the S&P 500 as the benchmark would not be helpful to an investor because bonds and stocks are too dissimilar.
Beta Values
Beta equal to 1: A stock with a beta of 1.0 means its price activity correlates with the market. Adding a stock to a portfolio with a beta of 1.0 doesn’t add any risk to the portfolio, but it doesn’t increase the likelihood that the portfolio will provide an excess return.
Beta less than 1: A beta value less than 1.0 means the security is less volatile than the market. Including this stock in a portfolio makes it less risky than the same portfolio without the stock. Utility stocks often have low betas because they move more slowly than market averages.
Beta greater than 1: A beta greater than 1.0 indicates that the security's price is theoretically more volatile than the market. If a stock's beta is 1.2, it is assumed to be 20% more volatile than the market. Technology stocks tend to have higher betas than the market benchmark. Adding the stock to a portfolio will increase the portfolio’s risk, but may also increase its return.
Negative beta: A beta of -1.0 means that the stock is inversely correlated to the market benchmark on a 1:1 basis. Put options and inverse ETFs are designed to have negative betas. There are also a few industry groups, like gold miners, where a negative beta is common.
LET'S START
Now I'll give my own definition.
Beta:
If we assume market caps are equal ,
it is an indicator that shows how much of the second instrument we should buy if we buy one of the first, taking into account the price volatility of two instruments.
But if the market caps are not equal:
For example, the ETF for A is $300.
The ETF for B is $600.
If static beta predicted by this script is 0.5:
300 * 1 * a = 600 * 0.5 * b
Then we should use 1 b for 1 a.
(Long a and short b or vice versa )
So, we can try pair trading for a/b or a-b.
However, these values are generally close to each other, such as 0.8 and 0.93. However, the closer we can adjust our lot purchases to bring the double beta to a value closer to 1, the higher the hedge ratio will be.
Large commercials use dynamic betas, which are updated periodically, in addition to static betas
However, scaling this is very difficult for individual investors with limited investment tools.
But a static beta of 5,000 bars is still much better than not considering any beta at all.
Note: The presence of a beta value for two instruments does not necessarily mean they can be included in pair trading.
It is also important (%99) to consider historically very high correlations and cointegration relationships, as well as the compatibility of security structures.
Note 2 : This script is designed for low timeframes.
Do not use betas from different timeframes.
Beta dynamics are different for each timeframe.
Note 3 : I created this script with the help of ChatGPT.
Source for beta definition ( ) :
www.investopedia.com
Regards.

SMT Oscillator: Smarter Money Divergence Detector [PhenLabs]📊Phenlabs - SMT Oscillator: Smarter Money Divergence Detector
Version: PineScript™v6
📌Description
The SMT Oscillator is a sophisticated tool designed to identify smart money divergence between two correlated assets. By analyzing the momentum and volume-weighted price action of a primary and secondary symbol, traders can spot subtle shifts in market dynamics that often precede significant price movements. This indicator is built to provide a clearer, more filtered view of inter-market relationships, solving the common problem of false signals and market noise. Its primary purpose is to equip traders with a quantifiable edge in detecting potential reversals or continuations that are not obvious on a standard price chart.
🚀Points of Innovation
Dual-Symbol Divergence Core: Directly compares momentum (RSI or MACD) between two user-selected symbols to pinpoint true SMT divergence.
Volume-Weighted Analysis: Integrates volume delta into the divergence calculation, giving more weight to moves backed by significant market participation.
Entropy Filter for Noise Reduction: Employs an entropy calculation to filter out low-quality signals during choppy or consolidating market conditions.
Predictive Forecast Line: Utilizes a linear regression model to project the oscillator’s future trajectory, offering a forward-looking glimpse of potential momentum shifts.
Customizable Signal Sensitivity: Allows fine-tuning of overbought and oversold levels to adapt to different market volatilities and trading styles.
Integrated Signal Alerts: Provides built-in alerts for bullish/bearish zero crosses and overbought/oversold conditions.
🔧Core Components
Momentum Engine: The user can select either RSI or MACD as the underlying engine for the divergence calculation, allowing for flexibility in analysis.
Normalization Function: Price data from both symbols is normalized using percentage change to ensure a true “apples-to-apples” comparison, regardless of their nominal price differences.
Divergence Calculator: The core algorithm that subtracts the secondary symbol’s momentum from the primary’s and normalizes the result using the combined standard deviation.
Smoothing Mechanism: An Exponential Moving Average (EMA) is applied to the raw oscillator output to reduce choppiness and provide a clearer signal line.
🔥Key Features
Multi-Asset Comparison: Go beyond single-asset analysis by comparing correlated pairs like ES/NQ or BTC/ETH to uncover hidden trading opportunities.
Heatmap Visualization: An optional heatmap mode provides an intuitive visual representation of divergence strength, making it easier to gauge market sentiment at a glance.
Configurable Lookback and Timeframe: Adjust the lookback period and analysis timeframe to suit your specific strategy, from short-term scalping to long-term trend analysis.
Signal Markers: Visual markers are plotted directly on the chart for bullish and bearish zero-line crossovers, providing clear entry and exit signals.
🎨Visualization
SMT Oscillator Line: The primary visual element, colored blue for bullish (positive) divergence and orange for bearish (negative) divergence.
Zero Line: A solid horizontal line at the zero level, indicating the equilibrium point between the two assets. Crossovers of this line signal a shift in relative strength.
Overbought/Oversold Zones: Dotted lines at the +80 and -80 levels (customizable) that highlight extreme divergence readings, often indicating potential exhaustion points.
Forecast Line: A predictive line that plots the anticipated path of the oscillator, giving traders an advanced warning of potential changes in momentum.
📖Usage Guidelines
Setting Categories
Primary Symbol
Default: (Chart Symbol)
Description: The main asset you are analyzing. Leave blank to use the symbol currently on your chart.
Secondary Symbol
Default: CME_MINI:ES1! (used with NASDAQ futures due to inherent heavy correlation
Description: The asset to compare against the primary symbol.
Lookback Period
Default: 14
Range: 8-100
Description: Controls the calculation window for momentum (RSI/MACD). Higher values result in a smoother, less sensitive oscillator.
Divergence Type
Default: RSI
Options: RSI, MACD
Description: Choose the momentum indicator to use for the divergence calculation.
Enable Volume Weighting
Default: true
Description: When enabled, gives more weight to divergence signals that are accompanied by significant volume.
✅Best Use Cases
Identifying high-probability reversal points by spotting divergence in overbought or oversold territory.
Confirming the strength of a trend by observing sustained positive or negative divergence.
Pairs trading by taking a long position on the outperforming asset and a short position on the underperforming one during a divergence.
Risk management by recognizing when a current trend is losing its underlying momentum.
⚠️Limitations
Requires Correlated Assets: The indicator’s effectiveness is highly dependent on the selection of two assets with a known correlation (e.g., ES and NQ).
Not a Standalone System: Divergence signals should be used in conjunction with other forms of analysis (price action, market structure) and not as a complete trading system.
Lagging by Nature: As it is based on moving averages and past price data, the oscillator is inherently lagging and may not capture all rapid price changes.
💡What Makes This Unique
Combined Momentum & Volume: Unlike standard oscillators, it fuses momentum with volume delta for a more robust “Smart Money” perspective.
Noise-Filtering Mechanism: The proprietary entropy filter is a unique feature designed to weed out insignificant market chatter and focus on high-conviction signals.
🔬How It Works
Data Normalization:
The script first normalizes the price data of the two selected symbols into percentage changes. This ensures that the comparison is fair, regardless of the difference in their price scales.
Momentum Calculation:
It then calculates the chosen momentum value (either RSI or MACD histogram) for each of the normalized price series.
Divergence Computation:
The core of the indicator lies in subtracting the momentum of the secondary symbol from the primary one. This raw divergence is then optionally weighted by volume and filtered for market noise (entropy) to produce the final oscillator value.
💡Note:
For best results, use this indicator on adequate timeframes to filter out market noise. Always confirm signals with price action analysis before entering a trade.

Asset Premium/Discount Monitor📊 Overview
The Asset Premium/Discount Monitor is a tool for analyzing the relative value between two correlated assets. It measures when one asset is trading at a premium or discount compared to its historical relationship with another asset, helping traders identify potential mean reversion opportunities, or pairs trading opportunities.
🎯 Use Cases
Perfect for analyzing:
NASDAQ:MSTR vs CRYPTO:BTCUSD - MicroStrategy's premium/discount to Bitcoin
NASDAQ:COIN vs BITSTAMP:BTCUSD - Coinbase's relative value to Bitcoin
NASDAQ:TSLA vs NASDAQ:QQQ - Tesla's premium to tech sector
Regional banks AMEX:KRE vs AMEX:XLF - Individual bank stocks vs financial sector
Any two correlated assets where relative value matters
Example of a trade: MSTR vs BTC - When indicator shows MSTR at 95% percentile (extreme premium): Short MSTR, Buy BTC. Then exit when the spread reverts to the mean, say 40-60% percentile.
🔧 How It Works
Core Calculation
Ratio Analysis: Calculates the price ratio between your asset and the correlated asset
Historical Baseline: Establishes the "normal" relationship using a 252-day moving average. You can change this.
Premium Measurement: Measures current deviation from historical average as a percentage
Statistical Context: Provides percentile rankings and standard deviation bands
The Math
Premium % = (Current Ratio / Historical Average Ratio - 1) × 100
🎨 Customization Options
Correlated Asset: Choose any symbol for comparison
Lookback Period: Adjust historical baseline (50-1000 days)
Smoothing: Reduce noise with moving average (1-50 days)
Visual Toggles: Show/hide bands and percentile lines
Color Themes: Customize premium/discount colors
📊 Interpretation Guide
Premium/Discount Reading
Positive %: Asset trading above historical relationship (premium)
Negative %: Asset trading below historical relationship (discount)
Near 0%: Asset at fair value relative to correlation
Percentile Ranking
90%+: Near recent highs - potential selling opportunity
10% and below: Near recent lows - potential buying opportunity
25-75%: Normal trading range
Signal Classifications
🔴 SELL PREMIUM: Asset expensive relative to recent range
🟡 Premium Rich: Moderately expensive, monitor for reversal
⚪ NEUTRAL: Fair value territory
🟡 Discount Opportunity: Moderately cheap, potential accumulation zone
🟢 BUY DISCOUNT: Asset cheap relative to recent range
🚨 Built-in Alerts
Extreme Premium Alert: Triggers when percentile > 95%
Extreme Discount Alert: Triggers when percentile < 5%
⚠️ Important Notes
Works best with highly correlated assets
Historical relationships can change - monitor correlation strength
Not investment advice - use as one factor in your analysis
Backtest thoroughly before implementing any strategy
🔄 Updates & Future Features
This indicator will be continuously improved based on user feedback. So... please give me your feedback!

Arbitrage Synthetic Spread Chart v2Powerful tool for analyzing market divergences and identifying arbitrage opportunities! It creates a synthetic spread chart between two assets, displaying it in a clear format and helping traders spot moments of maximum decorrelation.
How does it work?
The indicator takes the closing prices of two assets and calculates their difference (spread):
spread = price1 - price2
Then, it constructs a price channel based on the highest and lowest values of the spread over a given period:
-Upper boundary: The highest spread value over the period
- Lower boundary: The lowest spread value over the period
- Middle line: The average of the upper and lower boundaries
Additionally, the indicator calculates the **correlation** between the two assets, helping traders assess their relationship strength.
How to use it?
When the spread reaches the channel boundaries, it may indicate an abnormal divergence between the assets. This serves as a signal for arbitrage trading:
✅ At the upper boundary: Sell Asset 1 and buy Asset 2
✅ At the lower boundary: Buy Asset 1 and sell Asset 2

Symbols Correlation, built for pair tradingOverview:
This script is designed for pairs trading. If you are not familiar with pairs trading, I suggest learning about it, as it can be a profitable strategy in neutral markets (or neutral trends between two assets). The correlation between two assets is the foundation of pairs trading, and without it, the chances of making a profit are low.
Correlation can be described in two opposite ways:
1: Absolute positive correlation (meaning the asset prices move together).
-1: Absolute negative correlation (meaning the asset prices move in opposite directions).
Any value between 1 and -1 indicates some degree of correlation, but generally, values higher than 0.7 or lower than -0.7 are considered significant.
Features:
Typically, correlation is measured using the closing prices. This script adds three more correlation studies based on open, high, and low prices. By using all four lines, we can get a better understanding of the pair's correlation.
How to Read This Indicator:
To use this indicator effectively, you need to input your pair as a ratio. For example, if your pair is TSN and ZBH, enter it in the symbol search as: TSN/ZBH
Gray Area : This area indicates "no high correlation" (default is between -0.8 and 0.8, adjustable in the settings).
Gray Line : This represents the close correlation within the "no high correlation" range.
Green Line : This represents the close correlation within the "high correlation" range.
Dot Lines : These represent the open, high, and low correlations.
Example Interpretations:
A : All four lines are close together & the line is green – very good correlation!
B : The line is gray, and the dot lines are apart – not a strong correlation.
C : When the close correlation remains green for a long time, it signals a strong correlation.
Application in Pairs Trading:
In pairs trading, aim for the highest possible correlation, and it is important to have a sustained correlation over a long period. Pairs that correlate only part of the year but not consistently are less reliable for pairs trading.
This is an example for good correlation for pairs trading:
This is an example for bad correlation for pairs trading:
Here is a view of my full indicators when doing pairs trading:

Trend Momentum Strength Indicator, Built for Pairs TradingOverview:
This script combines multiple indicators to provide a comprehensive analysis of both trend strength and trend momentum. It is tailored specifically for pairs trading strategies but can also be used for other trading strategies.
Benefit of Comprehensive Analysis:
Having an indicator that evaluates both trend strength and trend momentum is crucial for traders looking to make informed decisions. It allows traders to not only identify the direction and intensity of a trend but also gauge the momentum behind it. This dual capability helps in confirming potential trade opportunities, whether for entering trades with strong trends or considering reversals during overbought or oversold conditions. By integrating both aspects into one tool, traders can gain a holistic view of market dynamics, enhancing their ability to time entries and manage risk effectively.
Features:
* Trend Strength:
Enhanced ADX Formula: The script includes modifications to the standard ADX formula along with DI+ and DI- to provide more responsive trend strength readings.
Directional Indicators: DI+ (green line) indicates positive directional movement, while DI- (red line) indicates negative directional movement.
Trend Momentum:
Modified Stochastic Indicators: The script uses %K and %D indicators, modified and combined with ADX to give a clear indication of trend momentum.
Momentum Strength: This helps determine the strength and direction of the momentum.
Trading Signals:
Combining Indicators: The script combines ADX, DI+, DI-, %K, and %D to generate comprehensive trading signals.
Optimal Entry Points: Designed to identify optimal entry points for trades, particularly in pairs trading.
Colored Area at Bottom:
This area provides two easy-to-read functions:
Color:
Green: Upward momentum (ratio above 1)
Red: Downward momentum (ratio below 1)
Height:
Higher in green: Stronger upward momentum
Lower in red: Stronger downward momentum
Legend:
Green Line: DI+ (Positive)
Red Line: DI- (Negative)
Black Line: ADX
How to Read This Indicator:
1) Trend Direction:
DI+ above DI-: Indicates an upward trend.
DI- above DI+: Indicates a downward trend.
2) Trend Strength:
ADX below 20: Indicates a neutral trend.
ADX between 20 and 25: Indicates a weak trend.
ADX above 25: Indicates a strong trend.
Trading Signals in Pairs Trading:
Neutral Trend: Ideal for pairs trading when no strong trend is detected.
Overbought/Oversold: Uses %K and %D to identify overbought/oversold conditions that support trade decisions.
Entry Signals: Green signals for long positions, red signals for short positions, based on combined criteria of neutral trend strength and supportive momentum.
Application in Pairs Trading:
Neutral trend: In pairs trading strategies, where neutral movement is often sought, this indicator provides signals that are especially relevant during periods of neutral trend strength and supportive momentum, aiding traders in identifying optimal entry
Risk Management: Combining signals from ADX, DI+, DI-, %K, and %D helps traders make more informed decisions regarding entry points, enhancing risk management.
Example Chart (The indicator is on the upper right corner):
Clean Presentation: The chart only includes the necessary elements to demonstrate the indicator’s functionality.
Demonstrates: Overbought/oversold conditions, upward/downward/no momentum, and trading signals with/without specific scenarios.

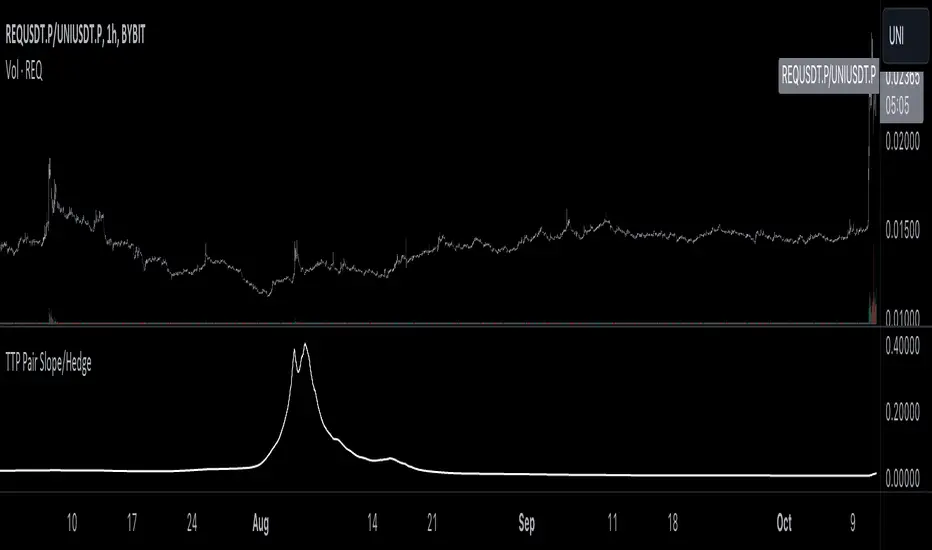
TTP Pair Slope/HedgePair slope/hedge uses linear regression to calculate the hedge ratio (slope) between the two assets within a period.
It allows you to specify a "from" and a "to" candle.
Example:
"A regression from 1000 candles back in time and ignore the last 100 candles. This would result in making a regression of 900 candles in total."
The formula used to perform the regression with the assts X and Y is:
Hedge =
mean( (X-mean(X))^2 )
——————————————————
mean( (X-mean(X)) * (Y-mean(Y)) )
You can later use the hedge in a chart of X - Hedge * Y
(Confirm with 1 / hedge )
If the plot is stationary the period tested should look like stationary.
If you cross an imaginary horizontal line across all the values in the period used it should look like a flat channel with values crossing above and below the line.
The purpose of this indicator is to help finding the linear regression test used for conintegration analysis. Conintegration assets is one of the requirements to consider assets for pair and hedge trading.
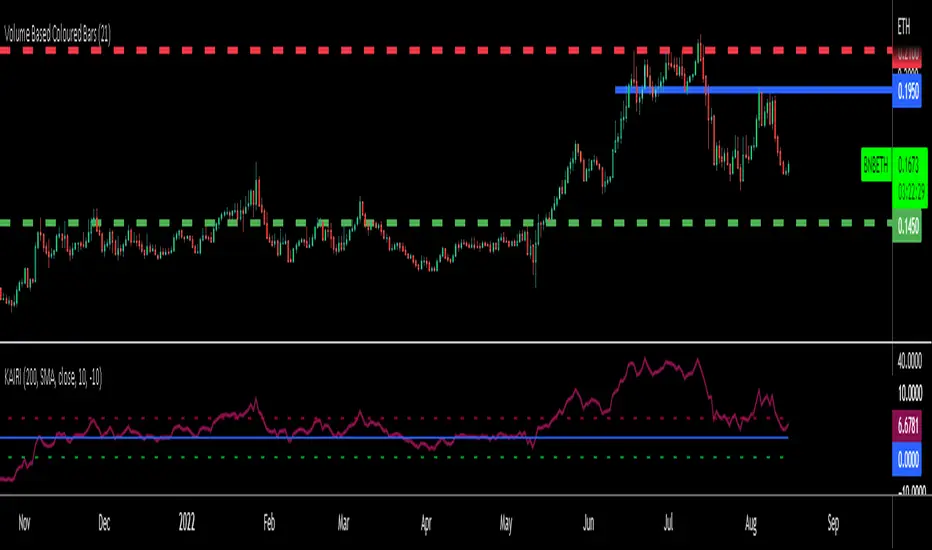
KAIRI RELATIVE INDEXAn old but gold Japanese indicator for Mean Reverting strategies and ideal for Pairs Trading...
The Kairi Relative Index measures the distance between closing prices and a Moving Average in percent value (generally SMA).
Extreme reading in the KRI are considered buy and sell signals.
Extreme readings will vary by asset, with more volatile assets reaching much higher and lower extremes that more sedate assets.
The KRI is not an accurate timing signal, and therefore, should be combined with other forms of analysis to generate trade signals.
You can calculate percent difference between the price and 10 different types of Moving Averages in this version of KAIRI as:
SMA : Simple Moving Average
EMA : Exponential Moving Average
WMA : Weighted Moving Average
TMA : Triangular Moving Average
VAR : Variable Index Dynamic Moving Average a.k.a. VIDYA
WWMA : Welles Wilder's Moving Average
ZLEMA : Zero Lag Exponential Moving Average
TSF : True Strength Force
HULL : Hull Moving Average
VWMA: Volume Veighted Moving Average
Personal advice: try using bigger length of Moving Averages like 50-100-200 for pairs and mean reversion strategies