PCE Inflation Monitor (Change YoY & MoM)📊 PCE Inflation Monitor - The Fed's Most Important Metric
Personal Consumption Expenditures (PCE) is the Federal Reserve's preferred inflation measure and THE metric they target for their 2% inflation goal. If you want to predict Fed policy, you need to watch PCE.
🎯 KEY FEATURES:
- Dual Perspective Analysis:
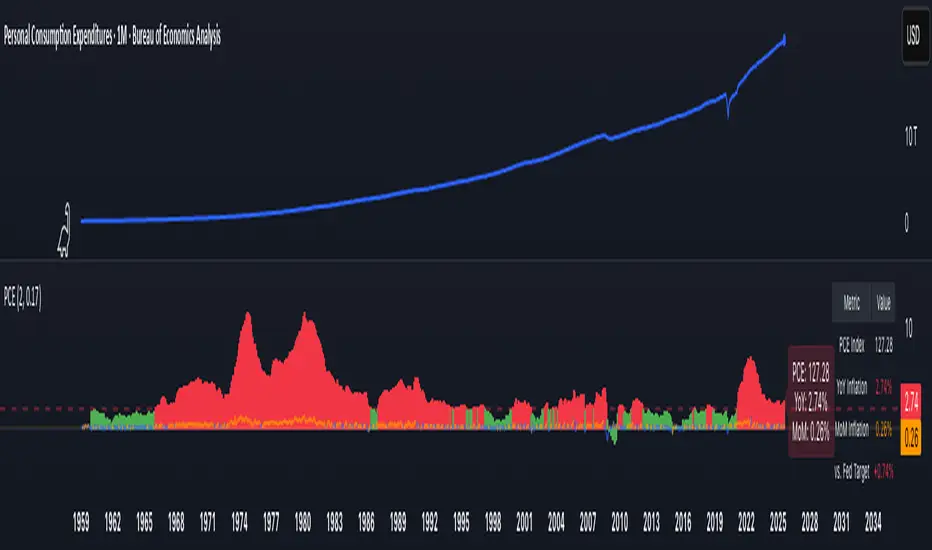
- Year-over-Year (YoY): Histogram bars showing annual PCE inflation
- Month-over-Month (MoM): Line overlay showing monthly consumption price changes
- Visual Reference System:
- Dashed line at 2% (Fed's official PCE inflation target)
- Dotted line at 0.17% (equivalent monthly target)
- Color-coded bars: Red above Fed target, Green below target
- Real-Time Data Table:
- Current PCE Index value
- YoY inflation rate vs. Fed's 2% target
- MoM inflation rate with color coding
- Exact deviation from Fed target (critical for policy predictions)
- Automated Alerts:
- PCE crosses Fed's 2% target (major policy signal!)
- MoM crosses monthly target
- Stay informed of Fed-relevant inflation changes
📈 WHY PCE IS DIFFERENT (AND MORE IMPORTANT):
PCE vs. CPI differences:
- Flexible basket: PCE adjusts for substitution (beef → chicken if prices rise)
- Broader coverage: Includes healthcare paid by insurance/government
- Lower readings: Typically 0.2-0.4% below CPI
- Fed's choice: Explicitly stated as their target metric
Most importantly: When Powell speaks about "our 2% target," he means PCE, not CPI!
🔍 TRADING IMPLICATIONS:
PCE Above 2% (Red Zone):
→ Fed under pressure to maintain/raise rates
→ Hawkish policy stance likely
→ Negative for growth stocks, crypto
→ Positive for USD, bearish for gold
PCE Below 2% (Green Zone):
→ Fed has flexibility to cut rates
→ Dovish policy stance possible
→ Positive for risk assets, growth stocks
→ Negative for USD, bullish for commodities
PCE Approaching 2% from Above:
→ Fed "mission accomplished" narrative
→ Rate cut cycle becomes possible
→ Major bullish signal for equities/crypto
💡 ADVANCED STRATEGIES:
1. Fed Meeting Preparation: Check PCE before FOMC meetings for policy clues
2. Dot Plot Predictions: PCE trend determines Fed's rate forecast updates
3. Pivot Timing: When PCE MoM turns negative, Fed pivot becomes realistic
4. Press Conference Analysis: Compare Powell's comments to PCE deviation
🎯 KEY LEVELS TO WATCH:
- 2.0% YoY: Fed's official target - crossing this level is major news
- 2.5% YoY: "Uncomfortably high" - Fed forced to stay restrictive
- 3.0% YoY: "Crisis mode" - Fed turns very hawkish
- 1.5% YoY: "Below target" - Rate cuts become likely
🔄 COMBINE WITH:
- CPI: Public perception vs. Fed's metric (often diverge)
- Core PCE: Even more important (excludes food/energy volatility)
- Fed Funds Rate: Is Fed responding appropriately to PCE?
📊 DATA SOURCE:
Official PCE data from FRED (Federal Reserve Economic Data), updated monthly typically in the last week of each month (after CPI/PPI releases).
🎨 CUSTOMIZATION:
Fully customizable:
- Toggle YoY/MoM displays
- Adjust Fed target if needed
- Customize colors
- Show/hide absolute PCE values
Perfect for: Fed watchers, macro traders, policy analysts, and serious investors who want to predict monetary policy changes before they happen.
⚠️ CRITICAL INSIGHT: While media focuses on CPI, the Fed focuses on PCE. Trade what the Fed trades, not what the headlines say.
🎓 Pro Tip: Fed members often mention "Core PCE" (excluding food/energy). Consider adding that indicator alongside this one for complete Fed policy analysis.
PCE
[Tommy's Inflation Index]#Inflation #FEDWATCH #FA
Hello dear beloved Traders and Investors around the world! As you are aware, the world is on a fierce battle against the inflation caused by the massive QE (Quantitative Easing) after the pandemic. All we see on the news is about this very world-wide fiscal phenomenon and how central bank of each nation are controlling it with their monetary policies. Consequently, FED’s hawkish stance to maintain tightening position has suppressed our market. The interest rates have spiked more rapidly than ever absorbing all the cash in the market.
The confrontation between Inflation Vs. Recession currently is the most integral and yet complex issue that needs to be wisely dealt with. Anyhow, whether we want it or not, the markets are being directly impacted by the tension of this inflation war. Hence, traders and investors should keep our eyes on the circumstances and trends of macro-economy to possibly comprehend, forecast, and prepare for the upcoming events. Economic indexes and data are always to be regularly monitored. Especially, inflation related indexes such as CPI (Consumer Price Index), PCE (Personal Consumption Expenditure), PPI (Produce Price Index) and Michigan inflation have stronger interrelation with the market these days.
Tradingview provides many economic indexes and data as you can see in the economy sector of the symbol search. I have found it quite useful to track the macro economy analyzing these data. As globally, people generally refer to the YoY (Year over year) and MoM (Month over month) since the relative percentage change rate is the key factor. There are raw data of CPI, PCE, PPI as well as the core of all these etc. on Tradingview. But unfortunately, there are no YoY and MoM (Only a few) data. Don’t worry. Today is your lucky day because I made them myself for you.
Today I wish to share the “Inflation Index” that I have been working during the Korean’s New Year Holidays. It automatically computes and visualizes the CPI, core CPI, PCE, core PCE, PPI, and core PPI both YoY and MoM. It might show you wrong values or errors if your chart is not on Monthly timeframe. By the way core inflation is goods and services sectors, excluding food and energy. If you check ‘Core or not?’ box, it distinguishes the regular and core indexes. I am going to regularly update this inflation index on pine script, so go ahead. It’s all yours!
Your subscription, likes, and comments inspire me a lot!
#인플레이션 #연준 #FA
안녕하세요 트레이더 여러분 토미입니다!
과도한 양적완화 여파로 생긴 인플레이션 사태를 잡기 위해 미국 연준을 포함한 각국의 중앙은행은 이례적으로 강력한 긴축정책을 펼치고 있습니다. 특히 그 어느때보다 연준의 FOMC 회의 및 기준 금리 변경 사안에 영향을 미칠 만한 여러 경제 지표들에 시장이 민감하게 반응하는 실정입니다. 여기 계신 분이라면 요즘 CPI(소비자물가지수), PCE(개인소비지출물가지수), PPI(생산자물가지수), 그리고 미시간 물가지수 등 미국 인플레이션 관련 지수들이 얼마나 중요한지 알고 계시리라 생각합니다. 코인, 주식, 선물 등 종목을 불문하고 우리가 원하던 원하지 않던 애네들 발표될 때마다 시장이 미친듯이 요동치는 사실은 부정할 수 없습니다.
최근 트레이딩뷰도 많은 경제 지표들을 제공해주고 있습니다. 우리가 자주 보는 CPI, PCE, 그리고 PPI도 있지만 우리가 통상적으로 참고하는 인플레이션 수치는 해당 지표들의 YoY(전년대비)와 MoM(전월대비)입니다. 아쉽게 트레이딩뷰에는 YoY와 MoM 수치가 없어서 대부분 뭐 인베스팅닷컴이나 구글 이런 곳에서 보셨을 겁니다. 그래서 그냥 제가 트레이딩뷰에서도 쉽게 열람할 수 있게 만들어버렸습니다. CPI, PCE, PPI, 근원 CPI, 근원 PCE, 그리고 근원 PPI의 YoY와 MoM 지수를 쉽게 볼 수 있게 디자인했습니다. 설날에 집에 짱박혀서 코딩만 했네요. 차트 상단 지표(Indicator)에 Tommy’s Inflation Index 검색 후 클릭하시면 사용하실 수 있습니다. 참고로 차트가 월봉으로 되어있지 않으면 오류가 발생할 가능성이 높으니 이 점 양해바랍니다. 지표 즐겨찾기에 추가 해놓고 중간중간 필요할 때 켜서 보시면 될 것 같습니다. 이 지표는 제가 주기적으로 업데이트 할 예정이니 앞으로도 많은 관심 부탁드립니다.
여러분의 구독, 좋아요, 댓글은 저에게 큰 동기부여가 된답니다~

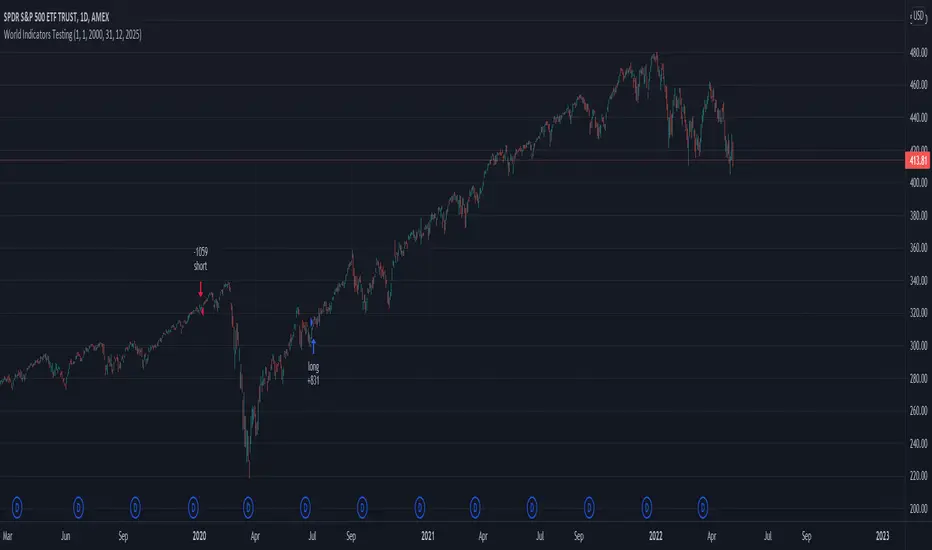
Swing Stock designed for Monthly/Yearly Trading This is a strategy tester designed around the most important data from FRED - Federal Reserve Economic Data
As input data, we have:
// Personal Consumption Expenditures
// Real Retail and Food Services Sales
// Leading Index for the United States
// All Employees: Total Nonfarm Payrolls
// Real Gross Domestic Product
// Gross Domestic Product
I adapted the long and short entry based on the GDP data, since they are most accurate in prediction compared to the rest.
However, feel free to test with other as well if you want.
For this test I compared previous GDP values, if they were higher than previous that represent a long signals, if they were smaller that represents a reversal=short signal.
From the tests performed we can see that GDP is highly accurate and overall as long as there is patience, profits are going to be make, sometimes even beat the index itself.
If you have any questions, let me know !