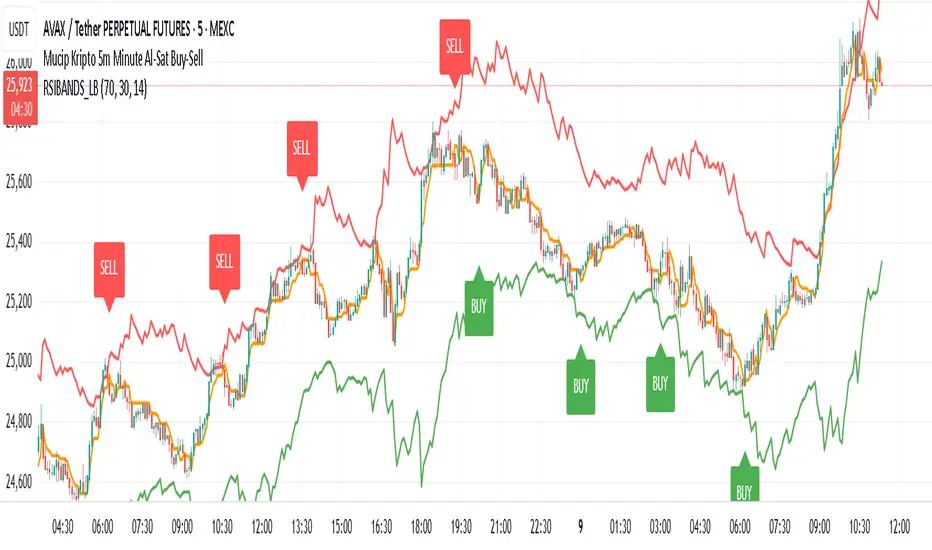
Mucip Kripto 5m Minute Al-Sat Buy-Sell
“This is the technique I use on major cryptocurrencies in the 5-minute timeframe. I combine it with RSI Bands. It can be improved further, and I’m open to ideas.”
Su Pine
Cumulative Returns by Session [BackQuant]Cumulative Returns by Session
What this is
This tool breaks the trading day into three user-defined sessions and tracks how much each session contributes to return, volatility, and volume. It then aggregates results over a rolling window so you can see which session has been pulling its weight, how streaky each session has been, and how sessions relate to one another through a compact correlation heatmap.
We’ve also given the functionality for the user to use a simplified table, just by switching off all settings they are not interested in.
How it works
1) Session segmentation
You define APAC, EU, and US sessions with explicit hours and time zones. The script detects when each session starts and ends on every intraday bar and records its open, intraday high and low, close, and summed volume.
2) Per-session math
At each session end the script computes:
Return — either Percent: (Close−Open)÷Open×100(Close − Open) ÷ Open × 100(Close−Open)÷Open×100 or Points: (Close−Open)(Close − Open)(Close−Open), based on your selection.
Volatility — either Range: (High−Low)÷Open×100(High − Low) ÷ Open × 100(High−Low)÷Open×100 or ATR scaled by price: ATR÷Open×100ATR ÷ Open × 100ATR÷Open×100.
Volume — total volume transacted during that session.
3) Storage and lookback
Each day’s three session stats are stored as a row. You choose how many recent sessions to keep in memory. The script then:
Builds cumulative returns for APAC, EU, US across the lookback.
Computes averages, win rates, and a Sharpe-like ratio avgreturn÷avgvolatilityavg return ÷ avg volatilityavgreturn÷avgvolatility per session.
Tracks streaks of positive or negative sessions to show momentum.
Tracks drawdowns on cumulative returns to show worst runs from peak.
Computes rolling means over a short window for short-term drift.
4) Correlation heatmap
Using the stored arrays of session returns, the script calculates Pearson correlations between APAC–EU, APAC–US, and EU–US, and colors the matrix by strength and sign so you can spot coupling or decoupling at a glance.
What it plots
Three lines: cumulative return for APAC, EU, US over the chosen lookback.
Zero reference line for orientation.
A statistics table with cumulative %, average %, positive session rate, and optional columns for volatility, average volume, max drawdown, current streak, return-to-vol ratio, and rolling average.
A small correlation heatmap table showing APAC, EU, US cross-session correlations.
How to use it
Pick the asset — leave Custom Instrument empty to use the chart symbol, or point to another symbol for cross-asset studies.
Set your sessions and time zones — defaults approximate APAC, EU, and US hours, but you can align them to exchange times or your workflow.
Choose calculation modes — Percent vs Points for return, Range vs ATR for volatility. Points are convenient for futures and fixed-tick assets, Percent is comparable across symbols.
Decide the lookback — more sessions smooths lines and stats; fewer sessions makes the tool more reactive.
Toggle analytics — add volatility, volume, drawdown, streaks, Sharpe-like ratio, rolling averages, and the correlation table as needed.
Why session attribution helps
Different sessions are driven by different flows. Asia often sets the overnight tone, Europe adds liquidity and direction changes, and the US session can dominate range expansion. Separating contributions by session helps you:
Identify which session has been the main driver of net trend.
Measure whether volatility or volume is concentrated in a specific window.
See if one session’s gains are consistently given back in another.
Adapt tactics: fade during a mean-reverting session, press during a trending session.
Reading the tables
Cumulative % — sum of session returns over the lookback. The sign and slope tell you who is carrying the move.
Avg Return % and Positive Sessions % — direction and hit rate. A low average but high hit rate implies many small moves; the reverse implies occasional big swings.
Avg Volatility % — typical intrabars range for that session. Compare with Avg Return to judge efficiency.
Return/Vol Ratio — return per unit of volatility. Higher is better for stability.
Max Drawdown % — worst cumulative give-back within the lookback. A quick way to spot riskiness by session.
Current Streak — consecutive up or down sessions. Useful for mean-reversion or regime awareness.
Rolling Avg % — short-window drift indicator to catch recent turnarounds.
Correlation matrix — green clusters indicate sessions tending to move together; red indicates offsetting behavior.
Settings overview
Basic
Number of Sessions — how many recent days to include.
Custom Instrument — analyze another ticker while staying on your current chart.
Session Configuration and Times
Enable or hide APAC, EU, US rows.
Set hours per session and the specific time zone for each.
Calculation Methods
Return Calculation — Percent or Points.
Volatility Calculation — Range or ATR; ATR Length when applicable.
Advanced Analytics
Correlation, Drawdown, Momentum, Sharpe-like ratio, Rolling Statistics, Rolling Period.
Display Options and Colors
Show Statistics Table and its position.
Toggle columns for Volatility and Volume.
Pick individual colors for each session line and row accents.
Common applications
Session bias mapping — find which window tends to trend in your market and plan exposure accordingly.
Strategy scheduling — allocate attention or risk to the session with the best return-to-vol ratio.
News and macro awareness — see if correlation rises around central bank cycles or major data releases.
Cross-asset monitoring — set the Custom Instrument to a driver (index future, DXY, yields) to see if your symbol reacts in a particular session.
Notes
This indicator works on intraday charts, since sessions are defined within a day. If you change session clocks or time zones, give the script a few bars to accumulate fresh rows. Percent vs Points and Range vs ATR choices affect comparability across assets, so be consistent when comparing symbols.
Session context is one of the simplest ways to explain a messy tape. By separating the day into three windows and scoring each one on return, volatility, and consistency, this tool shows not just where price ended up but when and how it got there. Use the cumulative lines to spot the steady driver, read the table to judge quality and risk, and glance at the heatmap to learn whether the sessions are amplifying or canceling one another. Adjust the hours to your market and let the data tell you which session deserves your focus.

AVWAP (ATR-Weighted VWAP) IndicatorAVWAP (Average True Range Weighted Average Price), you typically combine two core indicators:
1. VWAP (Volume Weighted Average Price)
This is the base indicator that calculates the average price weighted by volume over a session or specified period.
VWAP serves as the core reference price level around which volatility adjustments are made for AVWAP.
2. ATR (Average True Range)
ATR measures market volatility, representing the average price range over a set period.
ATR is used to create volatility bands or buffers around the VWAP, adjusting levels to reflect prevailing market volatility.
How These Indicators Work Together for AVWAP:
Use VWAP to establish your average price line weighted by volume.
Calculate ATR to understand the average price movement range.
Apply ATR as multipliers to VWAP to create upper and lower volatility-adjusted bands (e.g., VWAP ± 1 × ATR), which form the AVWAP bands.
These bands help identify volatility-aware support/resistance and stop-loss placement zones.
So to make things easier I have built a custom AVWAP indicator to be used
How to use my custom indicator:
The central blue line is the VWAP.
The red and green bands above and below VWAP are AVWAP bands set at VWAP ± 1.5 × ATR by default.
Adjust the ATR length and multiplier inputs to suit the timeframe and volatility preferences.
Use the bands as dynamic support/resistance and for setting stop loss zones based on volatility.

عكفة الماكد المتقدمة - أبو فارس ©// 🔒 Advanced MACD Curve © 2025
// 💡 Idea & Creativity: Engineer Abu Elias
// 🛠️ Development & Implementation: Abu Fares
// 📜 All intellectual rights reserved - Copying, modifying, or redistributing is not permitted
// 🚫 Any attempt to tamper with this code or violate intellectual property rights is legally prohibited
// 📧 For inquiries and licensing: Please contact the developer, Abu Fares

عكفة الماكد المتقدمة - أبو فارس ©// 🔒 عكفة الماكد المتقدمة © 2025
// 💡 فكرة وإبداع: المهندس أبو الياس
// 🛠️ تطوير وتنفيذ: أبو فارس
// 📜 جميع الحقوق الفكرية محفوظة - لا يُسمح بالنسخ أو التعديل أو إعادة التوزيع
// 🚫 أي محاولة للعبث بهذا الكود أو انتهاك الحقوق الفكرية مرفوضة قانونياً
// 📧 للاستفسارات والتراخيص: يرجى التواصل مع المطور أبو فارس
// 🔒 Advanced MACD Curve © 2025
// 💡 Idea & Creativity: Engineer Abu Elias
// 🛠️ Development & Implementation: Abu Fares
// 📜 All intellectual rights reserved - Copying, modifying, or redistributing is not permitted
// 🚫 Any attempt to tamper with this code or violate intellectual property rights is legally prohibited
// 📧 For inquiries and licensing: Please contact the developer, Abu Fares

SMC Pro (Wellington) v1.4.2This SMC indicator combines BOS/CHoCH, OBs, FVGs, liquidity, and Premium/Discount with confirmation on the 1H (EMA200).
Entries only appear when 3+ confluences align, filtering noise and delivering clear signals.
✅ Ready-to-use alerts (LONG, SHORT, or unified)
✅ Real-time HUD
✅ Strategy tailored for XAUUSD

Fearless R:RFearless R:R – Precision Risk/Reward Visualization
Fearless R:R is a clean and powerful risk management tool designed to help traders plan and execute trades with discipline. It lets you set your Entry, Take Profit, and Stop Loss levels directly on the chart, then automatically calculates and displays:
Risk/Reward ratio in real-time
Percentage distance to TP and SL
Position sizing based on account equity and risk %
Fees and slippage impact
Current P/L tracking as price moves
The indicator also anchors your setup visually on the chart with shaded RR zones, price-scale labels, and a compact info table. Dedicated alert conditions are included for Entry Hit, Take Profit Hit, and Stop Loss Hit, allowing you to automate trade management notifications.
Whether you’re scalping or swing trading, Fearless R:R keeps your focus on structured decision-making and consistent execution.

Trend Exhaustion Signals AjayFx - CypherTradingNetworkExhaustion Signals at trend exhaustion points. Is a work in progress with tweaks and stuff but will get there.

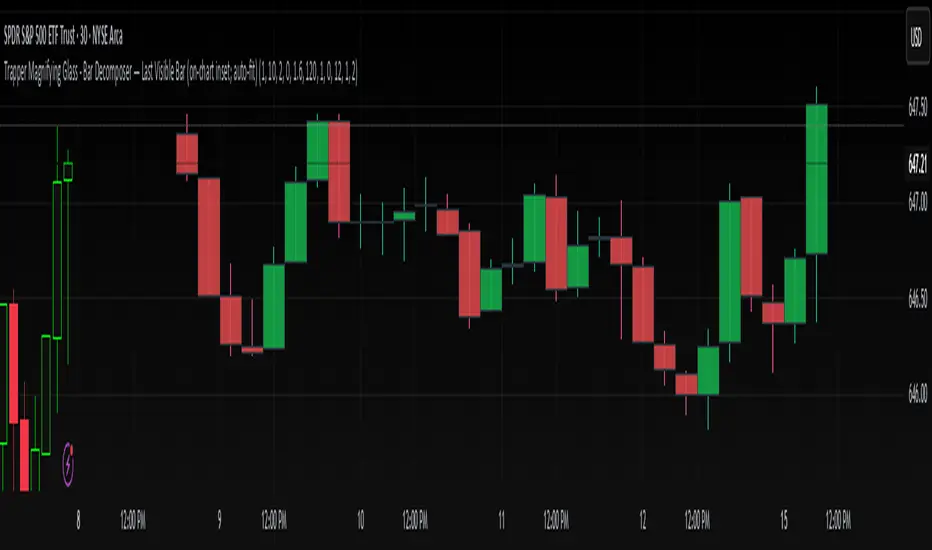
Trapper Magnifying Glass - Bar Decomposer — Last Visible BarHeadline
Decompose any higher-timeframe bar into lower-timeframe candles directly on the chart. Zoom/pan reactive, session-accurate, auto-fit inset, and compliant with TradingView placement limits.
Quick Start
Add the indicator and choose a Child TF (minutes) (e.g., 1, 5, 10, 15).
The inset follows the last visible bar on your screen. Adjust Right separation / Mini width / Gap / Vertical exaggeration as needed.
Leave Show HUD label OFF by default. Turn it on only if you want a compact readout.
Overview
This tool draws a miniature, on-chart inset of lower-timeframe candles that make up the currently viewed higher-timeframe bar. It stays on the main price chart (not in a separate pane), respects zoom/pan, compresses itself to fit available space, and adheres to TradingView’s 500-bar object placement limit.
The design goal is micro-structure inspection without changing the chart timeframe.
What Makes It Different
On-chart inset (not a separate indicator panel) for true visual context.
Zoom/Pan reactive to the last visible bar — works naturally as you navigate.
Auto-fit logic keeps the inset readable while staying inside TradingView’s future-bars limit.
Session-accurate decomposition: uses TradingView’s own lower-timeframe OHLC, exactly within the parent bar’s time window.
Strictly compliant: no synthetic bars, no repaint tricks, no lookahead.
How It Works
Child data is fetched with request.security_lower_tf(syminfo.tickerid, , open/high/low/close).
Only closed lower-TF bars inside the parent bar’s time window are returned by TradingView.
The script maps each child bar to an inset candle (body + wick) scaled to the parent bar’s price range and placed to the right of the parent’s position.
The inset tracks the last visible bar so it always stays relevant to what you’re inspecting.
Inputs (Defaults)
Timeframes
Child TF (minutes): 1 (min 1, max 1440)
Layout
Right separation (bars): 10
Mini candle width (bars): 2
Gap between mini candles (bars): 0
Vertical exaggeration ×: 1.6
Auto-Fit
Auto-fit inset width: ON
Max bars ahead to use: 120
Minimum mini width: 1
Minimum gap: 0
Style
Bull/Bear colors: ON
Body Bull / Body Bear / Wick Bull / Wick Bear: configurable
Body Fill Opacity (0–100): 12
Outline color: dark grey
Outline width: 1
Wick width: 2
HUD
Show HUD label: OFF (recommended default; enable only when you need a summary)
Session Behavior (Important)
TradingView constructs bars strictly by exchange sessions. For US equities (regular session 09:30–16:00, 390 minutes):
On a 1h chart you will see 7 bars per day:
09:30–10:00 (30 minutes)
10:00–11:00, 11:00–12:00, 12:00–13:00, 13:00–14:00, 14:00–15:00 (five full hours)
15:00–16:00 (full hour)
Decomposing the 09:30–10:00 bar into 1m returns 30 minis (not 60).
Decomposing 10:00–11:00 returns 60 minis, as expected.
The last hour (15:00–16:00) decomposes to 60 minis once they exist (i.e., immediately after each child bar closes). If you are mid-session, you will see only the minis that have closed so far.
This is by design and ensures the inset reflects the true lower-timeframe structure TradingView has for that exact bar window. Nothing is synthesized.
Live vs Confirmed Bars
Confirmed bars (historical) always decompose to a full, correct count of child minis for that parent window.
Live bars (currently forming) only return child minis that have already closed. Mid-hour on a 1h chart with 10m children, you might see 3, 4, or 5 minis depending on elapsed time.
This script’s default experience focuses on the last visible bar and displays whatever the platform provides at that moment. The HUD (when enabled) includes the parent bar duration in minutes to make short session bars explicit.
Auto-Fit and Placement Limits
TradingView prevents drawing objects beyond 500 bars into the future. The inset’s right edge is automatically clamped to stay within that boundary. If the requested number of minis would overflow the allowed space, the script proportionally compresses mini width/gap (down to your configured minimums). If necessary, it draws only as many minis as safely fit — favoring stability over clutter.
Styling Tips
For dense decompositions (e.g., 1m inside 1h), set:
Mini width = 1, Gap = 0, Auto-fit = ON, Right separation = 7–12.
Increase Vertical exaggeration to highlight wick-to-body differences when the parent bar is narrow.
Keep HUD OFF for publishing and screenshots unless you’re highlighting counts or session duration.
Notes & Limitations
Child arrays show closed bars only. No forming mini is displayed to avoid misleading totals.
If you reload a chart or switch symbols/timeframes, the most recent confirmed bar’s arrays may be empty on the very first calculation frame; the script guards against this and will draw on the next update.
The tool is an overlay visualization, not a signal generator; there are no alerts or trading advice.
Performance: heavy decompositions on very fast symbols/timeframes can add many objects. Auto-fit and minimal widths help.
Compliance
Uses only native TradingView data (request.security_lower_tf).
No repainting and no lookahead.
No external feeds, synthetic candles, or hidden calculations that would misrepresent the underlying data.
Fully respects TradingView’s object placement constraints.
Recommended Defaults (for broad usability)
Child TF: 5 or 15 (depending on your HTF).
Right separation: 7–12
Mini width / Gap: 2 / 0 for clarity, 1 / 0 for dense fits.
Auto-fit: ON
HUD: OFF
Troubleshooting
“Why aren’t there 60 one-minute minis in this 1h bar?”
Either the parent bar is a session-short bar (09:30–10:00 = 30 minutes) or you are viewing a live bar mid-hour; only closed minis appear.
Inset clipped or not visible to the right:
Increase Max bars ahead to use (Auto-Fit group), reduce Mini width/Gap, or reduce Right separation.
Nothing draws on first load:
Wait for the next bar update, or navigate the chart so the last visible bar changes; arrays refresh as data becomes available.
Change Log
v1.0 – Initial public release.
On-chart inset, zoom/pan reactive, auto-fit width.
Session-accurate lower-TF decomposition.
HUD label toggle (off by default) with child TF, bar count, and parent duration.
Hardened array handling for confirmed snapshots.
Disclaimer
This script is provided strictly for educational and informational purposes only.
It does not constitute financial advice, investment advice, trading signals, or a recommendation to buy or sell any security, asset, or instrument. Trading and investing involve risk; always do your own research and consult with a licensed financial professional before making decisions.
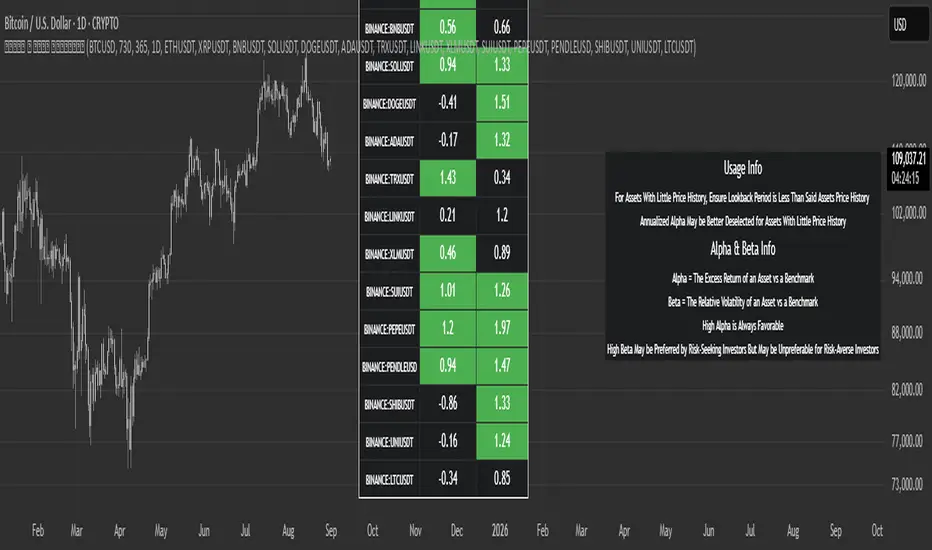
Financial Risk AlphaHere’s the description in English, formatted with ` ` for TradingView:
---
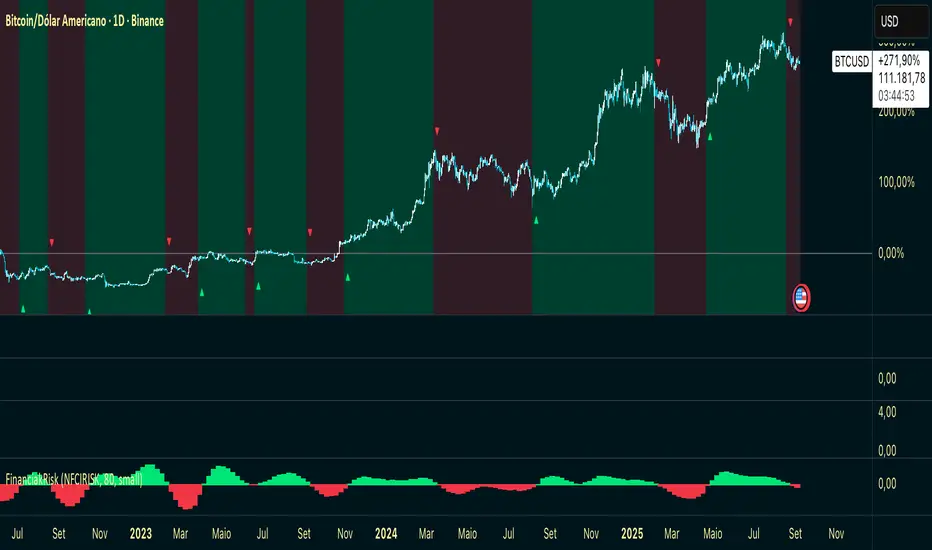
\ Financial Risk Alpha\ is a macroeconomic indicator that tracks weekly changes in the \ NFCI Risk Index\ (Federal Reserve).
It translates shifts in financial conditions into an easy-to-read histogram:
* \ Green bars\ → Loosening of financial conditions (risk-on environment).
* \ Red bars\ → Tightening of financial conditions (increased systemic risk).
* \ Background shading\ in translucent green/red (CS Alpha style), highlighting the prevailing liquidity regime.
* \ Visual signals\ : \ green arrows below\ the price when conditions flip to risk-on, and \ red arrows above\ the price when conditions flip to risk-off.
\ Usage\ :
Financial Risk Alpha is designed for traders and analysts seeking to align their strategies with global financial risk dynamics. It serves as an \ early warning tool\ for shifts in risk appetite, helping anticipate potential turning points in the market.
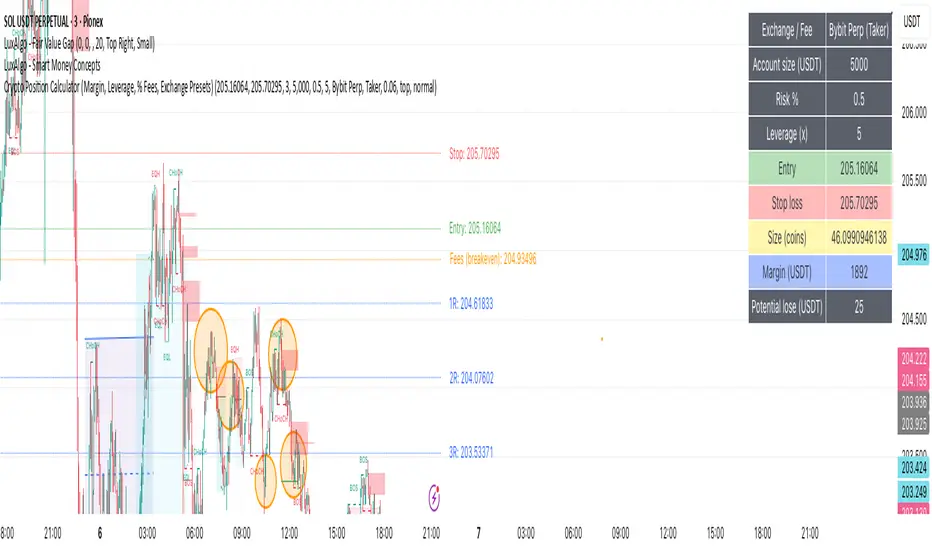
Crypto Position CalculatorAlpha2Million - Crypto Position Calculator (Margin, Leverage, % Fees, Exchange Presets)
This script is a crypto trading risk & position calculator built directly into TradingView.
It helps futures/perpetual traders size positions, calculate margin requirements, and visualize risk-to-reward levels on the chart — with exchange fee presets for real-world accuracy.
• Position Sizing by Risk %
• Enter account size and % risk per trade.
• Script calculates exact position size (coins) based on SL distance.
• Leverage & Margin
• Shows required notional and margin (USDT) for the trade.
• Exchange Fee Presets
• Supports Binance, Bybit, Pionex, MEXC, Gate.io, KuCoin, HTX.
• Maker vs Taker fee selection.
• Custom option to enter your own per-side fee %.
• Fee Breakeven Line (Orange)
• Plots the exact price level you need to reach to cover entry + exit fees.
• Lets you see how far price must move before you are at true breakeven.
• Risk vs Reward Calculation
• Risk is calculated on price movement only (SL distance).
• Profit targets include fees, so “1R / 2R / 3R (net)” lines show realistic levels.
• Smart Table Display
• Account size, leverage, entry, stop, target.
• Position size (coins), notional (USDT), required margin.
• Risk at SL, fees (round trip), fee breakeven move/price.
• Profit @ TP (after fees) and net RR.
Retail Sentiment Indicator - Multi-Asset CFD & Fear/Greed IndexRetail Sentiment Indicator - Multi-Asset CFD & Fear/Greed Index
Overview
The Retail Sentiment Indicator provides real-time sentiment data for major financial instruments including stocks, forex, commodities, and cryptocurrencies. This indicator displays retail trader positioning and market sentiment using CFD data and fear/greed indices.
Methodology and Scale Calculation
This indicator operates on a **-50 to +50 scale** with zero representing perfect market equilibrium.
Scale Interpretation:
- **Zero (0)**: Market balance - exactly 50% of investors buying, 50% selling
- **Positive values**: Majority buying pressure
- Example: If 63% of investors are buying, the indicator shows +13 (63 - 50 = +13)
- **Negative values**: Majority selling pressure
- Example: If 92% of investors are selling, the indicator shows -42 (50 - 92 = -42)
BTC Fear & Greed Index Scaling:
The original `BTC FEAR&GREED` index is natively scaled from 0-100 by its creator. In our indicator, this data has been rescaled to also fit the -50 to +50 range for consistency with other sentiment data sources.
This unified scaling approach allows for direct comparison across all instruments and data sources within the indicator.
-Important Data Source Selection-
Bitcoin (BTC) Data Sources
When viewing Bitcoin charts, the indicator offers **two different data sources**:
1. **Default Auto-Mode**: `BTCUSD Retail CFD` - Retail CFD traders sentiment data (automatically loaded).
2. **Manual Selection**: `BTC FEAR&GREED` - Fear & Greed Index from website: alternative dot me
**To access BTC Fear & Greed Index**: Input settings -> disable checkbox "Auto-load Sentiment Data" -> manually select "BTC FEAR&GREED" from the dropdown menu.
US Stock Market Data Sources
For US stocks and indices (S&P 500, NASDAQ, Dow Jones), there are **two data source options**:
1. **Default Auto-Mode**: Individual retail CFD sentiment data for each instrument
2. **Manual Selection**: `SNN FEAR&GREED` - SNN's Fear & Greed Index covering the overall US market sentiment. SNN was used as the name to avoid any potential trademark infringement.
**To access SNN Fear & Greed Index**: When viewing US market charts, disable in input settings checkbox "Auto-load Sentiment Data" and manually select "SNN FEAR&GREED" from the dropdown menu.
This distinction allows traders to choose between **instrument-specific retail sentiment** (auto-mode) or **broader market sentiment indices** (manual selection).
Features
- **Auto-Detection**: Automatically loads sentiment data based on the current chart symbol
- **Manual Selection**: Choose from 40+ supported instruments when auto-detection is unavailable
- **Multiple Data Sources**: Combines retail CFD sentiment with Fear & Greed indices
- **Visual Zones**: Clear greed/fear zones with color-coded backgrounds
- **Real-time Updates**: Live sentiment data from merged data sources
Supported Instruments
Major Indices
- S&P 500, NASDAQ, Dow Jones 30, DAX
Forex Pairs
- Major pairs: EURUSD, GBPUSD, USDJPY, USDCHF, USDCAD
- Cross pairs: EURJPY, GBPJPY, AUDUSD, NZDUSD, and 20+ others
Commodities
- Precious metals: Gold (XAUUSD), Silver (XAGUSD)
- Energy: WTI Oil
- Agricultural: Wheat, Coffee
- Industrial: Copper
Cryptocurrencies
- Bitcoin (BTC) sentiment data
- BTC & SNN Fear & Greed indices
How to Use
1. **Auto Mode** (Default): Enable "Auto-load Sentiment Data" to automatically display sentiment for the current chart symbol
2. **Manual Mode**: Disable auto-load and select from the dropdown menu for specific instruments
3. **Interpretation**:
- Values above 0 (green) indicate retail greed/bullish sentiment
- Values below 0 (red) indicate retail fear/bearish sentiment
- Fear & Greed indices use 0-100 scale (50 is neutral)
Data Sources
This indicator uses curated sentiment data from retail CFD providers and established fear/greed indices. Data is updated regularly and sourced from reputable financial data providers.
Trading Strategy & Market Philosophy
Contrarian Trading Approach
The primary purpose of this indicator is based on the fundamental market principle that **the majority of retail investors are often wrong**, and markets typically move opposite to the positions held by the majority of market participants.
Key Strategy Guidelines:
- **Contrarian Signal**: When the majority of users are positioned on one side of the market, there is statistically greater market advantage in taking positions in the opposite direction
- **Trend Exhaustion Signal**: An interesting observed phenomenon occurs when, during a long-lasting trend where the majority of investors have consistently been on the wrong side, the Sentiment indicator suddenly shows that the majority has flipped and opened positions in the direction of that long-running trend. This is often a signal of fuel exhaustion for further movement in that direction
Interpretation Examples
- High greed readings (majority bullish) → Consider bearish opportunities
- High fear readings (majority bearish) → Consider bullish opportunities
- Sudden sentiment flip during established trends → Potential trend reversal signal
Technical Notes
- Built with PineScript v6
- Dynamic symbol detection with fallback options
- Optimized for performance with minimal resource usage
- Color-coded visualization with customizable zones
Data Sources & Expansion
Acknowledgments
We extend our gratitude to **TradingView** for enabling the use of custom data feeds based on GitHub repositories, making this comprehensive sentiment analysis possible.
Data Expansion Opportunities
As the operator of this indicator, I am **open to suggestions for new data sources** that could be integrated and published. If you have ideas for additional instruments or sentiment data:
How to Submit Suggestions:
1. Send a **private message** with your proposal
2. Include: **instrument/data type**, **source**, and **brief description**
3. If technically feasible, we will work to import and publish the data
Data Infrastructure Status
Current Data Upload Process:
Please note that sentiment data uploads may occasionally experience minor interruptions. However, this should not pose significant issues as sentiment data typically changes gradually rather than rapidly.
Infrastructure Development:
We are actively working on establishing permanent cloud-based infrastructure to ensure continuous, automated data collection and upload processes. This will provide more reliable and consistent data availability in the future.
Disclaimer
This indicator is for educational and informational purposes only. Sentiment data should be used as part of a comprehensive trading strategy and not as the sole basis for trading decisions. Past performance does not guarantee future results. The contrarian approach described is a market theory and may not always produce profitable results.

Calculator - AOC📊 Calculator - AOC Indicator 🚀
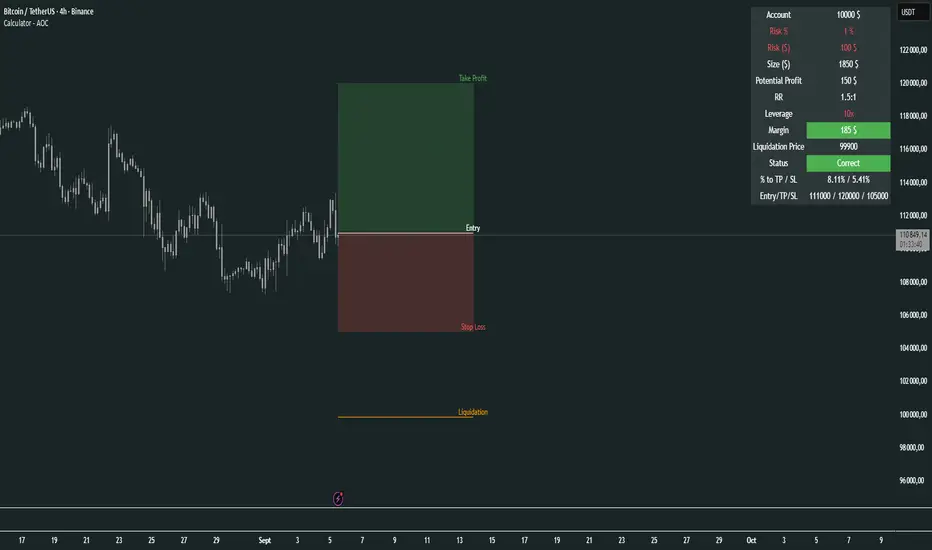
The Calculator - AOC indicator is a powerful and user-friendly tool designed for TradingView to help traders plan and visualize trades with precision. It calculates key trade metrics, displays entry, take-profit (TP), stop-loss (SL), and liquidation levels, and provides a clear overview of risk management and potential profits. Perfect for both novice and experienced traders! 💡
✨ Features
📈 Trade Planning: Input your Entry Price, Take Profit (TP), Stop Loss (SL), and Trade Direction (Long/Short) to visualize your trade setup on the chart.
💰 Risk Management: Set your Initial Capital and Risk per Trade (%) to calculate the optimal Position Size and Risk Amount for each trade.
⚖️ Leverage Support: Define your Leverage to compute the Required Margin and Liquidation Price, ensuring you stay aware of potential risks.
📊 Risk/Reward Ratio: Automatically calculates the Risk-to-Reward Ratio to evaluate trade profitability.
🎨 Visuals: Displays Entry, TP, SL, and Liquidation levels as lines and boxes on the chart, with customizable Line Width, Line Style, and Label Size.
✅ Trade Validation: Checks if your trade setup is valid (e.g., correct TP/SL placement) and highlights issues like potential liquidation risks with color-coded statuses (Correct ✅, Incorrect ❌, or Liquidation ⚠️).
📋 Summary Table: A clean, top-right table summarizes key metrics: Capital, Risk %, Risk Amount, Position Size, Potential Profit, Risk/Reward, Margin, Liquidation Price, Trade Status, and % to TP/SL.
🖌️ Customization: Adjust Line Extension (Bars) for how far lines extend, and choose from Solid, Dashed, or Dotted line styles for a personalized chart experience.
🛠️ How to Use
Add to Chart: Apply the indicator to your TradingView chart.
Configure Inputs:
Accountability: Set your Initial Capital and Risk per Trade (%).
Target: Enter Entry Price, TP, and SL prices.
Leverage: Specify your leverage (e.g., 10x).
Direction: Choose Long or Short.
Display Settings: Customize Line Width, Line Style, Label Size, and Line Extension.
Analyze: The indicator plots Entry, TP, SL, and Liquidation levels on the chart and displays a table with all trade metrics.
Validate: Check the Trade Status in the table to ensure your setup is valid or if adjustments are needed.
🎯 Why Use It?
Plan Smarter: Visualize your trade setup and understand your risk/reward profile instantly.
Stay Disciplined: Precise position sizing and risk calculations help you stick to your trading plan.
Avoid Mistakes: Clear validation warnings prevent costly errors like incorrect TP/SL placement or liquidation risks.
User-Friendly: Intuitive visuals and a summary table make trade analysis quick and easy.
📝 Notes
Ensure Entry, TP, and SL prices align with your trade direction to avoid "Incorrect" or "Liquidation" statuses.
The indicator updates dynamically on the latest bar, ensuring real-time visuals.
Best used with proper risk management to maximize trading success! 💪
Happy trading! 🚀📈
VWAP + EMA50 + EMA200 (with optional Anchored VWAP)VWAP + EMA50 + EMA200 (with optional Anchored VWAP)

SMT Divergence in FVG (ES vs NQ)This indicator is designed to spot SMT Divergence inside of FVGs for ES and NQ

均线趋势过滤器 (MA_trend Signal/Noise Filter)双语简介
中文:
这款指标是一个基于“信噪比”思想的终极趋势过滤器。它通过比较快速和慢速EMA均线之间的差值(即信号)与ATR(平均真实波幅,代表噪音)来判断市场趋势。只有当信号的强度超过噪音的指定倍数时,才会确认趋势的有效性。该指标可帮助交易者过滤掉噪音,精确捕捉强势趋势,避免误操作。
English:
This indicator is the Ultimate Trend Filter based on the Signal-to-Noise ratio concept. It compares the difference between the fast and slow EMA (Signal) to the ATR (Noise) to determine market trends. A trend is confirmed only when the signal strength exceeds the noise by a specified multiplier. This indicator helps traders filter out noise and accurately capture strong trends, avoiding false signals.

FX Sessions (DTS)FX Sessions (DST-Safe)
This indicator highlights the four main Forex trading sessions — Sydney, Tokyo, London, and New York — using the local timezone of each market.
• DST handled automatically: Sessions shift correctly when London or New York move clocks forward/back.
• Clear visualization: Light background shading for each session, with the London–New York overlap emphasized for peak liquidity.
• Customizable: Toggle individual sessions, labels, and the on-chart legend table.
• Intraday focus: Works best on lower timeframes (1m–1h) for identifying active trading hours and volatility windows.
Use this tool to instantly spot when liquidity and volatility are likely to increase, so you know where to focus your trading.

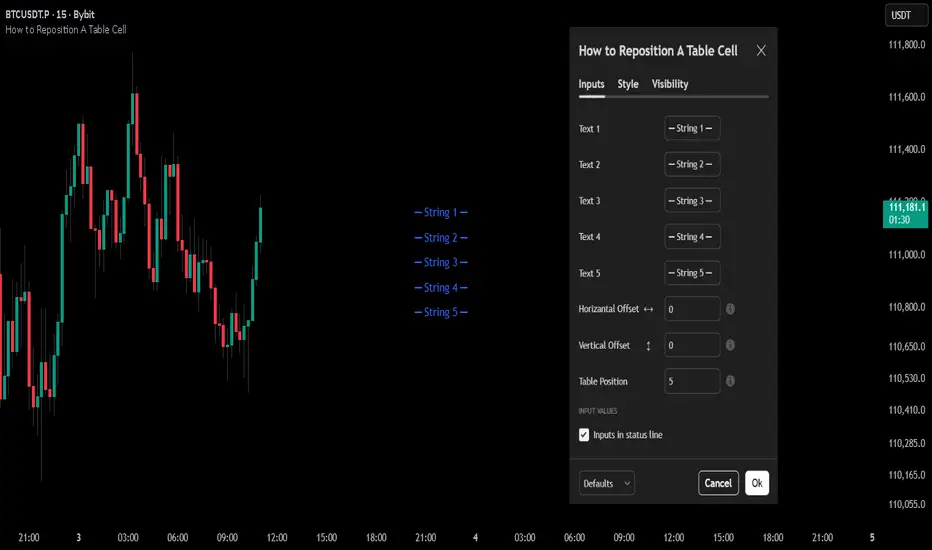
How to Reposition A Table CellOVERVIEW
Using table functions in Pine Script is one of the most effective methods for reporting and interpreting data in a readable manner. However, the built-in capabilities for dynamically repositioning table location are limited. To extend these limitations, a small intervention to the script may be required. This indicator exemplifies how such intervention can be modeled.
CONCEPTS
This indicator provides comprehensive control over table positioning through several user-defined parameters that work together to create flexible display options.
Text Parameters : These five string inputs allow users to define the content displayed in the table. Each parameter accepts custom text that will be displayed as separate rows within the table cell. (The relevant parameters are designed as examples. When implementing the code into your own scripts, you can use series string variables instead of the those inputs.)
Horizontal Offset : This integer parameter controls the horizontal positioning of the table content. Negative values shift the table content to the left, while positive values move it to the right. The offset is multiplied by a spacing factor (currently set to 4) to provide more noticeable movement. This parameter is particularly useful when you need to avoid overlapping with other chart elements or align multiple indicators.
Vertical Offset : This integer parameter manages the vertical positioning by adding line breaks above or below the content. Negative values push the content downward by adding line breaks at the beginning, while positive values elevate the content by adding line breaks at the end. This creates effective vertical spacing without affecting the table's base position.
Table Position : This parameter accepts values from 1 to 9, corresponding to the standard TradingView table positions arranged in a 3x3 grid format (1-3: top row, 4-6: middle row, 7-9: bottom row). This serves as the base positioning before any offset adjustments are applied, providing users with familiar reference points for initial placement.
FUNCTION
The core functionality centers on the custom f_position() function, which processes text positioning based on horizontal and vertical offset values. For vertical positioning, it adds line breaks before or after content depending on the offset direction. For horizontal positioning, it splits the text by rows and adds calculated spaces to each row, maintaining proper alignment across multi-line content. The spacing uses a fixed multiplier of 4, providing good balance between precision and visible movement.
ORIGINALITY & NOTES
Tihs indicator,
introduces a novel approach to table positioning that goes beyond TradingView's standard 9-position limitation by implementing custom offset calculations that allow pixel-level control over table placement.
serves as an educational resource, demonstrating advanced Pine Script techniques for UI manipulation that can be adapted for various custom indicator developments.
is particularly valuable for developers creating complex dashboard layouts or educational materials where precise positioning is crucial. The modular design of the positioning function makes it easily adaptable for other projects requiring similar functionality.
I hope it helps everyone, Always combine with risk management principles and market context awareness. I hope it helps everyone. Trade as safely as possible. Best of luck!
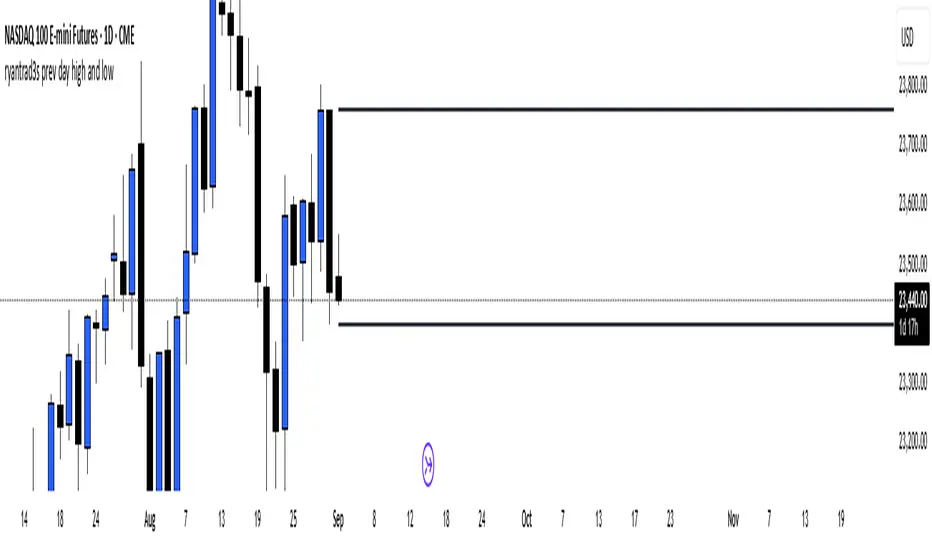
ryantrad3s prev day high and lowThis indicator can help you find the Daily high and low a lot faster than what it usually does, having this indicator equipped will make it a lot more convenient for any trader that uses anything to do with Daily highs and lows. Hope this helps.
Market Spiralyst [Hapharmonic]Hello, traders and creators! 👋
Market Spiralyst: Let's change the way we look at analysis, shall we? I've got to admit, I scratched my head on this for weeks, Haha :). What you're seeing is an exploration of what's possible when code meets art on financial charts. I wanted to try blending art with trading, to do something new and break away from the same old boring perspectives. The goal was to create a visual experience that's not just analytical, but also relaxing and aesthetically pleasing.
This work is intended as a guide and a design example for all developers, born from the spirit of learning and a deep love for understanding the Pine Script™ language. I hope it inspires you as much as it challenged me!
🧐 Core Concept: How It Works
Spiralyst is built on two distinct but interconnected engines:
The Generative Art Engine: At its core, this indicator uses a wide range of mathematical formulas—from simple polygons to exotic curves like Torus Knots and Spirographs—to draw beautiful, intricate shapes directly onto your chart. This provides a unique and dynamic visual backdrop for your analysis.
The Market Pulse Engine: This is where analysis meets art. The engine takes real-time data from standard technical indicators (RSI and MACD in this version) and translates their states into a simple, powerful "Pulse Score." This score directly influences the appearance of the "Scatter Points" orbiting the main shape, turning the entire artwork into a living, breathing representation of market momentum.
🎨 Unleash Your Creativity! This Is Your Playground
We've included 25 preset shapes for you... but that's just the starting point !
The real magic happens when you start tweaking the settings yourself. A tiny adjustment can make a familiar shape come alive and transform in ways you never expected.
I'm genuinely excited to see what your imagination can conjure up! If you create a shape you're particularly proud of or one that looks completely unique, I would love to see it. Please feel free to share a screenshot in the comments below. I can't wait to see what you discover! :)
Here's the default shape to get you started:
The Dynamic Scatter Points: Reading the Pulse
This is where the magic happens! The small points scattered around the main shape are not just decorative; they are the visual representation of the Market Pulse Score.
The points have two forms:
A small asterisk (`*`): Represents a low or neutral market pulse.
A larger, more prominent circle (`o`): Represents a high, strong market pulse.
Here’s how to read them:
The indicator calculates the Pulse Strength as a percentage (from 0% to 100%) based on the total score from the active indicators (RSI and MACD). This percentage determines the ratio of circles to asterisks.
High Pulse Strength (e.g., 80-100%): Most of the scatter points will transform into large circles (`o`). This indicates that the underlying momentum is strong and It could be an uptrend. It's a visual cue that the market is gaining strength and might be worth paying closer attention to.
Low Pulse Strength (e.g., 0-20%): Most or all of the scatter points will remain as small asterisks (`*`). This suggests weak, neutral, or bearish momentum.
The key takeaway: The more circles you see, the stronger the bullish momentum is according to the active indicators. Watch the artwork "breathe" as the circles appear and disappear with the market's rhythm!
And don't worry about the shape you choose; the scatter points will intelligently adapt and always follow the outer boundary of whatever beautiful form you've selected.
How to Use
Getting started with Spiralyst is simple:
Choose Your Canvas: Start by going into the settings and picking a `Shape` and `Palette` from the "Shape Selection & Palette" group that you find visually appealing. This is your canvas.
Tune Your Engine: Go to the "Market Pulse Engine" settings. Here, you can enable or disable the RSI and MACD scoring engines. Want to see the pulse based only on RSI? Just uncheck the MACD box. You can also fine-tune the parameters for each indicator to match your trading style.
Read the Vibe: Observe the scatter points. Are they mostly small asterisks or are they transforming into large, vibrant circles? Use this visual feedback as a high-level gauge of market momentum.
Check the Dashboard: For a precise breakdown, look at the "Market Pulse Analysis" table on the top-right. It gives you the exact values, scores, and total strength percentage.
Explore & Experiment: Play with the different shapes and color palettes! The core analysis remains the same, but the visual experience can be completely different.
⚙️ Settings & Customization
Spiralyst is designed to be highly customizable.
Shape Selection & Palette: This is your main control panel. Choose from over 25 unique shapes, select a color palette, and adjust the line extension style ( `extend` ) or horizontal position ( `offsetXInput` ).
scatterLabelsInput: This setting controls the total number of points (both asterisks and circles) that orbit the main shape. Think of it as adjusting the density or visual granularity of the market pulse feedback.
The Market Pulse engine will always calculate its strength as a percentage (e.g., 75%). This percentage is then applied to the `scatterLabelsInput` number you've set to determine how many points transform into large circles.
Example: If the Pulse Strength is 75% and you set this to `100` , approximately 75 points will become circles. If you increase it to `200` , approximately 150 points will transform.
A higher number provides a more detailed, high-resolution view of the market pulse, while a lower number offers a cleaner, more minimalist look. Feel free to adjust this to your personal visual preference; the underlying analytical percentage remains the same.
Market Pulse Engine:
`⚙️ RSI Settings` & `⚙️ MACD Settings`: Each indicator has its own group.
Enable Scoring: Use the checkbox at the top of each group to include or exclude that indicator from the Pulse Score calculation. If you only want to use RSI, simply uncheck "Enable MACD Scoring."
Parameters: All standard parameters (Length, Source, Fast/Slow/Signal) are fully adjustable.
Individual Shape Parameters (01-25): Each of the 25+ shapes has its own dedicated group of settings, allowing you to fine-tune every aspect of its geometry, from the number of petals on a flower to the windings of a knot. Feel free to experiment!
For Developers & Pine Script™ Enthusiasts
If you are a developer and wish to add more indicators (e.g., Stochastic, CCI, ADX), you can easily do so by following the modular structure of the code. You would primarily need to:
Add a new `PulseIndicator` object for your new indicator in the `f_getMarketPulse()` function.
Add the logic for its scoring inside the `calculateScore()` method.
The `calculateTotals()` method and the dashboard table are designed to be dynamic and will automatically adapt to include your new indicator!
One of the core design philosophies behind Spiralyst is modularity and scalability . The Market Pulse engine was intentionally built using User-Defined Types (UDTs) and an array-based structure so that adding new indicators is incredibly simple and doesn't require rewriting the main logic.
If you want to add a new indicator to the scoring engine—let's use the Stochastic Oscillator as a detailed example—you only need to modify three small sections of the code. The rest of the script, including the adaptive dashboard, will update automatically.
Here’s your step-by-step guide:
#### Step 1: Add the User Inputs
First, you need to give users control over your new indicator. Find the `USER INTERFACE: INPUTS` section and add a new group for the Stochastic settings, right after the MACD group.
Create a new group name: `string GRP_STOCH = "⚙️ Stochastic Settings"`
Add the inputs: Create a boolean to enable/disable it, and then add the necessary parameters (`%K`, `%D`, `Smooth`). Use the `active` parameter to link them to the enable/disable checkbox.
// Add this code block right after the GRP_MACD and MACD inputs
string GRP_STOCH = "⚙️ Stochastic Settings"
bool stochEnabledInput = input.bool(true, "Enable Stochastic Scoring", group = GRP_STOCH)
int stochKInput = input.int(14, "%K Length", minval=1, group = GRP_STOCH, active = stochEnabledInput)
int stochDInput = input.int(3, "%D Smoothing", minval=1, group = GRP_STOCH, active = stochEnabledInput)
int stochSmoothInput = input.int(3, "Smooth", minval=1, group = GRP_STOCH, active = stochEnabledInput)
#### Step 2: Integrate into the Pulse Engine (The "Factory")
Next, go to the `f_getMarketPulse()` function. This function acts as a "factory" that builds and configures the entire market pulse object. You need to teach it how to build your new Stochastic indicator.
Update the function signature: Add the new `stochEnabledInput` boolean as a parameter.
Calculate the indicator: Add the `ta.stoch()` calculation.
Create a `PulseIndicator` object: Create a new object for the Stochastic, populating it with its name, parameters, calculated value, and whether it's enabled.
Add it to the array: Simply add your new `stochPulse` object to the `array.from()` list.
Here is the complete, updated `f_getMarketPulse()` function :
// Factory function to create and calculate the entire MarketPulse object.
f_getMarketPulse(bool rsiEnabled, bool macdEnabled, bool stochEnabled) =>
// 1. Calculate indicator values
float rsiVal = ta.rsi(rsiSourceInput, rsiLengthInput)
= ta.macd(close, macdFastInput, macdSlowInput, macdSignalInput)
float stochVal = ta.sma(ta.stoch(close, high, low, stochKInput), stochDInput) // We'll use the main line for scoring
// 2. Create individual PulseIndicator objects
PulseIndicator rsiPulse = PulseIndicator.new("RSI", str.tostring(rsiLengthInput), rsiVal, na, 0, rsiEnabled)
PulseIndicator macdPulse = PulseIndicator.new("MACD", str.format("{0},{1},{2}", macdFastInput, macdSlowInput, macdSignalInput), macdVal, signalVal, 0, macdEnabled)
PulseIndicator stochPulse = PulseIndicator.new("Stoch", str.format("{0},{1},{2}", stochKInput, stochDInput, stochSmoothInput), stochVal, na, 0, stochEnabled)
// 3. Calculate score for each
rsiPulse.calculateScore()
macdPulse.calculateScore()
stochPulse.calculateScore()
// 4. Add the new indicator to the array
array indicatorArray = array.from(rsiPulse, macdPulse, stochPulse)
MarketPulse pulse = MarketPulse.new(indicatorArray, 0, 0.0)
// 5. Calculate final totals
pulse.calculateTotals()
pulse
// Finally, update the function call in the main orchestration section:
MarketPulse marketPulse = f_getMarketPulse(rsiEnabledInput, macdEnabledInput, stochEnabledInput)
#### Step 3: Define the Scoring Logic
Now, you need to define how the Stochastic contributes to the score. Go to the `calculateScore()` method and add a new case to the `switch` statement for your indicator.
Here's a sample scoring logic for the Stochastic, which gives a strong bullish score in oversold conditions and a strong bearish score in overbought conditions.
Here is the complete, updated `calculateScore()` method :
// Method to calculate the score for this specific indicator.
method calculateScore(PulseIndicator this) =>
if not this.isEnabled
this.score := 0
else
this.score := switch this.name
"RSI" => this.value > 65 ? 2 : this.value > 50 ? 1 : this.value < 35 ? -2 : this.value < 50 ? -1 : 0
"MACD" => this.value > this.signalValue and this.value > 0 ? 2 : this.value > this.signalValue ? 1 : this.value < this.signalValue and this.value < 0 ? -2 : this.value < this.signalValue ? -1 : 0
"Stoch" => this.value > 80 ? -2 : this.value > 50 ? 1 : this.value < 20 ? 2 : this.value < 50 ? -1 : 0
=> 0
this
#### That's It!
You're done. You do not need to modify the dashboard table or the total score calculation.
Because the `MarketPulse` object holds its indicators in an array , the rest of the script is designed to be adaptive:
The `calculateTotals()` method automatically loops through every indicator in the array to sum the scores and calculate the final percentage.
The dashboard code loops through the `enabledIndicators` array to draw the table. Since your new Stochastic indicator is now part of that array, it will appear automatically when enabled!
---
Remember, this is your playground! I'm genuinely excited to see the unique shapes you discover. If you create something you're proud of, feel free to share it in the comments below.
Happy analyzing, and may your charts be both insightful and beautiful! 💛