EMA Reversion + Fake Divergence Killer – PRO (Hardened)English Description (for TradingView Store):
"Mean Reversion Killer — Advanced Pine Script v6 Strategy with Fake Divergence Filter
Key Features:
Hurst Exponent Filter: Detects real mean-reversion vs persistent trends (H < 0.50 for entry).
Acceleration Filter: Only triggers on slowdowns (low |accel| < 0.0018) to avoid traps.
Higher Timeframe Confirmation: No repaint with lookahead_off for HTF (3m/5m/15m).
Volume Filter: Requires 1.5x average volume for valid signals.
Dynamic Bands: EMA-based with std dev multiplier (customizable 2.0).
Backtest Results (90 days, BTC/USDT 5m, ×20 Leverage):
Net Profit: +1,429% compounded (from $1k to $15k).
Win Rate: 79% (38 wins / 10 losses).
Profit Factor: 3.41.
Max Drawdown: 19.8%.
Perfect for 1m/5m scalping on BTC, ETH, SOL, ADA. No repaint, NA-safe, CPU-optimized.
Limited Copies: 100 Only — Price increases after.
Free 3-day trial available.
Contact for custom setups.
#PineScript #TradingView #CryptoStrategy #MeanReversion"
Su Pine

MACD-H Divergence with Impulse SystemThis script integrates the MACD Histogram, MACD Lines, and the Impulse System to provide comprehensive market analysis. It generates alerts whenever a divergence is detected. Please note that some signals may be false; therefore, it is recommended to use additional confirmation tools or indicators to enhance accuracy and reliability.

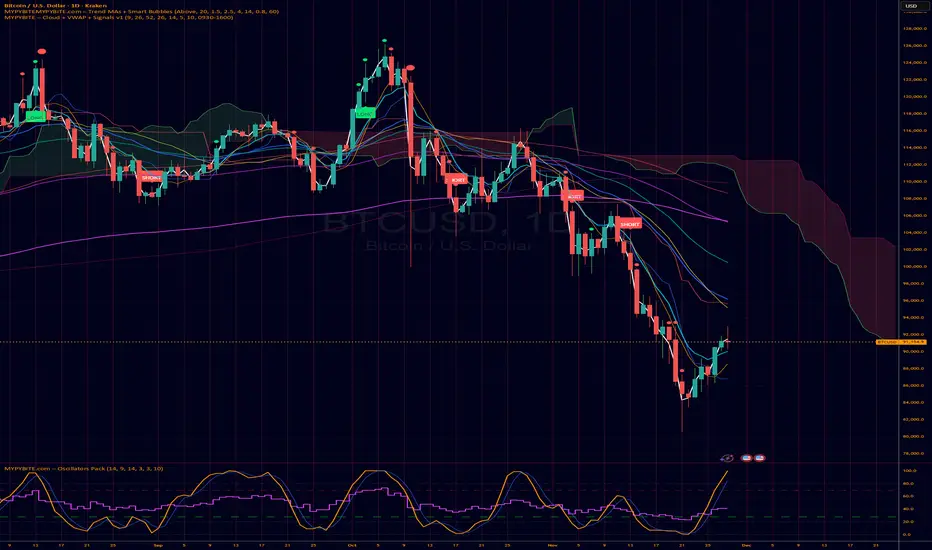
MYPYBiTE.com – Cloud + VWAPFor Bitcoin we found that the 3 day chart consistently indicates a pattern that anyone can back test and determine the trend confirmation is broken. Of course we won't tell you here what it is because you have to do the work or be familiar with the communities I participate in.
We decided to make this available because we realized many folks do not incorporate cloud charting. This is to help noobies and we hope to incorporate other factors in time.
𝐃𝐀𝐑𝐊 - 𝐓𝐄𝐑𝐌𝐈𝐍𝐀𝐋 🥷✅ DARK TERMINAL™ — Adaptive Liquidity & Trend Intelligence System
A multi-layered market analysis framework for professional traders
DARK TERMINAL™ is an advanced, all-in-one market intelligence system designed to help traders interpret market structure, trend pressure, and liquidity zones with exceptional clarity. Built with a hybrid logic of dynamic trend mapping and liquidity-based zones, this indicator assists traders in quickly understanding real-time directional bias, potential reversal areas, and high-probability continuation zones.
This system is engineered to simplify complex price behavior into clean, actionable visual layers — making it suitable for scalpers, intraday traders, and swing traders.
🔥 Core Components
1. Trend Cloud Mapping
The multi-shade trend cloud automatically adapts to momentum direction and volatility shifts.
It highlights real-time:
Bullish / Bearish phases
Transitional zones
Momentum compression areas
Potential breakout conditions
2. Dynamic Support & Resistance Levels
Automatically plotted zones update in real time and act as:
Liquidity reaction points
Smart breakout & breakdown levels
Trend continuation confirmation zones
3. Auto Buy/Sell Pressure Markers
The system identifies key price behavior shifts such as:
Momentum weakening
Liquidity grabs
Exhaustion zones
Reversal signals
These markers are NOT signals, but help visualize directional pressure.
4. Price Flow Ribbon (Midline Engine)
The mid-structure ribbon shows micro-trend behavior:
Price stability
Short-term reversal intention
Trend smoothing
Entry refinement zones
5. Algorithmic Zone Identification
Smart zone labeling automatically identifies:
Support zones
Resistance zones
Reaction clusters
Consolidation pockets
Useful for planning entries, exits, and risk levels.
🎯 How Traders Typically Use DARK TERMINAL™
Scalpers: Use micro trend shifts + support/resistance zones
Intraday traders: Use trend cloud direction + pressure markers
Swing traders: Use liquidity zones + structural transitions
Risk managers: Use dynamic volatility zones for stop placement
DARK TERMINAL™ is created to complement any existing trading strategy or work as a standalone market-reading toolkit.
📘 Important Notes
The Buy/Sell markers represent algorithm-detected behavioral shifts, not guaranteed trading signals.
Support/Resistance zones represent liquidity reactions, not fixed market levels.
Trend clouds adjust based on volatility, so shades may vary with market conditions.
⚠️ Disclaimer :
This indicator is provided strictly for educational and informational purposes only. Nothing in this tool, including but not limited to Buy/Sell markers, support/resistance labels, clouds, or any visual elements, should be interpreted as financial advice, trading signals, invitations to invest, or recommendations to buy or sell any instrument.
Trading and investing involve substantial risk, including the possible loss of capital. Market behavior is unpredictable, and past visual patterns or indicator behavior do not guarantee future performance. The developer of this script does not guarantee accuracy, profitability, or performance of this indicator and is not liable for any losses, damages, or decisions made based on the information displayed.
Users are solely responsible for their own trading decisions and must perform independent research, apply proper risk management, and consult a licensed financial advisor if necessary. By using this indicator, you agree that all trades you take are fully at your own risk.

Buy/Sell Signals [WynTrader]Hello dear Friend
Here is a new version ( B-S_251121_wt ) of my Buy/Sell Signals indicator.
Some calculation updates and useful enhancements have been applied.
Concepts
This Buy/Sell Signals indicator generates Buy/Sell signals as accurately as possible, identifying trend changes. Compared to other tools that detect trend shifts, this one is simple, easy to use, and demonstrates its efficiency on its own.
- Its features are carefully designed to minimize false signals while ensuring optimal signal placement.
- The Table results allow you to quickly evaluate signal performance, both on their own and compared to a Buy & Hold strategy.
- The Table calculations are fully synchronized with the visible chart (WYSIWYG – What You See Is What You Get). You can also scroll the chart across different date ranges to see how a stock or product performs under various market conditions.
- Seeing Buy/Sell signals on a chart is appealing, but assessing their performance in a Table makes it even more convincing. And without running a full backtest, you can get a clear overview of overall performance immediately.
Features
This indicator generates Buy/Sell signals using:
- Fast and Slow Moving Averages (adjustable).
- Bollinger Bands (adjustable).
- Filters (optional, adjustable) to refine signals, including : Bollinger Bands Lookback Trend Filter; High-Low vs Candle Range Threshold %; Distance from Fast and Slow MAs Threshold %.
- Results are displayed in a Table on the chart, based on the currently visible start and end dates.
Functionality
- The indicator aims to confirm trend changes through timely Buy/Sell signals.
- It uses two Moving Averages and Bollinger Bands, combined with filters such as BB Lookback, -- The variable settings have been tested with a mix of manual and AI testing to find the optimal configuration. You can adjust the variables to suit your goals.
- The design is simple, with clear parameters and instant readability of Buy/Sell Signals on the chart and in the Table results, without complex interpretation needed.
- It works effectively by requiring both trend confirmation and volatility control management.
- Signals are timed to be as accurate as possible, avoiding futile weak or false ones.
- A Table shows the effectiveness of the signals on the current visible chart, providing immediate, realistic feedback. The Buy & Hold strategy results are also included for comparison with the Buy/Sell swing strategy. The Buy & Hold results start from the first Buy signal to ensure a fair comparison.
- Changing the parameters instantly updates the Table, giving a quick, at-a-glance performance check.
Caution
- No technical tool is perfect; it cannot predict disasters, wars, or the actions of large fund managers or short sellers.
- After testing thousands of TradingView indicators over 24 years, I’ve found none to be 100% accurate all the time.
- This Buy/Sell Signals indicator may outperform some others but is still not perfect.
So, just be aware, and don’t be fooled by this tool.

Chart Info & Signature## Overview
Chart Info & Signature displays customizable information tables on your TradingView chart. It consists of two independent tables that can be positioned anywhere on the chart and fully customized to match your branding and preferences.
---
## Table 1: Market Info Table
### What It Displays
The Market Info Table shows essential trading information:
1. **Exchange** - The exchange name (e.g., "BINANCE", "NASDAQ")
2. **Trading Pair** - The symbol pair (e.g., "BTC/USD", "EUR/USD") with optional timeframe
3. **Date** - Current date in DD/MM/YYYY format
4. **Signature** (optional) - Custom text that appears below the date
### Positioning
- **Vertical Position**: Top, Middle, or Bottom of the chart
- **Horizontal Position**: Left, Center, or Right of the chart
- **Exchange Position**: Can be placed at the top or bottom of the table
### Customization Options
#### Exchange Settings
- Show/Hide exchange name
- Text size (tiny, small, normal, large, huge, auto)
- Text color
- Background color
- Position (top or bottom of table)
#### Pair Settings
- Pair delimiter (default: "/")
- Text size
- Text color
- Background color
#### Timeframe Settings
- Show/Hide timeframe (displays current chart timeframe like "1h", "15m", "1D")
#### Date Settings
- Show/Hide date
- Text size
- Text color
- Background color
#### Signature Settings (Below Date)
- Show/Hide signature
- Custom text
- Text size
- Text color
- Background color
- Spacing before signature (with adjustable size)
---
## Table 2: Signature Table
### What It Displays
The Signature Table displays up to 3 customizable text lines, perfect for contact information or any custom text you want to display.
### Positioning
- **Vertical Position**: Top, Middle, or Bottom of the chart
- **Horizontal Position**: Left, Center, or Right of the chart
### Customization Options
#### Line 1 (Top Line)
- Show/Hide line
- Custom text
- Text size
- Text color
- Background color
- Spacing after line (with adjustable size)
#### Line 2 (Middle Line)
- Show/Hide line
- Custom text
- Text size
- Text color
- Background color
- Spacing after line (with adjustable size)
#### Line 3 (Bottom Line)
- Show/Hide line
- Custom text
- Text size
- Text color
- Background color
### Smart Positioning
The table automatically adjusts the spacing between lines based on which lines are visible, ensuring proper alignment regardless of which lines you choose to display.
---
## Key Features
### ✅ Fully Customizable
- Every element can be shown or hidden
- Individual text sizes for each element
- Custom colors for text and backgrounds
- Adjustable spacing between elements
### ✅ Flexible Positioning
- Each table can be positioned independently
- 9 possible positions per table (3 vertical × 3 horizontal)
- Tables can overlap or be placed separately
### ✅ Organized Settings
- Settings are organized into logical groups and subgroups
- Easy to find and modify specific elements
- Clean, intuitive settings panel
### ✅ Dynamic Content
- Trading pair automatically updates based on chart symbol
- Timeframe automatically matches current chart timeframe
- Date updates in real-time
- Exchange name pulled from symbol information
---
## Text Size Options
All text size settings support the following options:
- **tiny** - Smallest fixed size
- **small** - Small fixed size
- **normal** - Standard fixed size
- **large** - Large fixed size
- **huge** - Largest fixed size
- **auto** - Automatically adjusts based on chart zoom and screen size
---
## Default Configuration
- **Market Info Table**: Positioned at top-right, showing exchange, pair with timeframe, and date. Signature row in Market Info Table is hidden by default.
- **Signature Table**: Positioned at bottom-right, showing 3 signature lines with added spacing between line 1 and line 2
- All text uses semi-transparent white (#ffffff77) by default
- All backgrounds are transparent by default
---
## Tips
1. Use **auto** text size for elements that need to scale with chart zoom
2. Use transparent backgrounds for a clean, minimal look
3. Position tables in corners to avoid interfering with price action
4. Customize colors to match your chart theme
5. Hide elements you don't need to keep the display clean

Cambio de DiaDraws a full vertical line at the daily rollover (00:00) with customizable color, thickness, and style.

不穿内裤Neural Network Buy and Sell Signals (No Underwear) - Technical Indicator Introduction
Overview
"Neural Network Buy and Sell Signals" (also known as "No Underwear") is an advanced trading signal indicator based on neural network algorithms, specifically designed for the TradingView platform. This indicator integrates multiple technical analysis tools and machine learning concepts to intelligently identify market buy and sell opportunities, providing quality ratings for each signal.
Core Features
🧠 Neural Network Architecture
Three Hidden Layer Neural Network: Utilizes advanced neural network structure to analyze market data
Multi-Factor Input: Combines five dimensions - AMF indicator, ALMA moving averages, support/resistance, swing structure, and market regime
Intelligent Scoring System: Generates 0-1 confidence scores for each signal
📊 Signal Grading System
The indicator categorizes trading signals into 6 quality grades:
A+ Grade (≥80%) - Highest quality signals
A Grade (76-79%) - Excellent signals
B Grade (65-75%) - Good signals
C Grade (37-64%) - Moderate signals
D Grade (28-36%) - Poor signals
F Grade (<28%) - Lowest quality signals
⚙️ Main Features
1. Intelligent Signal Filtering
Customizable display of signal grades
Adjustable sensitivity (0.1-10.0)
ATR dynamic stop loss mechanism
2. Multi-Timeframe Adaptation
Built-in input data normalization
Z-score standardization technology
Outlier clipping functionality
3. Visual Customization
Three candle type options (Regular, Heikin Ashi, Linear Regression)
Customizable signal label sizes and colors
Option to display by grade colors or uniform colors
🔧 Technical Core
AMF (Adaptive Moving Frequency) Indicator
Combines ZLEMA, DEMA, and Volume Oscillator
Dynamically adjusts calculation periods to adapt to market volatility
Multi-timeframe weight configuration
ALMA Moving Average System
Arnaud Legoux Moving Average
Dual ALMA combination for trend strength analysis
Gap threshold detection
Market Environment Analysis
Support and resistance identification
Swing structure detection
Market regime judgment (Trending/Ranging)
🎯 Usage Recommendations
Target Audience
Medium to short-term traders
Investors requiring quantitative signal confirmation
Users preferring systematic trading strategies
Parameter Adjustment Guide
Beginners: Use default parameters, focus on A+ and A grade signals
Advanced Users: Adjust sensitivity based on market volatility
Professional Traders: Combine with other indicators to validate signal quality
⚡ Performance Characteristics
Real-time calculation, fast response
Maximum 5000-bar lookback
Optimized computational efficiency
📈 Trading Philosophy
This indicator is based on the "quality over quantity" philosophy, using neural networks to filter high-probability trading opportunities, helping traders:
Avoid overtrading
Improve single trade success rate
Establish disciplined trading habits
💡 Important Notes
Recommended to confirm signals with other analysis tools
Different instruments may require parameter adjustments
Use with caution during major economic data releases


Futures Dollar Profit Target VisualizerFutures Profit Target Visualizer
A simple visual tool that shows exactly where price needs to go to hit your dollar profit target (and stop loss) — ideal for prop traders managing daily drawdown limits.
━━━━━━━━━━━━━━━━━━━━━━━━━━━━━━━━━━━━━━
HOW IT WORKS
Enter your target profit in dollars, and the indicator draws lines showing:
• Green line — Your take profit level
• Red line — Your stop loss level
• Blue line — Your entry (current price)
It auto-detects the futures contract you're viewing (NQ, ES, MNQ, MES, etc.) and calculates the correct point value automatically.
━━━━━━━━━━━━━━━━━━━━━━━━━━━━━━━━━━━━━━
WHY IT'S USEFUL FOR PROP TRADERS
If your prop firm allows a $500 daily drawdown and you want to risk $100 per trade with a 1:1 R:R, just enter:
• Target Profit: $100
• Risk:Reward: 1
The indicator instantly shows you the exact price levels — no mental math needed.
━━━━━━━━━━━━━━━━━━━━━━━━━━━━━━━━━━━━━━
KEY FEATURES
• Auto-detects contract type (NQ, ES, MNQ, MES, CL, GC, and more)
• Separate inputs for Mini and Micro contract quantities — switch between charts and it automatically uses the right position size
• Supports Long and Short trades
• Adjustable Risk:Reward ratio
• Labels show price, dollar amount, and points to target
• Lines are offset to the right so they don't affect chart auto-scaling
━━━━━━━━━━━━━━━━━━━━━━━━━━━━━━━━━━━━━━
SETTINGS
Profit Settings:
• Target Profit ($) — Your desired profit in dollars
• Risk:Reward Ratio — e.g., 1 = equal risk/reward, 2 = target is 2x your stop
• Mini Contracts — Position size when viewing mini contracts (NQ, ES, etc.)
• Micro Contracts — Position size when viewing micro contracts (MNQ, MES, etc.)
Trade Settings:
• Trade Direction — Long or Short
• Entry Price — Leave at 0 to use current price, or set a specific entry
Display:
• Show Price Labels — Toggle the price/profit labels
• Show Fill — Toggle the shaded zones between entry and target/stop
• Line Offset — Push lines further right (helps avoid auto-scale issues)
• Line Length — How long the lines extend
• Colors — Customize target, stop, and entry line colors
━━━━━━━━━━━━━━━━━━━━━━━━━━━━━━━━━━━━━━
SUPPORTED CONTRACTS
Equity Index: NQ, ES, YM, RTY + Micros (MNQ, MES, MYM, M2K)
Energy: CL, MCL, NG
Metals: GC, MGC, SI, SIL
Treasuries: ZB, ZN, ZF, ZT
Currencies: 6E, 6J, 6B, 6A, 6C
Ags: ZC, ZS, ZW
If your contract isn't listed, use "Custom" and enter the tick value manually.
━━━━━━━━━━━━━━━━━━━━━━━━━━━━━━━━━━━━━━
EXAMPLE
You trade MNQ with 5 contracts and want to make $100:
• Set Micro Contracts: 5
• Set Target Profit: $100
• MNQ = $2/point × 5 contracts = $10/point
• Indicator shows target 10 points above entry
Switch to NQ with 1 contract:
• Set Mini Contracts: 1
• Same $100 target
• NQ = $20/point × 1 contract = $20/point
• Indicator shows target 5 points above entry
No need to change settings when switching charts — it adjusts automatically.

Global Liquidity - Impulse (ROC & Z-score) [GMI-style]What it is:
Liquidity is a faucet. When central banks add money, the faucet opens (risk-on). When they pull money out, it closes (risk-off). This indicator builds a global net-liquidity proxy and shows its impulse :
- ROC (green/red histogram): % change vs N weeks ago.
- Z-score (cyan line): how unusually strong the latest weekly move is.
Why it matters:
Liquidity impulse often leads risk assets (equities/crypto) by weeks to a few months.
- Green bars > 0 + positive Z → friendlier risk-on backdrop.
- Red bars < 0 + negative Z → tightening conditions; caution.
Data used (TV Economics / FRED):
USA (FRED, millions USD):
- FRED:WALCL (Fed assets)
- FRED:RRPONTSYD (Reverse Repo – subtract)
- FRED:WTREGEN (Treasury General Account – subtract)
Other CBs (Economics, units vary):
- ECONOMICS:EUCBBS (ECB)
- ECONOMICS:JPCBBS (BoJ)
- ECONOMICS:CNCBBS (PBoC)
Optional:
- ECONOMICS:GBCBBS (BoE, UK)
- ECONOMICS:CACBBS (BoC, Canada)
- ECONOMICS:CHCBBS (SNB, Switzerland)
- ECONOMICS:AUCBBS (RBA, Australia)
Proxy (scaled to billions):
(Fed − RRP − TGA) + ECB + BoJ + PBoC +
How to read:
- Green bars above 0 = faucet opening → money in → risk-on.
- Red bars below 0 = faucet closing → money out → risk-off.
- Taller bar = stronger push.
- Cyan Z > +1 = unusually strong positive impulse; Z < −1 = unusually strong negative impulse.
- Background : green when ROC>0 & Z>0 , red when ROC<0 & Z<0 .
Quick reading guide (TL;DR):
- Early risk-on: ROC crosses > 0 and Z > 0 (ideally Z ≥ +1 ).
- Early risk-off: ROC crosses < 0 and Z < 0 (ideally Z ≤ −1 ).
- Use weekly timeframe; price often reacts with a 0–12 week lag.
- Combine with PMIs/New Orders, real yields (down), and credit spreads (narrowing).
Notes:
Symbols may differ by provider; leave optional banks OFF if missing. Currencies/units differ across CBs; this is a pragmatic proxy, not a perfect macro model. Educational use only; not financial advice.

ORB 15min: Break & ConfirmUsing the 15-minute opening candle range, this generates an alert when a 5-minute candle breaks the range and another 5-minute candle closes above the breakout candle's high or the high of any other candle that attempted to break the range.

KeeblerTradesPineScriptshows name/date/asset/timeframe on chart. center aligned the the bottom center. this way, you do not have to use a watermark on the canvas to figure out what asset and timeframe that you are currently viewing.

Dimagi72 Trend Suite (EMA/SMA + 52W + Cross Signals)Dimagi72 Trend Suite is an advanced trend analysis tool designed to give traders a clear picture of market direction, momentum, and major structural turning points.
It combines the most reliable long-term and short-term signals into one clean, easy-to-read indicator.
Features
• EMA9 & EMA21 for short-term momentum
• SMA50, SMA100, SMA200 for medium & long-term trend structure
• 52-Week High & Low levels for institutional support/resistance
• Golden Cross / Death Cross signals (SMA50 vs SMA200)
• Trend Strength Meter, shown directly on the chart
• Clean labels without clutter
• Designed for crypto, stocks, and forex on all timeframes (best on Daily)
How it works
The indicator measures alignment between EMAs and SMAs, tracks long-term institutional levels, and highlights major trend reversals through cross signals.
The Trend Strength Meter calculates a score from -4 to +4, making trend direction instantly visible.
Why use this indicator
This suite brings together the most widely used trend-following tools into one unified system.
It helps traders quickly determine when the market is bullish, bearish, or neutral — and when major reversals may be forming.
Best for:
Swing traders, long-term trend followers, crypto traders, and anyone who wants a clean visual overview of the trend without using multiple separate indicators.
Tags (use these to show up in search)
trend
ema
sma
trend-following
golden cross
death cross
momentum
trend strength
52 week high
crypto
stocks
market structure

SLAW TRADING SCALP-XSLAW TRADING SCALP-X – Multi-Filter Scalping Suite
SLAW TRADING SCALP-X is an intraday scalping tool designed for fast markets (crypto, FX, indices) on lower timeframes such as 1m–5m charts. It combines multiple classic concepts into a single, rule-based framework and only prints signals when several conditions agree.
The script uses:
Heikin Ashi structure to smooth noise and detect bullish/bearish candle bias.
Dual EMAs (fast & slow) to define the main trend and to filter trades in the direction of that trend.
Stochastic and MACD as momentum filters. Both can vote for long/short, contributing to a combined momentum score.
Swing / pivot detection (local highs/lows and fractals) to locate potential exhaustion zones and entries near short-term reversals.
ATR-based volatility filter that ignores “dead” low-volatility periods and overly explosive candles, adapting automatically across different markets.
Candle-quality filter that checks body/wick ratios to avoid extreme wick manipulation and very small bodies.
A momentum score is built from Stochastic, MACD and swing conditions. Long or short signals are only allowed when the score reaches a configurable minimum, the trend filter agrees, price is close to the fast EMA, volatility is inside a healthy range, and the candle passes the body/wick quality checks.
The script also contains signal-management logic:
Maximum number of consecutive signals in the same direction (to avoid endless buying or selling in trends).
Minimum bar distance between two signals (to reduce over-trading and clustering).
When all filters line up, the indicator plots “L” and “S” labels on the chart and exposes corresponding alertconditions (“LONG” and “SHORT”) so traders can connect it to webhooks or bots.
This script is intended as a tool for discretionary traders, not an automatic profit guarantee. It works best when combined with your own risk management, session filters and higher-timeframe analysis. Nothing in this indicator is financial advice; always test on a demo account and adapt the parameters to your market and timeframe.

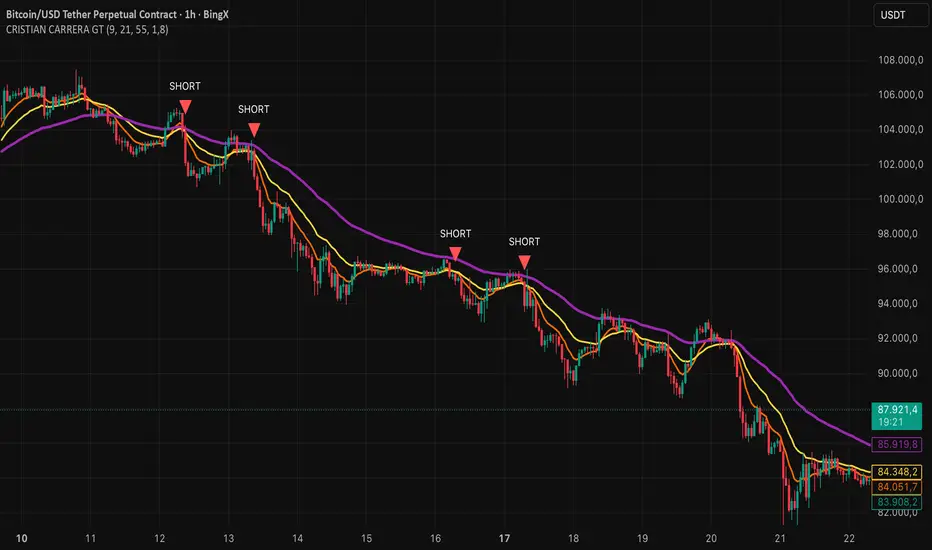
CRISTIAN CARRERA GTEMAs, Pivots, and Price Action are used.
This indicator was developed from the analysis of EMAs. We use EMAs of different periods to validate price action.
Pivots are important for detecting where the market breaks out, especially when it is trading within ranges or at strong support and resistance levels.
Price action with volume inflows or outflows gives us a better idea of where the market is headed.
BTC Dual Cycle: Stats DashboardOverview
"Price takes the elevator down, but takes the stairs up."
This indicator is a macro-analysis tool designed to visualize the true duration of Bitcoin’s market cycles. Unlike standard oscillators that focus on short-term price action, the Macro Cycle Tracker filters out the noise to answer two fundamental questions:
Are we in a phase of Expansion (Price Discovery)?
Are we in a phase of Recovery (Repairing the damage of a crash)?
It visually separates the market into two distinct regimes based on a configurable drawdown threshold (default: -50%) and provides real-time statistics on how long these phases historically last.
How It Works
The script tracks the All-Time High (ATH) and divides market history into two colored zones:
🟢 The Green Zone (Expansion / Price Discovery)
Trigger: Starts immediately when Bitcoin breaks the previous ATH.
Meaning: The market is healthy, profitable, and exploring new valuation levels.
End: The zone ends when price drops by 50% (configurable) from the cycle top.
🔴 The Red Zone (Recovery / Capitulation)
Trigger: Starts when price drops below the 50% threshold from the peak.
Meaning: The asset is "underwater." This zone remains active persistently—even during relief rallies—until the previous ATH is fully reclaimed.
Philosophy: A cycle is not over until the damage is repaired.
Key Features
Cycle Timer: Displays the exact number of days passed for every historical cycle directly on the chart.
Live Counter: Shows the current duration of the active phase (e.g., "ZONE GREEN: 450 Days...").
Statistical Dashboard: A table in the bottom-right corner automatically calculates the Mean and Median duration (in days) for both Green and Red phases. This allows you to compare the current cycle against historical averages.
How to Use
For Investors (HODLers): Use the Red Zone to understand the "Time Cost" of a bear market. It helps visualize that recovery takes patience and that price action below the old ATH is merely accumulation.
For Analysts: Use the Dashboard statistics to project potential cycle turning points based on historical median durations.
Settings
Drop Percent (%): Default is 50%. This defines the "Crash" threshold. You can adjust this to 20% or 30% for more sensitive cycle detection.
Text Size: Adjust the size of the dashboard text to fit your screen resolution.
Disclaimer: This tool is for educational purposes only and does not constitute financial advice. Past performance is not indicative of future results.

BTC -50% Crash to Recovery ZoneGeneral Overview This is a macro-analysis tool designed to visualize the true duration of Bitcoin’s "Suffering & Recovery Cycles." Unlike standard oscillators that only signal oversold conditions, this script highlights the entire timeline required for the market to flush out leverage and return to All-Time Highs (ATH).
Operational Logic The algorithm tracks Bitcoin’s historical All-Time High (ATH).
The Trigger: It activates automatically when the price drops 50% below the last recorded ATH.
The "Recovery Zone": Once triggered, the chart background turns red (indicating a "Drawdown" state). This zone remains active persistently, even during intermediate relief rallies.
The Reset: The zone deactivates only when the price breaks above the previous ATH, marking the official start of a new Price Discovery phase.
How to Read It
Red Background: We are officially in a Bear Market or Recovery Phase. The asset is technically "underwater." For the long-term investor with a low time preference, this visually defines the accumulation window.
Red Horizontal Line: Indicates the "Target." This is the exact price level of the old ATH that Bitcoin must reclaim to close the bearish cycle.
No Background Color: We are in Price Discovery. The market is healthy and pushing for new highs.
The Financial Lesson This indicator visually demonstrates a fundamental market truth: "Price takes the elevator down, but takes the stairs up." It shows that after a halving of value (-50%), Bitcoin may take months or years to recover previous levels, helping investors filter out the noise of short-term pumps that fail to break the macro-bearish structure.

EMA 5-13-21-34-55-89-144-233Fibo sayıları olan 5-13-21-34-55-89 -144-233 dan oluşan EMA'ları göstermek için hazırlanmıştır.

Volume–Phase Analyzer ProVolume–Phase Analyzer Pro – Trend & Institutional Volume Phases
This indicator analyzes how volume behaves relative to price movement to detect whether the market is in Accumulation, Markup, Distribution, or Markdown — the same phases institutions track in professional trading.
Unlike regular volume/MA mashups, this tool combines:
• Institutional volume classification (HighVol Up/Down, LowVol, Confused Vol)
• Price–volume efficiency and wick dominance
• Multi-Timeframe directional filters
• Volatility compression signals using Bollinger Width
• Volume mapped directly into the price chart as candles
• Smart signal engine with cooldown (prevents repeated signal spam)
This helps reveal w hen Smart Money is accumulating, pushing trends, unloading positions, or flushing liquidity.
────────────────────────────────────
How It Works
1️⃣ Volume Strength vs Average Volume
Identifies whether a move is backed by genuine buying/selling power.
2️⃣ Wick & Body Analysis
Confirms whether volume produced meaningful directional pressure — not just noise.
3️⃣ Trend Alignment
Fast EMA vs Slow EMA ensures signals align with active trend.
4️⃣ Higher-Timeframe Confirmation
Confirms if current movement agrees with a larger directional bias.
5️⃣ Compression Detection
When price volatility contracts while high-volume bars appear → phase shift often ahead.
────────────────────────────────────
Signals
BUY → Confirmed bullish demand with trend backing
SELL → Confirmed bearish supply taking control
TRAP → Likely stop-hunt or absorption — often before reversal
Signals only appear when multiple institutional conditions align.
A cooldown prevents repetitive signals like BUY-BUY-BUY.
────────────────────────────────────
Background shading helps visually locate these phases.
Markup phase:
• Meaning: Buyers are in control and the market is trending up
• Background color: Light green
Markdown phase:
• Meaning: Sellers are in control and the market is trending down
• Background color: Light red
Accumulation phase:
• Meaning: Smart Money quietly buying near the bottom before an uptrend
• Background color: Teal (blue-green)
Distribution phase:
• Meaning: Smart Money quietly selling near the top before a downtrend
• Background color: Light orange/yellow
Consolidation phase:
• Meaning: Sideways movement with low conviction
• Background color: Very light grey
Transition phase:
• Meaning: Market has not picked a direction yet
• Background color: No shading (clear background)
⸻
Quick Usage Notes
• Best trades are Buy signals during Markup and Sell signals during Markdown
• Accumulation and Distribution often come before reversals
• Consolidation is a low-quality trading zone
────────────────────────────────────
How to Trade It
• Take BUY signals during Markup
• Take SELL signals during Markdown
• Expect reversals near Trap signals, especially when phase is changing
• Avoid over-trading Consolidation zones
• Volume candles below price reveal when momentum is increasing or fading
Best applied on 5m–1H for intraday and swing confirmation.
────────────────────────────────────
Why This Indicator Is Unique
• It uses p rice-volume efficiency , not standard lagging signals
• It detects S mart Money intent , not retail reactions
• It avoids spam signals using an internal cooldown logic
• It gives context, not just entries — via live market-phase analysis
This makes it a multi-purpose tool for trend trading, breakout trading, and reversal anticipation.
────────────────────────────────────
Alerts Included
• Buy/Sell/Trap Signals
• Phase Change Alerts
────────────────────────────────────
This is a free tool and meant for educational use only.
Always use proper risk management.
────────────────────────────────────

Reward-Risk Visual Zones (RRZ)Reward–Risk Visual Zones (RRZ) – Structure-Driven Risk Mapping Engine
Most indicators tell you when to trade.
RRZ is designed to answer a different question:
“Is this setup worth the risk before I take the trade?”
RRZ is not a mashup of unrelated indicators.
It is a 3-stage risk engine that builds a complete trade “story” around each swing:
1. Market structure pivot → defines the trade idea
2. ATR volatility unit → defines the risk size
3. Projected reward → compares reward vs that risk and filters bad setups
The output is a visual trade map : entry, target, stop, and R:R, printed directly on chart at each qualified swing.
1. Market Structure Layer – Where trades are anchored
RRZ doesn’t fire signals from MA/RSI crossovers.
It begins with s wing structure :
• Uses ta.pivotlow() and ta.pivothigh() with user-controlled left/right sensitivity:
• Pivot Sensitivity (L) controls how wide a swing must be to qualify as a structural pivot.
• Pivot Confirmation (R) controls how fast/slow a pivot is confirmed (1 = almost real-time, larger values = safer but later).
• A confirmed swing low becomes the candidate anchor for a long R:R zone.
• A confirmed swing high becomes the candidate anchor for a short R:R zone.
Each pivot is stored with its exact price and bar index , so the rest of the logic is always anchored to a real swing instead of a random candle.
2. Volatility Layer – Turning ATR into a “risk unit”
Once a pivot is confirmed, RRZ measures local volatility using ATR:
• ATR length is configurable via ATR Length.
• ATR is not used as a trailing stop or overlay.
In RRZ it plays one specific role:
“One ATR = one unit of structural risk from this swing.”
From that:
Long scenario:
• Entry = pivot low
• Stop = Entry − 1 × ATR
Short scenario:
• Entry = pivot high
• Stop = Entry + 1 × ATR
This standardizes risk across different volatility regimes:
a 2R move in a quiet market and a 2R move in a volatile market are both “2 × ATR” from the structure.
3. Reward Projection Layer – Evaluating if the trade is worth it
RRZ then estimates how far price can realistically travel away from the pivot, given recent behaviour:
For longs (from swing low):
• Projects reward using the highest high in a rolling lookahead window (e.g., last 20 bars).
• Reward = HighestHigh – PivotLow
• Risk = ATR
• R:R = Reward / ATR
For shorts (from swing high):
• Projects reward using the lowest low in the window.
• Reward = PivotHigh – LowestLow
• Risk = ATR
• R:R = Reward / ATR
The user can set a minimum R:R filter via Min R:R Threshold.
• If R:R ≥ threshold → zone is tagged as “ GOOD R:R ” and highlighted in green (long) or red (short).
• If R:R < threshold → optionally still shown as “ LOW R:R ” in orange (so you can visually see “tempting but not worth it” trades).
This transforms a raw pivot + ATR into a quantified decision:
“From this swing, volatility says my stop is 1× ATR. Do I even have 2× ATR of room in my favour?”
4. Execution Map – How components work together on chart
Instead of just printing numbers, RRZ builds a full execution template for every qualifying swing:
• Entry line at the pivot price
• Target line at the reward projection price
• Stop line at pivot ± ATR
• A structured label including:
• LONG / SHORT direction
• “GOOD R:R” or “LOW R:R”
• Numerical R:R (e.g., 2.3 : 1)
• Entry, Target, Stop, current Close
A Cooldown Bars parameter prevents overlapping spam:
• After an R:R zone is created (long or short), the script waits X bars before considering another zone in the same direction.
• This keeps charts readable and focuses attention on the most recent high-quality swings.
RRZ also includes line style controls (solid/dashed/dotted) and separate colours for entry, target, and stop, so traders can quickly read the chart even without opening settings.
5. How to Use RRZ in a Trading Plan
RRZ is not a magic “buy/sell” button.
It is designed to sit on top of your existing strategy as a risk filter.
Typical workflows:
SMC / price-action traders:
• Use your own logic for BOS/CHoCH, order blocks, or liquidity sweeps.
• Use RRZ only where structure aligns and the zone shows GOOD R:R ≥ 2.0.
• Avoid setups where RRZ marks LOW R:R even if the pattern looks good.
System traders / swing traders:
• Use RRZ to standardize risk across assets and timeframes.
• Filter out trades where potential reward does not justify the stop, based on current ATR.
Beginners:
• Learn to stop taking trades where the target is too close and the stop is too wide.
• Visually understand how structural swings and volatility interact.
RRZ works across Forex, Crypto, Indices, and Stocks on intraday and higher timeframes.
Once a pivot is confirmed and a zone is plotted, its lines and labels do not repaint.
⸻
6. Why this invite-only script is more than a basic mashup
RRZ does use classic building blocks (pivots, ATR), but the value is in the way they are stitched into a single risk framework:
• It doesn’t run multiple separate indicators on chart.
Everything is computed inside one engine with a single purpose: structure-based R:R evaluation.
• ATR is not just “slapped on” as a stop line; it is treated as the core risk unit in the R:R calculation pipeline.
• Every zone is a coherent trade idea: from swing, to risk unit, to projected reward, to filtered label, to execution lines.
• The script is designed specifically to help traders do the one thing that almost no free indicator prioritizes:
“Say NO to low R:R trades automatically.”
This is what distinguishes RRZ from generic ATR-stop scripts or simple pivot overlays.
⸻
Important
• No performance promises.
• No marketing claims (“guaranteed”, “high win rate”, etc.).
• Purely a risk mapping & visualization tool.

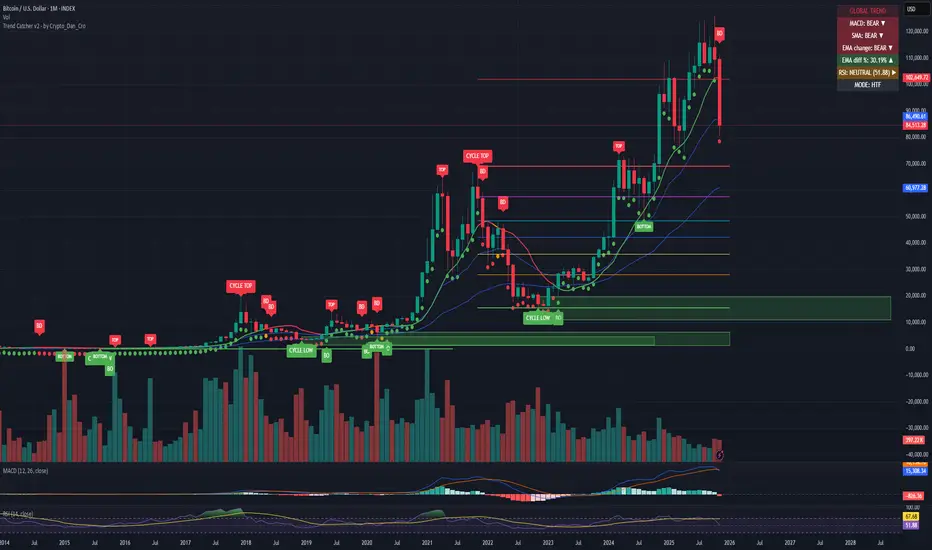
Trend Catcher - Alpha v2 - by Crypto_Dan_CroIf you want to get this indicator, contact me on
X handle: @crypto_dan_cro
What is Trend Catcher v2?
This is the only indicator you need ;)
This indicator is a proprietary market analysis system designed to identify high-probability trading zones by synchronizing multiple layers of market structure, momentum behaviour and cyclical dynamics.
It dynamically adapts to changing market conditions by evaluating:
- macro trend alignment
- structural price positioning
- momentum acceleration & deceleration
- volatility-based reaction zones
- cycle maturity levels
The system filters out low-quality setups and highlights only areas where multiple hidden conditions align, providing:
- trend continuation signals
- structural shift detection
- cycle-based expansion targets
- adaptive support & resistance mapping
Rather than reacting to price alone, the indicator anticipates areas where market psychology historically shifts, allowing traders to position themselves ahead of major moves.
Core philosophy:
This tool does not attempt to predict the market — it tracks the underlying pressure points where probability favours expansion or exhaustion.
It functions as:
- a trend alignment engine
- a cycle decoder
- a volatility interpreter
- a structure validation system
What it gives the user:
- Clear visual guidance without overloading the chart
- Objective market context independent of emotion
- Early trend recognition
- Cycle-aware price targeting
- Decision zones instead of random entries
Ideal for:
- traders who trade structure, not noise
- investors who respect market cycles
- strategists focused on probability over prediction
- disciplined entries & exits
In short:
It is a market interpretation framework built for traders who think two steps ahead.
Contains:
1. Higher Timeframe mode (Monthly / Weekly) on all timeframes
2. Current Chart Timeframe mode
3. Global Trend via BTC MACD
4. SMA
5. EMA
6. BO (Break Out), BD (Break Down) signals
7. TOP & BOTTOM Detection
8. Support & Resistance Zones
9. RSI confirmation
10. Smart Info Panel (Global trend, MACD, SMA, EMA, RSI statuses - Bull, Bear, Neutral)
11. Monthly timeframe (Fibbonaci Retracement levels)
12. Monthly timeframe (all Cycle tops, and Cycle bottoms)
Crypto markets are volatile, if you choose to use this indicator for trading, you are doing it on your own. Crypto_dan_cro is not responsible for any profits or losses created by using this Indicator.