Geopbytech Risk Based Lots Calculator📊 Geopbytech – Risk Based Lots Calculator
Built by Juan C. Delgado
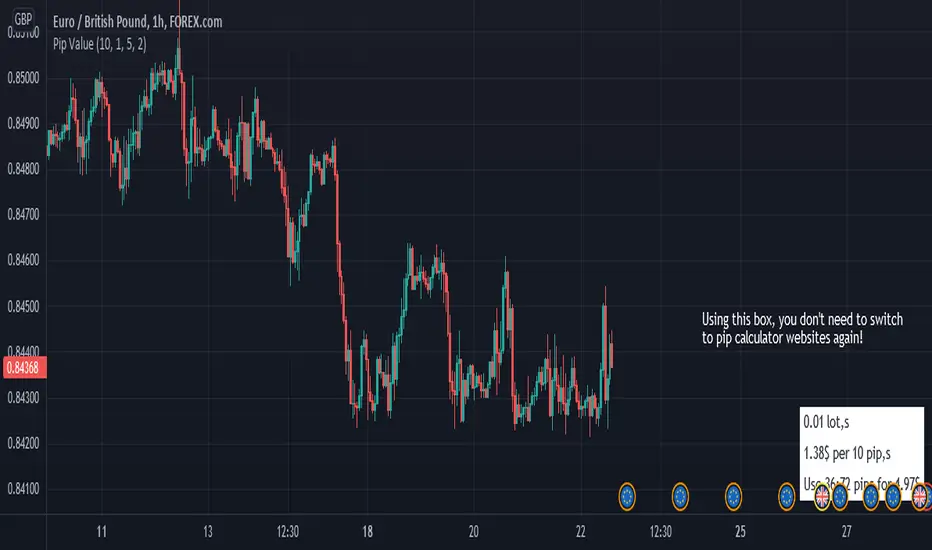
A lightweight and fast position size calculator designed to help traders determine optimal lot size directly from the TradingView chart.
No more switching to external websites during live execution.
Simply input:
Account Size (USD)
Risk Ratio %
Stop-Loss distance (pips or points)
The tool instantly calculates the correct lot size based on proper risk management.
🔹 How It Works
The calculator determines:
Risk ($) = Account Size × Risk %
Lot Size = Risk ($) ÷ (Stop-Loss Units × $ Value per Unit per 1 Lot)
Everything updates instantly as you change values.
🔹 Example
Account Size Risk % Stop Loss Result
$10,000 1% 20 pips 0.50 lots
$5,000 1% 15 pips 0.33 lots
$8,000 2% 30 pips 0.53 lots
🔹 Default Configuration (Forex – EURUSD)
By default, the script is optimized for standard Forex pairs like EURUSD.
You only need to:
Enter Account Size
Enter Risk %
Enter Stop-Loss in pips
The script automatically calculates pip value using standard 100,000 contract size.
🔹 Trading Gold (XAUUSD)
If you are trading Gold:
Enable:
✔ Override $ per unit (non-FX)
Then adjust:
• Override $ per 1 unit per 1 lot
(or use Custom Unit Size if needed depending on broker specification)
Because gold brokers may use different contract sizes.
🔹 Trading Indices
For indices (NAS100, US30, SPX, etc.):
You can:
• Leave override OFF (if TradingView provides correct point value)
OR
• Enable Override and manually define $ value per point per lot
Depends on your broker's contract specification.
🔹 Trading Cross Pairs (GBPJPY, EURJPY, etc.)
For Forex crosses:
Leave override OFF.
If calculation warning appears:
Adjust "Custom Unit Size" to match correct pip structure.
Example:
GBPJPY may require adjusting unit size depending on feed.
🔹 Inputs Explained
Account Size (USD)
Your total trading account balance.
Risk Ratio %
Percentage of account you are willing to lose per trade.
(Example: 1% = disciplined risk management)
Stop-Loss (pips / points)
Distance from entry to stop loss.
This must match what you use in the TradingView position tool.
Custom Unit Size (price)
Advanced setting.
Used when your symbol does not follow standard pip or tick logic.
You define how much price movement equals 1 unit.
FX Contract Size
Default: 100,000 (standard lot in Forex).
Only change if your broker uses non-standard contract sizes.
🎨 UI Customization
You can customize:
• Theme (Dark / Light / Midnight)
• Dashboard Position
• Transparency
• Text Size
• Warning visibility
⚠️ Important Notes
This tool calculates position size based on TradingView symbol specifications.
Broker contract sizes may vary.
Always verify:
Pip value
Contract size
Margin requirements
Final order size
Before placing a live trade.
⚠️ Disclaimer
This tool is provided for educational and informational purposes only.
It does not constitute financial advice, investment advice, or trading recommendations.
Trading involves substantial risk and may result in loss of capital.
Use at your own risk.
👤 Author
Built by Juan C. Delgado
Geopbytech
Indicatore Pine Script®