[fikira] Divergences (RSI)This script can be used with candlesticks, accompanied with " RSI + Divergences"
The calculation is different than my "Divergences (Pivots)"
Thank you!
Pivot

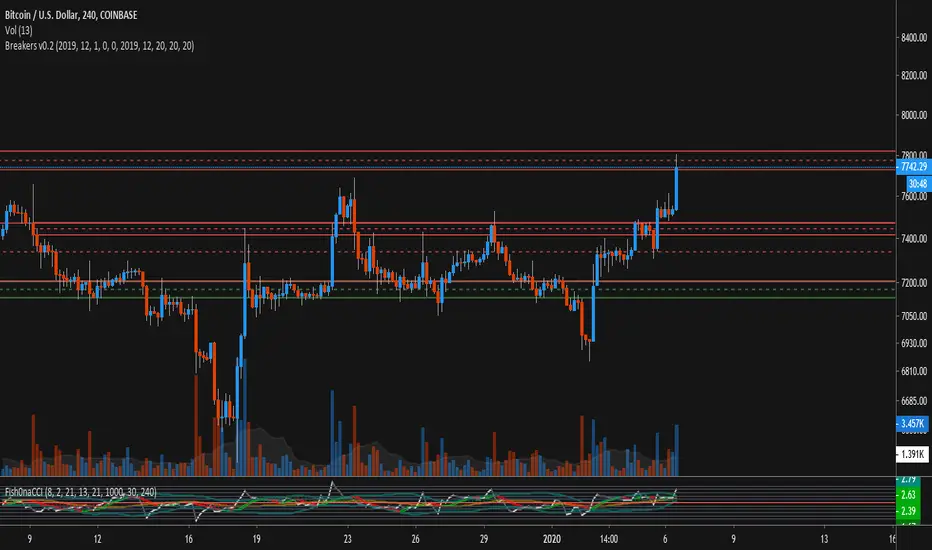
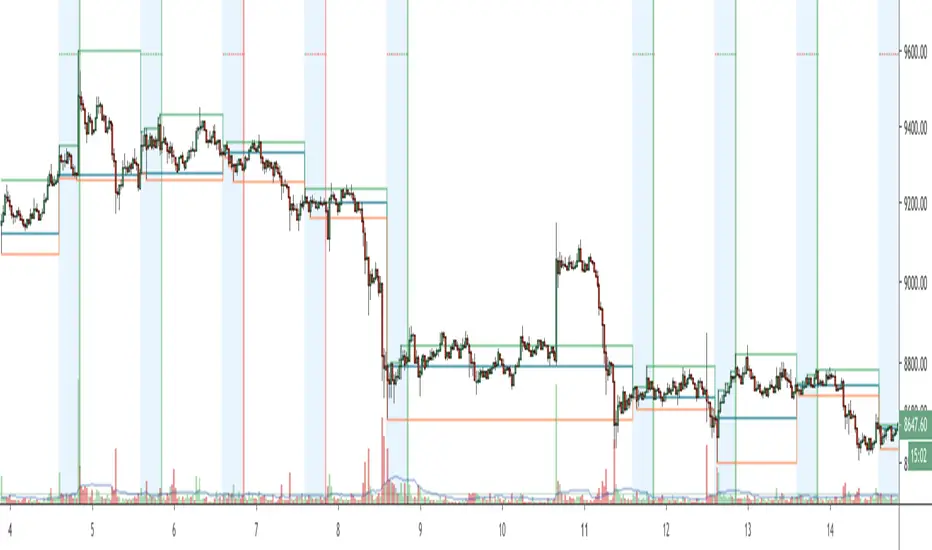
bg_Breakers_orderBlocks_detection (Breakers)Version 0.1
Using Pivots / Swing Point detection, this script plots the final swing candle's body span from top to bottom with an extended horizontal line, with a mid-channel point at 50% between open and close.
Once the trend changes, these zones serve as support and resistance zones, and can help identify breakouts from ranges and probable reversal points moving forward.
To avoid clutter, the script allows you to select a specific date-range (start / end date) which the rule will only apply and plot for.
Other customizable options are the length in bars of the pivot/swing point detection, which is defaulted at 20 bars for both highs and lows.
Works best on time-frames 4H, 1D, etc. with some luck to be had in occasionally shorter time-frames as shown above.
4H:
Extrapolated Pivot Connector - Lets Make Support And ResistancesIntroduction
The support and resistance methodology remain the most used one in technical analysis, this is mainly due to its simplicity, and unlike lots of techniques used in technical analysis support and resistances have a certain logic, price can sometimes appear moving into a channel, support and resistances allow the trader to estimate such channel and project it into the future in order to spot points where price might reverse direction.
In this script a simple linear support and resistance indicator is proposed, the indicator is made by connecting past pivot high's/low's to more recent ones and extrapolating the resulting connection. The indicator is also able to make support and resistances by using other indicators as input.
Indicator Settings
The indicator include various settings, the first one being the length setting who determine the sensitivity of the pivot high/low detection, low values of length will detect the pivot high/low of noisy variations, while higher values will detect the pivot high/low of longer term variations.
The figure above use length = 5.
The A-High parameter determine the position of the pivot high to be used as first point of the resistance line, higher values will use oldest pivot high's as first point. The B-High parameter determine the last pivot high. A-Low and B-Low work the same way but affect the support line, a label is drawn on the chart in order to help you determine the position of A/B-High/Low.
Using Other Indicators Output As Input
The "Use Custom Source" option allow you to apply the indicator to other indicators, for example we can use a moving average of period 50 as input
Or the rsi :
Let me help you set the proposed indicator easily to indicators appearing on a separate window, for example the momentum oscillator, add the momentum oscillator to the chart, to do so click on indicator and search "momentum", click on the first result, once on the chart put your mouse pointer on the indicator title, you'll see appearing the hide, settings and delete option, at the right of delete you should see three dots which represent the "more" option, click on it and select "Add indicator on Mom" and select the extrapolated pivot indicator, you can do that by searching it, altho it might be easier to do it by adding the indicator to favorites first, you then only need to select it from your favorites.
You might see a mess on the indicator window, thats because the extrapolated pivot is still using high and low as input, go to the settings of the extrapolated pivot indicator and check "Use Custom Source", it should appear properly now.
Tips And Tricks When Using Support And Resistances
Linear support and resistances assume an approximately linear trend, if you see non linear growth in the price evolution you can use a logarithmic scale in order to have a more linear evolution. To do so right click on the the chart scale and select "Logarithmic" or use the following key shortcut "alt + l".
When applying the indicator to an oscillator centered around zero make sure to adjust the settings of the oscillator such that the peak magnitude of the oscillator is relatively constant over time.
Here a roc of period 9 has non constant peak amplitude, you can see that by looking at the position of the pivots (circles), increasing the period of the roc help capture more significant pivots high's/low's
Conclusion
In this post an indicator aiming to draw support and resistances is presented, the fact that it can be applied to any other indicator is a relatively nice option, and i hope you might make use of this feature.
The code make heavy use of the new features that where integrated on the v4 of pine, such features are really focused on making figures and labels, things i don't really work with, but it is nice to step out my short codes habits, and i don't exclude working with figures in pine in the future.
Thanks for reading !

Pivot Points Daily and WeeklyThis will let trader see Daily and Weekly Pivot points with R/S5.
Daily Pivot point line --> Orange Color
Daily R1-5 ---> Black circles
Daily S1-5 ---> Black circles
Weekly Pivot lines ---> Purple Color
Weekly R1-5 ---> Red Circles
Weekly S1-5 ---> Red Circles


Pivot Point Std With CPR,2 EMA,MW S R,P Day H L - by AnanthPivot Point Std With CPR,2 EMA,Monthly Weekly Support Resistance,Previous Day High and Low - by Ananth

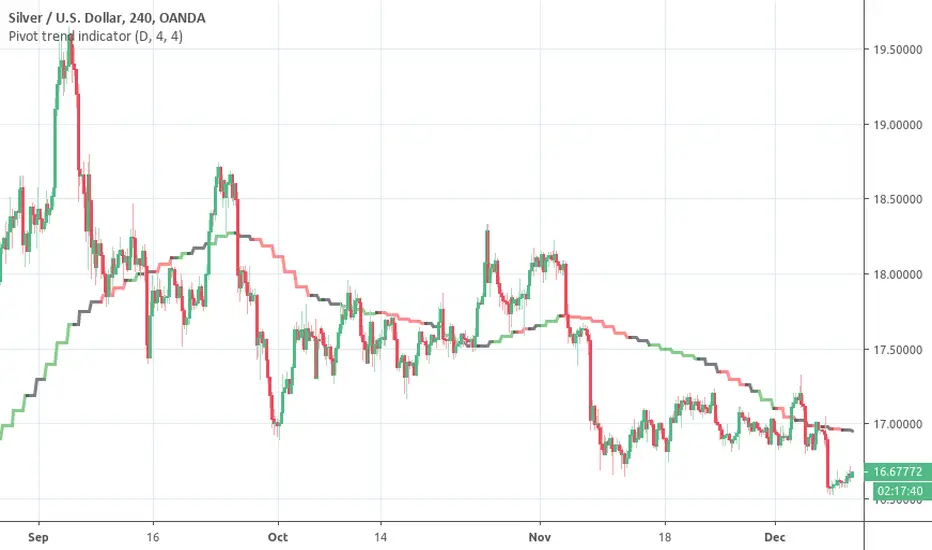
Pivot trend indicatorThis is a LAGGING indicator which can provide a good indication of trend. It require a certain (configurable) number of candles to have closed before it can determine whether a pivot has formed.
It provides a 20 period SMA for the timeframe of your choice which is color coded to show the trend according to confirmed pivots.
Anticipated usage:
Long / Short bias is determined by pivot trend
Trader seeks entries according to their strategy
Black consolidation areas may trigger a re-evaluation of the trade and can serve as good profit taking areas
The SMA colors:
Green -> Higher highs & Higher lows
Red -> Lower highs & Lowers lows
Black -> No clear trend from the pivots
Why the 20 SMA?
Feel free to adjust it for your purposes. I personally find that using a higher time frame 20 SMA is a better indication of trend than longer period MAs on shorter time frames. This can be seen from comparing the 20 daily SMA and 200 hourly SMA.
Pivot adjustment
The pivots use the selected time frame (not) the MA trend time frame. You can specify the left and right candles required to confirm a pivot
Clean Pivot By Ravi BelkhindiThis indicator create pivot on intraday charts, It has the following features
1. Create Pivots on intraday chart extending till the session closure time ( till 3.30 PM IST )
2. Dynamically plot Monthly and Weekly plots only if fall in daily pivot zone ( R3 to S3 )
3. CPR zone color indicated narrow and wide range, user can change the definition of narrow range in terms of %
4. Pivot visible only in intraday timeframe

Pocket Pivot IndicatorFrom Gil Morales and Chris Kacher (O'Neil's disciples). Designed to find buy points in bases and continuation buy points in an uptrend. The volume today must be greater then the maximum down volume of the past 10 trading days. Recommended to use in conjunction with the 10 day and/or 50 day moving average.
Typical use :
Scan for pocket pivots.
Is stock strong fundamentally? i.e- leader in it's sector
Has the stock developed a base ?(see O'Neil's work for base discussion)
Is the stock breaking through or bouncing off the 10 period sma? (can use 50 sma too)
If so.. a possible buy.
Cheers
David

Pivots With CPR,Moving Average and VWAP - by AnanthThis indicator is a combination of Pivot points with CPR, Moving Average and VWAP.

Significant PP - Swing Failure / Stop Run Alerts [QN]Tried to create a script for Swing Failure / Stop Run patterns. It is based on my QuantNomad - "Significant Pivot Reversal" Indicator.
It's quite tricky to code these kinds of patterns, so it's really not ideal. I alert when a candle cross pivot level but close below (above for bottom) it and previous close was below (above) it as well.
You can setup params for pivot points and also by how much it should cross pivot level with "SF ATR Mult".
I have in mind a few other things I'd like to test:
* Different types of pivot points
* Few recent pivot levels at once
* Pivots from higher timeframe
* Different types of "touching" levels
* etc.
Ideally, I want to create a strategy from it, but I'm far from it for now.
Do you have any ideas on how to make it better?
Original Significant Pivot Reversal Indicator:

NYSE Session for 24/7 marketsThis script is used for analyzing the correlation between 24/7 markets with regards to the price action during NYSE session. Defaults to showing daily session open/high/low but there is the option to show the weekly session data.
Pivot Points HIgh LowRemake of the integrated Pivot Points indicator
With higher resolution you should lower the indicator values to get a good result

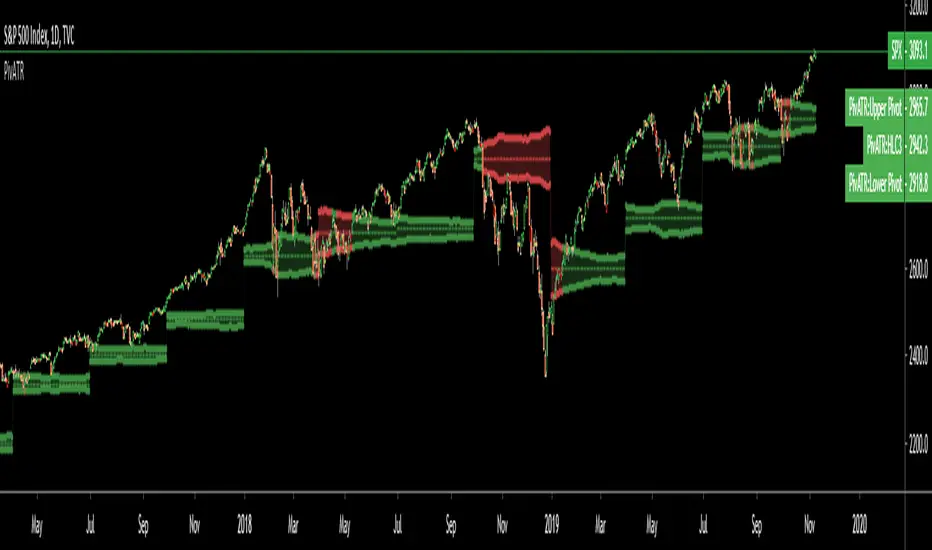
Adaptive Pivot (HLC3)SUMMARY:
Standard Pivot (HLC3) with ATR leeway added to make it adaptive to market volatility.
DESCRIPTION:
Adaptive Pivot is an indicator utilizing the simplicity of HLC3 Pivots as a turning point (and sometimes a trend indicator) while addressing it's fixed and inflexible nature.
Because the indicator is just a single line in the chart, the price may go near it but never touch it. Or it can go pass through it and never retest it again. In an attempt to lessen these from occurring, we can combine pivots with average true range (ATR). This is the specific formula I applied in this indicator:
>Upper Pivot = HLC3 + ATR
>Lower Pivot = HLC3 - ATR
This creates a kind of a range or cloud around the Pivot, making it possibly a more accurate indicator for market turning points.
ADJUSTABLE PARAMETERS:
The usual ATR parameters are included in this indicator:
>ATR_Length = input(14, title="ATR Length", minval=1)
>ATR_Smoothing = input(title="ATR Smoothing", defval="RMA", options="RMA", "SMA", "EMA", "WMA")
Added to the usual ones is this:
>ATR_Multiplier = input(1, title="ATR Multiplier", minval=0.1)
which modifies the extent of the ATR (similar to Chandelier Exit) as it is added/subtracted from the pivot values.
Pivot’s timeframe is also adjustable:
>Pivot_Timeframe = input("3M", title='Pivot Resolution')
Note: I did not lock the type to input.resolution to allow for more possible timeframes.
OTHER PARAMETERS
Indicator color will change to green when the open is above the HLC3 Pivot and change to red when the reverse is true.
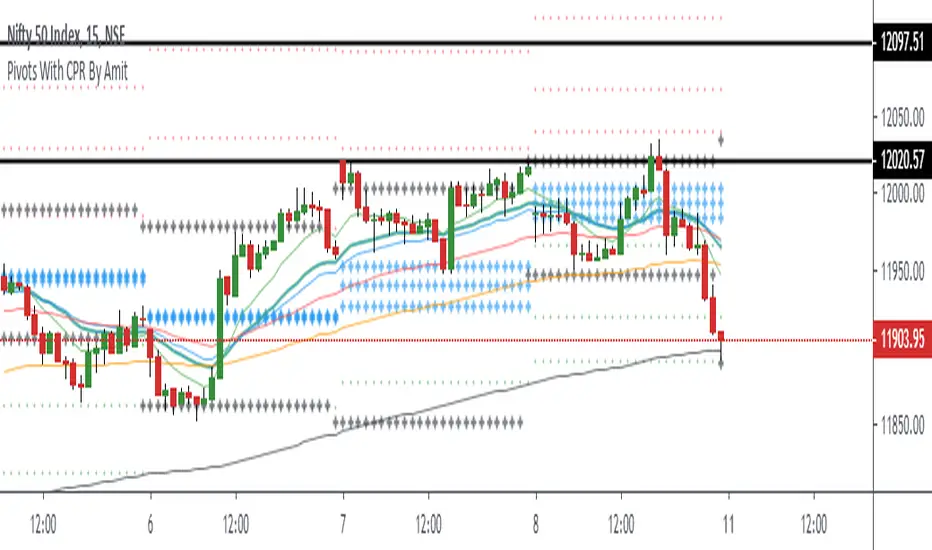
Pivots With CPR By AmitPivot With CPR combination with Previous Day High Low And Also combine the ema for trend confirmation
Simple AverageSimple average, with builtin plot of a true Weekly, Monthly, Quarterly and Yearly average
(A variation on Pivots, with only the P line (HLC/3))

QuantNomad - Significant Pivot Reversal Strategy AlertsAlerts for "Significant Pivot Reversal Strategy":
As one of the ways to filter out insignificant levels I decided to check that pivot point is not above/below neighbors, but check that it's above/below at least by a certain amount.
I use ATR, so in params, you can set length of ATR and also ATR multiplier. The new level will be calculated only if PP will be above/below neighbors by atr * atr_mult.
It seems this approach might help in some cases.

Murreys Math Lines Box OR Ratio PivotsI'm publishing my second script, though nothing extraordinary, I believe there is user group for Murry Math indies and the only "proper one" (According to my usage) I found was of RicardoSantos, here is the link :
He developed that script in 2014 and it is in need of update to Pine V4 and I'm doing the needful as its user.
All the updates from my end are listed below:
1. Updated to Pine V4
2. Automatic octave selection
3. In auto mode one can switch octave
4. This script is color coded with intention of use on dark theme, one can change the colors to use it on white background with simple few clicks as pinelines have been used
Other thing I want to add is that usage of this is not very clear to many users, so I'll do little explaining here;
Lets start with what is Octave? Octave is basically distance between square of two whole numbers, this is hard-fast method to calculate, Murry has made it far more complicated to use practically. In mathematical formula terms it could be something like this for script trading at 11890 (CMP)
Step 1: Square Root of CMP i.e Square Root of 11890 = 109.041 = Rounded to 109
Step 2: You can either take one whole number higher or lower than 109, which is 108 or 110. We will take 108
Step 3: Square of 108 = 11664 and Square of 109 = 11881
Step 4: Octave => Distance between (Lowlevel) 11664 and (Higherlevel) 11881
I've automated it so you don't need to calculate, but there is also manual entry possible if you want to calculate octaves yourself, there are different ways to calculate and some like to just take High and Low's of the day or week or month, whatever you like. When I used it I did it strictly this way, so automation is based on it. This is very subjective matter so don't ask to change the calculation of this, if I started doing that every second person would ask me to modify it to different calculation..and thats...just not possible to do.
This is output for calculation we just did above
This is octave shift option (Which basically shifts to next whole number square in above calculation)
Normal nomenclature on octaves and important color codes
+2/8: Extreme overbought = Blue Color and solid line
+1/8: OverBought
8/8: Hardest line to rise above (overbought) = White Color and solid line
7/8: Fast reverse line (weak)
6/8: Pivot reverse line = Yellow Color and solid line
5/8: Upper trading range
----------------------------------------
4/8: Major reversal line = Green Color and solid line
----------------------------------------
3/8: Lower trading range
2/8: Pivot reverse line = Blue Color and solid line
1/8: Fast reverse line (weak)
0/8: Hardest line to fall below (oversold) = White Color and solid line
-1/8: Oversold
-2/8: Extreme Oversold = Yellow Color and solid line
Other lines that I've not mentioned color codes for are minor and are usually plotted in dotted format.
Resources on complete technique to trade and importance of levels (highly recommended to read carefully before trading), if you don't know how to get this for free don't worry you can just google Murrey math and you will find it somewhere, its just that it would be in little scattered manner.
www.scribd.com
Enjoy!

RSI PivotIt is based on RSI. When RSI crosses (70)up and (30)down bands, it draws a price line.
Cheers :)

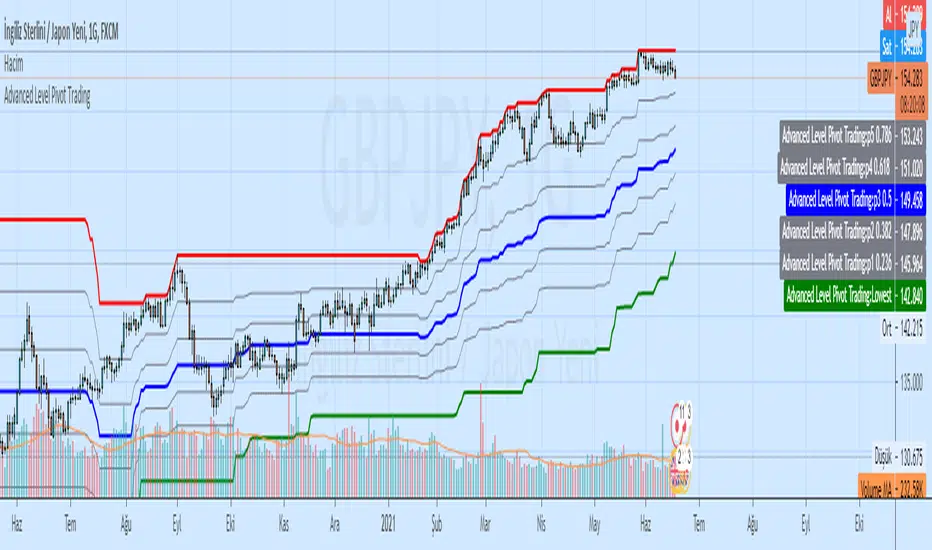
Advanced Level Pivot TradingAdvanced Level Pivot Trading
Highest Lowest Channel and Level Pivot (Fibonacci)
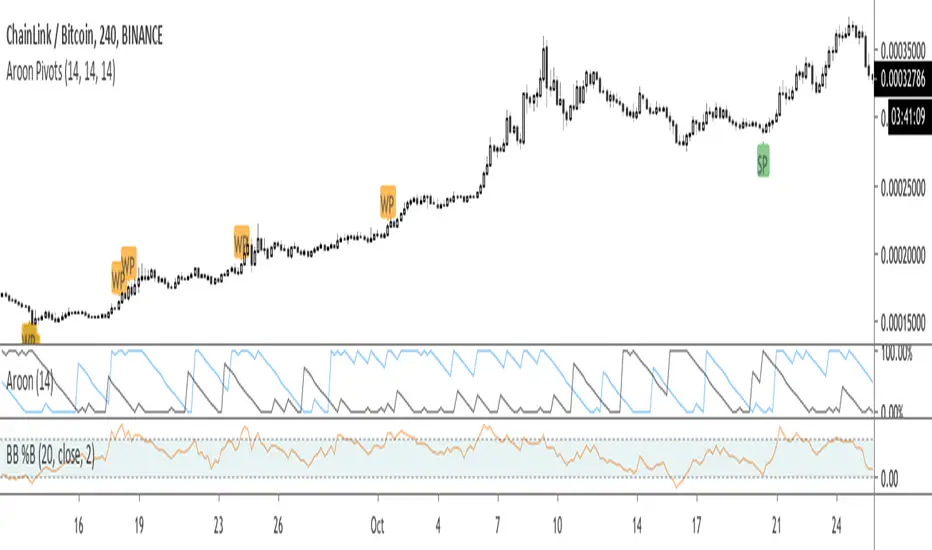
Aroon Pivots Beta 2.0THIS IS A BETA AND ONLY TO BE USED FOR TESTING PURPOSES
Upgraded Beta Version of the Aroon Pivots Beta.
PLEASE READ BELOW OF THE USAGE OF PIVOTS
Whats new in 2.0?
- Updated to a new Script: This is for two reasons (1) there have been some overall changed to the weaker signals to make then stronger and felt it was changed enough to differentiate and be able for beta testers to compare side by side, and (2) some users have had issues using the script and getting an error, which this hopefully fixes.
- Improved accuracy for the "weak" signals
- Color coded "strong" and "week signals and now renamed to set them apart as "SP" and "WP" respectively.
- Added confluence to signals to help improve all timeframes.
This script is the beta version of the Aroon Pivots for testing purposes and is not intended to be used in real trading.
========= AROON PIVOTS =========
The purpose of this script is to use the power of the Aroon Lines to determine when trends or portions of a trend have reached a certain level of exhaustion, which in turn can help discover pivot points or reversals. Aroon Lines (the Up and Down lines) are measures of time that compare previous highs and lows, as well as opens and closes, which when compared can give insight on a possible incoming trading move. Aroon is one of the few indications that was designed for this purpose to show possible moves instead of historic data.
========= HOW TO USE =========
It's fairly simple, but small labels are created that show when entry or exit is at its closing peak. Labels can be used to enter as a maximum opportunity in addition to minimal risk, while simultaneously can be used to close an already open position for maximum closing results.
========= ADDITIONAL NOTES =======
- Labels are printed when the criteria is met, however, the labels are not fully realized until candle close.
- Labels are not repainted.
- Labels are specific to their relative timeframe, so its expected that a lower timeframe pivot will not expand into a high timeframe label, especially is the labels are giving opposite pivots .
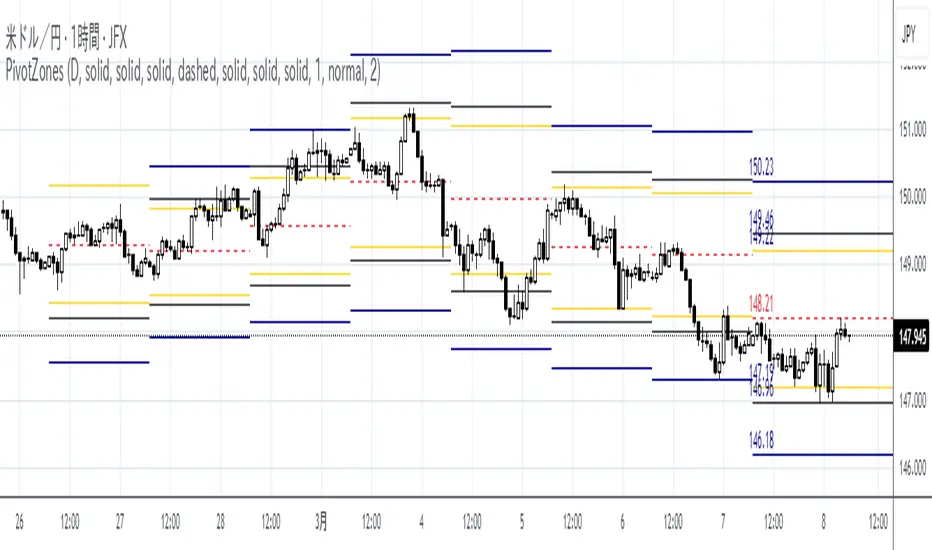
Neru_MultiPivots_ForDarkThemeNeru_MultiPivots_ForDarkTheme
________________________________
This script is plotting the classic PivotPoints into the charts, two for each interval.
These Pivots are adjusting automatically when you change the interval.
The following are supported:
1, 3, 5, 15: H4 Pivots R5-S5
5, 15, 30, 60, H2: Daily Pivots R5-S5
30, 60, H2, H3, H4, H6: Weekly Pivots R4-S4
H3, H4, H6, D: Monthly Pivots R3-S3
D, 2D, 3D, W, 2W: Quarterly Pivots R3-S3
2D, 3D, W, 2W, M, 3M: Yearly Pivots R2-S2
You cannot change these settings, but disable them seperately.
This is a universal indicator and appropriate to use in any market, due to the fact classic calculations are used.
Additional: You are able to set alerts onto single Pivots OR an entire interval.
There is also a version for light themes: Neru_MultiPivots_ForLightTheme (simply search in indicator´s library)
_________________________________
Warm regards,
Neru
