Pullback AlgoFlagship NRTH_ Premium Strategy
Comes included with the Essentials or Premium Package.
Indicator features
Built-In Alerts
Visual Risk Management
Customizable Entry Rules
Usage Tips
This strategy is designed for Swing Trading and Intra-Day timeframes (1hr+)
The algo targets pullbacks in an up or down-trending scenario allowing for multiple entries in a strong trending market.
Works for all markets with the ability to customize to your liking.
Backtesting Results Info
Period 1/1/2021-1/10/2021
Entry value at $1000 with 10x leverage
Binance standard taker fee rate (0.04%)
ATR Exits : 1:2 RR
-------------------------------------------
Disclaimer
Copyright NRTH_ Indicators 2021.
NRTH_ and all affiliated parties are not registered as financial advisors. The products & services NRTH_ offers are for educational purposes only and should not be construed as financial advice. You must be aware of the risks and be willing to bear any level of risk to invest in financial markets. Past performance is not necessarily indicative of future results. NRTH_ and all individuals associated assume no responsibility for your trading results or investments.
All investments involve risk, and the past performance of a security, industry, sector, market, financial product, trading strategy, or individual’s trading does not guarantee future results or returns. Investors are fully responsible for any investment decisions they make. Such decisions should be based solely on an evaluation of their financial circumstances, investment objectives, risk tolerance, and liquidity needs.
Punti Pivot

Quickfingers Luc's Base Breaking Strategy v2.5 - 3Commas EditionIntroduction
The strategy attempts to implement a popular price action strategy by Luc Thomas (a.k.a. Quickfingers Luc) typically referred to as a QFL base-breaking strategy specifically for the 3Commas platform. The Input settings have been redesigned to match the same inputs as the 3Commas My Bot Settings page. Only the "Deal Start Condition" section will echo the required QFL-related settings found in the original Quickfingers Luc's Base Breaking Strategy v2.5 to successfully implement the strategy.
The strategy revolves around price action movements that reveal “bases”, which are price levels of support that have a significant, rapid price surges called “bounces”. Once a base is revealed, the base price level is used as reference to implement multiple entries below the base using a layering technique of dollar-cost averaging to place multiple limit orders at various price levels below the base price. As price action breaks below the base price, the limit orders will be filled, and the take profit, breakeven and stop loss prices will be recalculated.
How is it original and useful?
This strategy is unique in that the strategy version fully supports the TradingView backtester, which will enable you to perform experiments with various settings to evaluate performance using the historical chart data. The study version implements the "Start Deal" and "Close Deal" alerts for you to integrate with 3Comma's "Trading View Custom Signal" start condition. Both script versions will provide the same configuration abilities. The following list is a brief description of its usefulness:
The ability to define the QFL base confirmation settings, including volume analysis.
The ability to define your preferred layering strategy of either dollar-cost averaging (DCA) or grid-like layers along with precise layer placement.
The ability to define your trading parameters like take profit and stop loss offsets, exchange commission rates, trading start time, and position size multiplication for each layer.
The ability to define flexible trade eligibility rules that can use other chart indicators, like RSI or EMA, to exclude the selection of base prices for trading.
The ability to set the visibility & color theme of the detailed statistics from the chart history pertaining to trading sessions started and closed, session durations, win rate, price action drops and bounces, as well as layer utilization.
How does it compare to other scripts in the Public Library?
The strategy offers a very detailed, comprehensive settings to implement the QFL base-breaking strategy ion 3Commas. The strategy version leverages the full features of the TradingView backtester to provide informative, detailed performance measurements surrounding this unique trading strategy. The study version will implement the latest alert framework called "Any Alert() Function" where you can create a single alert to handle multiple events, which include:
Deal Start
Deal Close
What does it do and how does it do it?
The strategy can be applied to any chart at any time frame, but the minimum should be no lower than 10 minutes. When applied to the chart for the first time, the default settings will work to render base price levels in orange and 8 DCA layers in thin blue lines. As you scroll through the chart's history you should see price action crossing the DCA layers, denoted with blue triangles, and a green take-profit line will render with green triangle denoting the crossing. Lastly, when a deal session begins upon the crossing of the first layer, the indicator will continue to identify base price levels, but the color of the price lines will be gray. When the trade session concludes upon the crossing of the take profit line, the indicator will switch the most recent base price line from gray to orange to make it active and eligible for trading.
As price action develops, the indicator will use the "Base Confirmation Settings" to look back by counting the number of bars to the left and right of a pivot low point, measure the price drops and bounces, and volume amounts to validate that they are within the specified values. If so, the indicator will draw an orange triangle beneath the candle bar to denote it as the pivot low point and begin rendering the orange line as the base price. The DCA layers will be calculated and offset relative to the base price using thin blue lines.
Optionally, the breakeven price line will be drawn to help visualize the true breakeven price which takes into consideration the exchange fees being applied. Base line, take profit, stop loss and DCA layer crossings will be denoted with colorful shapes to help visually recognize the events on the chart.
The volume is validated only at the pivot low candle. It will measure the volume against the moving average to determine base confirmation. A volume factor of 1 will mean that the volume must be at least the same value as the moving average value. A volume factor of 2 means it must be twice the moving average value.
Lastly, a table of statistics is positioned to the upper-right corner of the chart that summarize all the events that have taken place since the indicator began simulating deal sessions from the chart's history.
Strategy Results
The default settings are designed to define a "weak" QFL base to ensure that the indicator will render chart elements when first loaded as well as to allow the backtester to gather order executions and display performance summary. The strategy version is using $10,000 initial capital, a commission rate of 0.1% for both entries and exits, and a 1 tick slippage setting. It is also using 3.4881% of the equity for the Base Order Size, 4.7097% of equity for the first Safety Order Size. The Maximum Safety Trade Count is 7 with a Safety Order Volume Scale of 1.35, and a take profit of 5% with no stop loss. All other settings are defaults.
It is recommended that the indicator be "tuned" for your specific market in order to best implement the QFL trading strategy and obtain better desirable results. You do so by using the statistics table and observe the Mean Price Drop and Bounce values to learn what the indicator is detecting when it measures from the pivot low points. Using this information, you can adjust the Base Confirmation Settings accordingly, along with any volume specifications you require, to configure the indicator for the chart.
Always keep in mind that past performance may not be indicative of future results. Settings that seem favorable for one market may be found to be disastrous in another. Therefore, do take the time needed to understand how the settings will behave with the given chart symbol.
Enjoy! 😊👍
How to obtain access to the script?
You have two choices:
Use the "Website" link below to obtain access to this indicator, or
Send us a private message (PM) in TradingView itself.

Quickfingers Luc's Base Breaking Strategy v2.5Introduction
The strategy attempts to implement a popular price action strategy by Luc Thomas (a.k.a. Quickfingers Luc) typically referred to as a QFL base-breaking strategy. The strategy revolves around price action movements that reveal “bases”, which are price levels of support that have a significant, rapid price surges called “bounces”. Once a base is revealed, the base price level is used as reference to implement multiple entries below the base using a layering technique of dollar-cost averaging to place multiple limit orders at various price levels below the base price. As price action breaks below the base price, the limit orders will be filled, and the take profit, breakeven and stop loss prices will be recalculated.
How is it original and useful?
This strategy is unique in that the strategy version fully supports the TradingView backtester, which will enable you to perform experiments with various settings to evaluate performance using the historical chart data. The study version implements numerous custom alerts for you to build TradingView notifications around specific price action events and stay informed with market activity in real-time. Both script versions will provide the same configuration abilities where you can define:
Base confirmation settings, including volume analysis.
Your preferred layering strategy of either Dollar-cost averaging (DCA) or grid-like layers along with precise layer placement.
Your trading parameters like take profit and stop loss offsets, exchange commission rates, trading start time, and position size multiplication for each layer.
Flexible trade eligibility rules that can use other chart indicators, like RSI or EMA, to exclude the selection of base prices for trading.
The visibility of detailed statistics from the chart history pertaining to trading sessions started and closed, session durations, win rate, price action drops and bounces, as well as layer utilization.
How does it compare to other scripts in the Public Library?
The strategy offers a very detailed, comprehensive settings to address all types of markets found on TradingView where you can implement the QFL base-breaking strategy. The strategy version can be considered the first of its kind on TradingView to leverage the backtester to provide informative, detailed performance measurements surrounding this unique trading strategy. The study version will contain numerous custom alerts to aid in your notification preferences and stay informed on the indicator's activities:
Base Created
Base Cracked
Base Respected
Any Layer Cracked
Layer 1 Cracked
Layer 2 Cracked
Layer 3 Cracked
Layer 4 Cracked
Layer 5 Cracked
Layer 6 Cracked
Layer 7 Cracked
Layer 8 Cracked
Layer 9 Cracked
Layer 1 Respected
Layer 2 Respected
Layer 3 Respected
Layer 4 Respected
Layer 5 Respected
Layer 6 Respected
Layer 7 Respected
Layer 8 Respected
Take Profit Crossed
Stop Loss Crossed
What does it do and how does it do it?
It is recommended that you start with a chart that is on an hourly timeframe with the "Scale Price Chart Only" chart setting enabled. When applied to the chart for the first time, the default settings will work to render base price levels in orange and 8 DCA layers in blue using a Fibonacci-like sequence for the deviation offset relative to the base price. As you scroll through the chart's history you should see price action crossing the DCA layers, denoted with blue triangles, and a green take-profit line will render with green triangle denoting the crossing. Lastly, when a trade session begins upon the crossing of the first layer, the indicator will continue to identify base price levels, but the color of the price lines will be gray. When the trade session concludes upon the crossing of the take profit line, the indicator will switch the most recent base price line from gray to orange to make it active and eligible for trading.
As price action develops, the indicator will use the "Base Confirmation Settings" to look back by counting the number of bars to the left and right of a pivot low point, measure the price drops and bounces, and volume amounts to validate that they are within the specified values. If so, the indicator will draw an orange triangle beneath the candle bar to denote it as the pivot low point and begin rendering the orange line as the base price. The DCA layers will be calculated and offset relative to the base price using thin blue lines.
Optionally, the breakeven price line will be drawn to help visualize the true breakeven price which takes into consideration the exchange fees being applied. Base line, take profit, stop loss and DCA layer crossings will be denoted with colorful shapes to help visually recognize the events on the chart.
The volume is validated only at the pivot low candle. It will measure the volume against the moving average to determine base confirmation. A volume factor of 1 will mean that the volume must be at least the same value as the moving average value. A volume factor of 2 means it must be twice the moving average value.
Lastly, the very last bar will render a table of statistics that summarize all the events that have taken place since the indicator began simulating trading sessions from the chart's history.
Strategy Results
The default settings are designed to define a "weak" QFL base to ensure that the indicator will render chart elements when first loaded as well as to allow the backtester to gather order executions and display performance summary. The strategy version is using $10,000 initial capital, a commission rate of 0.1% for both entries and exits, and a 1 tick slippage setting. It is also using 3.4887% of the equity with a Position Size Multiplier of 1.35, using 8 total DCA layers, and a take profit of 5% with no stop loss. All other settings are defaults.
It is recommended that the indicator be "tuned" for your specific market in order to best implement the QFL trading strategy and obtain better desirable results. You do so by using the statistics table and observe the Mean Price Drop and Bounce values to learn what the indicator is detecting when it measures from the pivot low points. Using this information, you can adjust the Base Confirmation Settings accordingly, along with any volume specifications you require, to configure the indicator for the chart.
Always keep in mind that past performance may not be indicative of future results. Settings that seem favorable for one market may be found to be disastrous in another. Therefore, do take the time needed to understand how the settings will behave with the given chart symbol.
Enjoy! 😊👍
How to obtain access to the script?
You have two choices:
Use the "Website" link below to obtain access to this indicator, or
Send us a private message (PM) in TradingView itself.

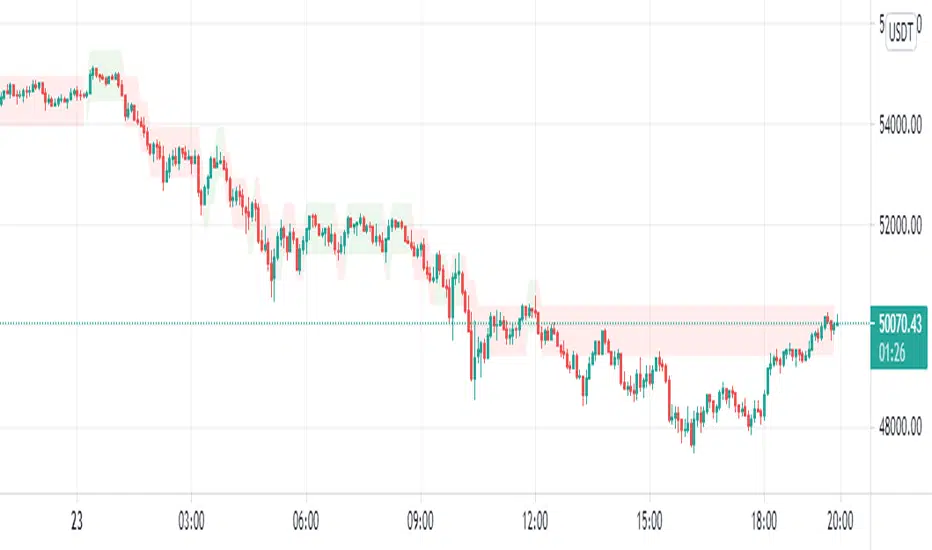
RSI Centered PivotsJust a simple RSI central pivot strategy I made for a friend.
Backtested on BYBIT:BTCUSD, 155m.
DISCLAIMER : Please do your own research into anything you use before using it to trade.

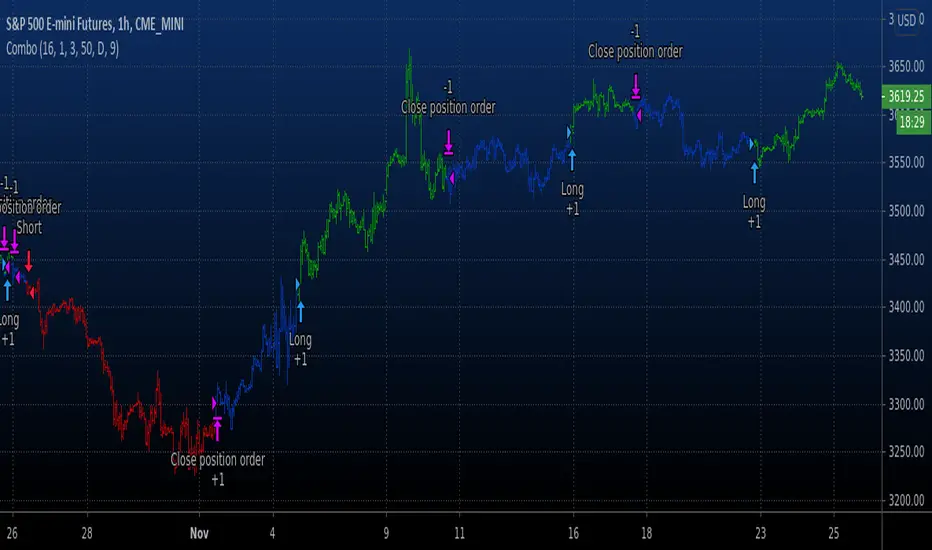
Pivot Reversal Strategy + alerts via TradingConnector to indicesSoftware part of algotrading is simpler than you think. TradingView is a great place to do this actually. To present it, I'm publishing each of the default strategies you can find in Pinescript editor's "built-in" list with slight modification - I'm only adding 2 lines of code, which will trigger alerts, ready to be forwarded to your broker via TradingConnector and instantly executed there. Alerts added in this script: 14 and 22.
How it works:
1. TradingView alert fires.
2. TradingConnector catches it and forwards to MetaTrader4/5 you got from your broker.
3. Trade gets executed inside MetaTrader within 1 second of fired alert.
When configuring alert, make sure to select "alert() function calls only" in CreateAlert popup. One alert per ticker is required.
Adding stop-loss, take-profit, trailing-stop, break-even or executing pending orders is also possible. These topics have been covered in other example posts.
This routing works for Forex, indices, stocks, crypto - anything your broker offers via their MetaTrader4 or 5.
Disclaimer: This concept is presented for educational purposes only. Profitable results of trading this strategy are not guaranteed even if the backtest suggests so. By no means this post can be considered a trading advice. You trade at your own risk.
If you are thinking to execute this particular strategy, make sure to find the instrument, settings and timeframe which you like most. You can do this by your own research only.

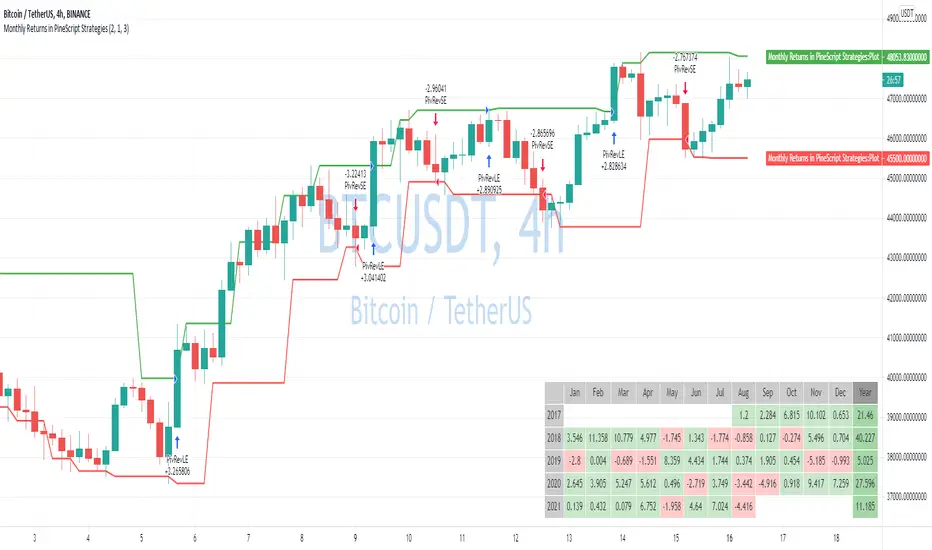
Monthly Returns in PineScript StrategiesI'm not 100% satisfied with the strategy performance output I receive from TradingView. Quite often I want to see something that is not available by default. I usually export raw trades/metrics from TradingView and then do additional analysis manually.
But with tables, you can build additional metrics and tools for your strategies quite easily.
This script will just show a table with monthly/yearly performance of your script. Quite a lot of traders/investors used to look at returns like that. Also, it might help you to identify periods of time when your strategy performed good/bad than expected and try to analyze that better.
The script is very simple and I believe you can easily apply it to your own strategies.
Disclaimer
Please remember that past performance may not be indicative of future results.
Due to various factors, including changing market conditions, the strategy may no longer perform as well as in historical backtesting.
This post and the script don’t provide any financial advice.
Pivot Reversal strategy long onlyPivot Point Reversal Strategy
Pivot point reversal strategy is based on the first support level’s price action during the bullish trend and the first resistance level during the bearish trend . Traders follow the main trend and enter into the trade after reversal analyzing pivot point levels.
This version is an upgraded version, combining the initial pivot point reversal strategy together with one of the most accuracy moving average in my opinion for day trade, the Least square moving average.
At the same time I applied an option to backtest using a date range and a leverage calculator.
The default options are optimized for BTC /USDT 2H charts, using 0.1% comission fee.
If you have any questions, let me know

Breakout Trend Follower V2This is a variation on my other Breakout Trend Follower script. In the other script, you can use a moving average to act as a filter for your trades (i.e. if the price is below the moving average, it won't go long). After making the tool that detects trends on higher timeframes, I wanted to see if that might be a better filter than a moving average.
So this script lets you look at higher time frame trends (i.e. are there higher highs and higher lows? If so, this is an uptrend). You only take trades when you are with the trend. You have the ability to select up to two trends to act as a filter. Each trend direction is shown on a table on the chart for easy reference. The current pivot highs and lows are plotted on the chart so you can see when you might be breaking both the current timeframe's trend and higher level trends.
What I found was that in general this does not perform as well as the other strategy, but it does seem to be a lot more picky with trades. Showing higher win rates and a better profit factor. It just takes a lot less trades and the net profit isn't as good.

Auto Harmonic Patterns - Long only StrategyThis is long only strategy where entry and exits are generated based on Harmonic Patterns.
Logic used for generation of harmonic patterns is same as the below script (Double top and bottom are removed in this script):
Now to generate entry and exit signals, following rules are used:
If there is bullish pattern:
Entry : If X is between Point B and D, then use X as entry point. Else use B as entry point. Entries are managed via stop limit orders.
StopLoss : D - ( atrMult times atr)
If there is bearish pattern and useReverseTradeOnBearishPattern is selected:
Entry : D + ( atrMult times atr)
StopLoss : If X is between Point B and D, then use X as stoploss. Else use B as stoploss
If there is any existing trade while new patterns are formed, then existing stoploss and target levels are updated accordingly instead of placing new order.
Optional Profit Targets : When takeInitialProfitOnTargets is selected, minimal profit (20% of open positions) is taken based on harmonic pattern profit targets. These targets are set only based on bullish pattern recognition
First Target : Lower of A and C
Second Target : Higher of A and C
Third Target: 1.618 times AD
Example of XABCD points are shown in below picture:
Other logic involved:
Apart from stoploss generated by patterns, there is also trailing stoploss which is simply based on trailingStopAtrMult times ATR
Stoplosses, entry points and target levels are updated only if new stoploss generated either by ATR or by harmonic patterns are higher than present stoploss. If not, previous stoplosses are used.
Happy trading. Let me know your views.

[USDCHF-USDCAD] H1 Predict signal DinhChienFX's [2 orders]Identify trend:
4 EMAS 50-100-150-200:
- Uptrend: ema: 50 > 100 > 150 > 200
- Downtrend: ema: 50 < 100 < 150 < 200
Pivot:
- Left: 15 candles
- Right: 15 candles.
- Uptrend: Higher low - Higher High
- Downtrend: Lower Low - Lower High.
Keltner Channel:
- Uptrend: Candle crosses Upper 2.
- Downtrend: Candlestick crosses the Lower 2 line.
Strong trend according to ADX indicator:
- DI: 9
- Smooth: 9
- ADX: 38
Order entry point:
- Buy: Upper Keltner
- Sell Lower Keltner
Take Profit/Stop Loss: atr (20) x2 = Height of Keltner channel from Lower to Upper line.

EmperorBTC's VWAP StrategyEmperorBTC's VWAP Indicator & Strategy
v2.1
coded by Bogdan Vaida
This indicator was created after EmperorBTC's conditions.
Good timeframes for it: 30', 15', 5'
To convert from strategy to study switch the commented lines in the beginning
and at the end of the script and vice versa.
What this indicator does is to check if:
o Pivot Point was crossed
o Stoch-RSI and VWAP were crossed in current or previous candle
o Candle (or previous candle) close is in the trend direction
If all these are true then it will go long or short based on direction.

[CADCHF] DinhChienFX's Predict signaltrend: crossing 2 times upper 2/lower 2 - stop/profit: 1/1 - Entry: Upper/lower 1, Entry 2: 0.66 (66%)
HH-HL/LL-LH: 15:15; ADX: 38, smooth: 9, DI: 9.
Order 1: 92 trades - 65.22% - R/R: 1/1
Order 2: 64 trades - 54.02% - R/R - 1/1.94 (fibonacci 66%)
Total 2 order: 156 trades - 59.62% - Net Profit: 201.46% - Max drawdown: 9.02%.
Commission: 4usd/trade
slippage: 2
1. Identify the trend
* On the chart:
a. Part of Dow theory: multi-trades active at the impulse waves.
Uptrend trend:
- HH / Higher High: The following peak is higher than the previous one .
- HL / Higher Low: The back bottom is higher than the previous one .
Downtrend:
- LL / Lower Low: The back bottom is lower than the previous one .
- LH / Lower High: The posterior peak is lower than the previous one
Pivot left: 15
Pivot right: 15
b. Keltner price channel:
- Uptrend: Go above Upper 2 two times
- Downtrend: Down to Lower 2 two times
* Under Chart:
ADX indicator: Used to identify a strong trend
- ADX smooth: 9
- DI: 9
- ADX = 38
2. Entry point:
- Buy: Buy limit at the Upper Keltner channel.
- Sell: Sell limit at the Lower Keltner channel.
3. Take profit, stoploss
ATR indicator (20) ( Average true range ) * 2

Ganntime Grid Bot long strategy This is a simulating 3commas grid and DCA robot strategy implementation. In AI mode, the default grid width of btc is 500, and the default grid width of eth is 25. Anyone can use it for free. You can also cancel the AI mode option and manually set the grid size and grid width. The initial order, safety order size, stop loss and take profit parameters are consistent with the configuration and usage of 3commas dca bot.
Predict DinhChienFX's1. Identify the trend
* On the chart:
a. Part of Dow theory: multi-trades active at the impulse waves.
Uptrend trend:
- HH / Higher High: The following peak is higher than the previous one.
- HL / Higher Low: The back bottom is higher than the previous one.
Downtrend:
- LL / Lower Low: The back bottom is lower than the previous one.
- LH / Lower High: The posterior peak is lower than the previous one
b. Keltner price channel:
Uptrend: Go above Upper 2
Bearish trend: Down to Lower 2
* Under Chart:
Stochastic indicator: 21 past candles
- Uptrend: Index K and D surpass 80
- Buy zone: Index D is large 80.
----------------------------
- Downward trend: K and D indexes go down to 20.
- Sell zone: Index D is less than 20.
RSI indicator: 21 past candles
- Uptrend: value exceeds 80.
- Downward trend: value exceeds 20.
ADX indicator: Used to identify a strong trend
- ADX smooth: 9
- DI: 9
2. Entry point:
- Buy: wait to buy on the Upper Keltner channel.
- Sell (sell): wait for sell at the Lower Keltner channel.
3. Take profit, stoploss
ATR indicator (20) (Average true range) * 2

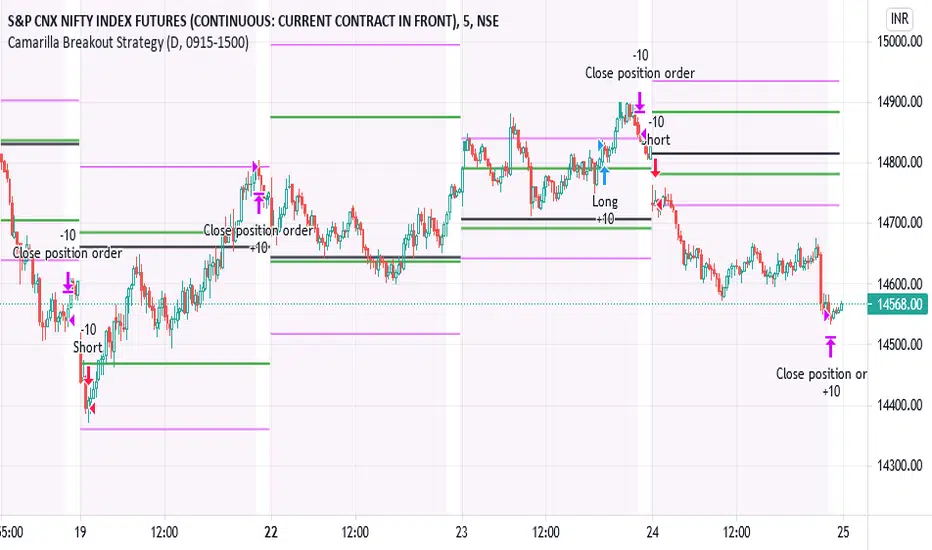
IPB_CamBOTSThis is an intraday strategy.
Camarilla Level 3 breakout strategy.
Conditions are long above Camarilla R3 only under certain circumstances related to the distance between Central Pivot and Level 3 pivots and also the location of the Opening price of the day.
Exit is assumed to be at the end of the day. It is suggested to exit the trade if price falls back below Camarilla R3 in case of longs.
Logic similar for shorts as well but on the other end.
Position Sizing :
10 lots of Nifty futures assumed for backtesting.
The margin required for 10 lots of Nifty futures is around 10-12 lacs. Hence 25,00,000 capital is assumed which is roughly double the margin required for taking positions in the real market. In other words not all capital is used if 10 lots of futures is traded. Brokerage assumed is 50 per order as against the 20 per order in real market with respect to retail brokers. Currency assumed is INR. However there is no option to choose INR and therefore you might see the currency as USD. Hence please assume the currency as INR.
Disclaimer:
Past performance does not reflect the future perfomance. Hence the author is not responsible for any trading loss arising out of this strategy. Please use at your own risk and responsibility.
IPB_AOPM_BOThis is an intraday trading strategy.
Concept :
Underlying concept is that Amateurs open the market and Professionals close the market. Hence this system tries to capture the breakout in the afternoon session. After One PM Breakout (AOPM breakout). This essentially means that one has to go long once the high of the market till 1 pm is broken out and similarly go short once the low of the market till 1 pm is broken down.
Position sizing:
This strategy assumes taking 10 lots of Indian Market Index which approximately requires a margin of around INR 25,00,000. Hence capital is chosen as INR 25,00,000. Currency is assumed to be INR , however the system shows USD as currency as there is no INR option available. Commissions assumed to be at INR 50 per order as against the INR 20 per charged by retail brokers in India in real world market.
Disclaimer:
Past performance is not representative of future performance. Hence the author is not responsible for any trading loss arising out of implementing this strategy. Hence please implement at your own risk. Trading can result in loss of entire capital.

BuyHighSellLow - Pivot pointsAnother version of buy-high sell-low strategy. This time using pivot points.
Strategy is simple:
Buy when price closes above R1 of pivot point level
Sell when price closes below S2 of pivot point level.
Use Resolution parameter to define pivot points. Higher the resolution, longer the trade time will be. If resolution is set to same as symbol, strategy will consider Higher Timeframe Multiplier to derive pivot point resolution.
Uncheck HideBands to see bands created from pivot points.
Another Buy-High Sell-Low strategy published is using donchian channel (Link below)

BBofVWAP with entry at Pivot PointThis strategy uses BB of VWAP and Pivot point to enter and exit the Long position.
settings
BB length 50
BB Source VWAP
Entry
When VWAP crossing up BB midline and price/close is above weekly PivotPoint ( you can also use Daily pivot point )
Exit
When VWAP is crossing down BB lower band
Stop Loss
Stop loss defaulted to 5%
Note : Long will position will be exited on either VWAP crossing down BB lower band or stop loss is hit - whichever comes first . Being said that some time your stop loss exit is less than 5% which saves from more losses.
Entry is based on weekly Pivot point , so any time frame below weekly will work perfect. I have tested t on 30 min , 1 HR , 4 Hr , Daily charts. Even weekly setting shows good results , that will work for long term investing style.
if you change Pivot period to Daily , chose time frames below Daily.
I also noticed this strategy mostly do not enter Long position in a down trend. Even it finds one , it will be exited with minimal loss.
Warning
For the use of educational purposes only

Combo Backtest 123 Reversal & High and Low Levels This is combo strategies for get a cumulative signal.
First strategy
This System was created from the Book "How I Tripled My Money In The
Futures Market" by Ulf Jensen, Page 183. This is reverse type of strategies.
The strategy buys at market, if close price is higher than the previous close
during 2 days and the meaning of 9-days Stochastic Slow Oscillator is lower than 50.
The strategy sells at market, if close price is lower than the previous close price
during 2 days and the meaning of 9-days Stochastic Fast Oscillator is higher than 50.
Second strategy
This script shows a high and low period value.
Width - width of lines
SelectPeriod - Day or Week or Month and etc.
LookBack - Shift levels 0 - current period, 1 - previous and etc.
WARNING:
- For purpose educate only
- This script to change bars colors.
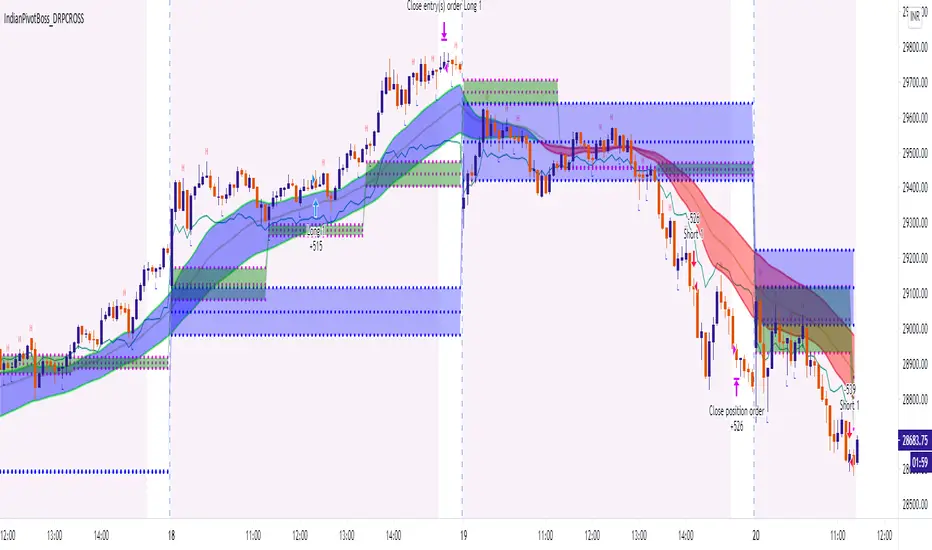
IndianPivotBoss_DRPCROSS_V2This strategy is an intraday strategy based on Developing pivot cross.
Long is generated when price crosses above developing pivot.
Short is generated when price crosses down developing pivot.
It also looks into developing pivot width for an expansion before taking into consideration of the above signals thereby providing signals only when a possibility of a trend emerges.
Pls note that past performance is not indicative of future performance.
Hence use it at your own risk. There is no guarantee for profits and there is always a possibility of losing entire capital in trading.
Pivot STRTGY_V1This Strategy operates on a Daily Time Frame and decisions are made based on monthly Pivot Points.
Choosing different time frames and pivot periods influences trading decisions and is not recommended
The script contains the following calculations:
-Pivot Points,
-Short and long term moving averages (sma, ema, getting),
-Bollinger bands,
-Trend following
The strategy aims to keep the asset profitable for as long as possible by predicting the turning points of the price.
Therefore, it is not suitable for day-trade.
Average holding period of assets is 15-20 days.
The script makes decisions to buy or sell when the price is above or below the determined averages and pivot points.
In this way, it follows the trend and aims for maximum profit.
It continuously makes calculations for the distortion conditions of the trend and generates orders to exit the position when the necessary conditions are met to stop the loss.

Algonize Pivot Strategy (APS)This study is based on several Price Action parameters of :-
• Pivot Points,
• Higher High and Lower Lows,
• High Low Index ,
• Support and Resistance.
► How To Use This Strategy?
This is a pure scalping strategy and it is advised to use this only with algo trading systems. Due to high trade frequency.
► This Strategy has inbuilt custom time frame backtester, which enables you to test for performance between any date or check for a single day.
► To Create Alerts for algo trading in this strategy simply Check "Activate Algo" from Settings then Create new alert , select your strategy in condition box, and now scroll down to message box and write
{{strategy.order.comment}}
That's it , Just Click on Create Alert Button
Backtest Values Used:-
Initial Capital : 1000000
Order Size (Lots) : 1 (Contract) Lots
Pyramiding : 0 orders
Commission : 0.003%
Sharpe Ratio : 1.741
Profit Factor : 1.174
Test Yourself and give feedback.
PM us to obtain access.

Swing Index System - Heiken Ashi Pivot Breakout StrategyFor Educational Purposes. Results can differ on different markets and can fail at any time. Profit is not guaranteed.
This only works in a few markets and in certain situations. Changing the settings can give better or worse results for other markets. This is a breakout strategy that uses the heiken ashi bars to find the support and resistance levels or the swing pivots to try to objectively find a breakout. When the price breaks out of a swing pivot, breakout can be confirmed and a strategy can be made. The trade exits as soon as in profit when the heiken ashi bar changes color, when the price swings start to slow down, or when the price breaks below a swing pivot. There might be many strategies and possible ideas that can be made just from knowing where the swing pivots are alone. For this one, I decided to try to emulate Wilder's Adam Theory approach by entering only a specific criteria when it makes new highs or lows that I experimented with. The Swing Index System seems to be similar to what he describes in his book (or perhaps it is the same thing).
Some say that price is the ultimate indicator, but not many really know what that really means. This is yet another approach to try to interpret what that means. This strategy only contains a piece of the complete breakout and trend strategy approach of the Adam Theory and won't be profitable in every market under every situation. This does not include price patterns that the Swing Index System is said to be able to find such as chart patterns, wedges, tops/bottoms, etc. This only includes the small breakout portion requirement in the book. I included specific entry and exit criteria to make the strategy work well that involves nothing but the price action of the swing points only due to the lack of the other missing pieces. It does not contain the missing pieces. Despite this, it can still help find where breakouts might be in an objective matter using the Swing Index System as a standalone trading system and it doesn't involve lookbacks or anything but price alone.
