Round NumbersRound Numbers
This indicator is a high-precision tool designed to automatically visualize psychological price marks and "round numbers" on your chart. It helps traders identify key areas where institutional orders and market sentiment often cluster, providing a clear map of potential support and resistance zones based on mathematical multiples.
Key Features:
11 Fully Configurable Level Groups: The indicator provides 11 independent level groups, pre-set to psychologically significant intervals (10, 50, 100, 500, 1,000, 5,000, 10,000, 50,000, 100,000, 500,000, and 1,000,000).
Complete Customization: Every level can be individually toggled. Users can define the specific multiple, line color, thickness, and line style (Solid, Dashed, or Dotted) to distinguish between major and minor levels.
Dynamic Range Adaptation: The script calculates and draws lines based on the recent price action, ensuring the chart remains relevant to the current trading range without manual adjustment.
Performance Optimized: Utilizing an efficient line-pooling system, the indicator maintains high performance and ensures smooth chart scrolling while staying within platform drawing limits.
Use Cases:
Psychological Levels: Quickly identify major price magnets (e.g., Gold at $2500, $2600).
Grid Trading & Visualization: Create a clean visual grid for systematic entry and exit strategies.
Market Structure Analysis: Assist in recognizing "Big Round Numbers" where liquidity usually resides and where reversals are more likely to occur.
Settings:
For each of the 11 levels, you can configure:
Show Level: Enable or disable the specific group.
Multiple Value: The price interval for the lines (e.g., "100" creates a line every 100 points).
Color: Choose any color and transparency for the lines.
Width: Set the line thickness from 1 to 5.
Line Style: Select between Solid, Dashed, or Dotted appearances.
Livelli e punti pivot

HMA Pivot Buy/Sell (only) + AlertsThis Pine Script is a lightweight indicator that plots only HMA-based pivot Buy/Sell signals and provides alert conditions for them.
What it does
Calculates a Hull Moving Average (HMA) using either:
a dynamic length based on the chart timeframe, or
a custom user-defined length.
Detects HMA pivot points (local turning points):
Buy signal when the HMA forms a local minimum (trend turns up).
Sell signal when the HMA forms a local maximum (trend turns down).
Optionally plots the HMA line and prints only the Buy/Sell markers on the chart (no extra arrows/emoji/labels from other systems).
Adds TradingView alerts for Buy, Sell, and combined Buy/Sell events.
Signal logic
Buy (HMA Pivot Low) triggers when:
HMA > HMA and HMA < HMA
Meaning: the HMA was falling, formed a bottom, and has started rising.
Sell (HMA Pivot High) triggers when:
HMA < HMA and HMA > HMA
Meaning: the HMA was rising, formed a top, and has started falling.
Inputs
Source: price source used to compute HMA (default: close).
Use Custom HMA Length: enables manual override.
Custom HMA Length: manual HMA period (default: 55).
Alerts: only on bar close:
If enabled, alerts fire only after the bar closes (confirmed signals).
If disabled, alerts can fire intrabar (faster but less stable).
Draw signal on pivot bar (offset -1):
If enabled, markers are drawn on the pivot bar (one bar back) using offset = -1.
If disabled, markers are drawn on the confirmation bar (no offset).
Show HMA line: toggles display of the HMA line.
Alerts available
BUY (HMA Pivot) — triggers on Buy signal.
SELL (HMA Pivot) — triggers on Sell signal.
BUY/SELL (HMA Pivot) — triggers on either Buy or Sell.
Each alert message includes ticker, timeframe, and close price via placeholders:
{{ticker}}, {{interval}}, {{close}}.

Smart Money Concept Change of Character Break of StructureSMC Structure
Visualizes Change of Character (CHoCH) and Break of Structure (BoS) - two fundamental Smart Money Concepts for identifying trend reversals and continuations.
This is the 1st version of an implementation of this concept.
It is NOT supposed to be used as a signal but a confirmation. Best use during NYSE hours.
Full Description
Overview
This indicator automatically detects and displays two core Smart Money Concepts (SMC) directly on your chart:
CHoCH (Change of Character) – The first structural break against the prevailing trend, signaling a potential reversal
BoS (Break of Structure) – A structural break in the direction of the current trend, confirming continuation
These concepts are essential building blocks of SMC trading methodology, helping traders identify where institutional players may be entering or exiting positions.
How It Works
The indicator uses pivot-based swing detection to identify significant highs and lows. When price breaks through these levels, it classifies the move as either a CHoCH or BoS based on the current trend context.
CHoCH (Change of Character)
Occurs when price breaks structure AGAINST the current trend
First warning sign that the trend may be reversing
Displayed as a solid horizontal line with "CHoCH" label
Green = Bullish reversal | Red = Bearish reversal
BoS (Break of Structure)
Occurs when price breaks structure IN THE DIRECTION of the current trend
Confirms that the existing trend remains intact
Displayed as a dashed horizontal line with "BoS" label
Teal = Bullish continuation | Maroon = Bearish continuation
Visual Example
Uptrend with BoS (continuation):
HH ◄── BoS (trend continues)
/
HL
/
HH
/
HL
Uptrend → CHoCH → Downtrend (reversal):
HH
/ \
HL \
LL ◄── CHoCH (trend reversal!)
Settings
Pivot Settings
Pivot Lookback: Number of bars used to identify swing highs/lows (default: 5). Higher values = fewer but more significant structure points.
Display Options
Show CHoCH: Toggle CHoCH visualization
Show BoS: Toggle BoS visualization
Show Swing Points: Display SH/SL labels at detected pivots
Extend Lines to Right: Extend structure lines into future bars
Show Info Table: Display current trend and last swing levels
Show Trend Background: Color the chart background based on trend direction
Colors
Fully customizable colors for all elements
How to Use
Identify the trend: Look at the sequence of CHoCH and BoS signals to understand market structure
Watch for CHoCH: A CHoCH signals potential reversal – wait for confirmation before trading against the previous trend
Trade with BoS: BoS confirms trend continuation – look for entries on pullbacks in the direction of the trend
Combine with other SMC concepts: Works great alongside Order Blocks, Fair Value Gaps, and liquidity concepts
Tips
Use higher pivot lookback values on higher timeframes for cleaner signals
A CHoCH doesn't guarantee reversal – it's the first warning sign, not confirmation
Multiple BoS signals in a row indicate a strong, healthy trend
Look for CHoCH occurring at key levels (support/resistance, order blocks) for higher probability setups
Feedback Welcome!
This is an open-source indicator and I'd love to hear your thoughts!
Please comment below if you have:
Feature requests or ideas for improvements
Bug reports or issues
Suggestions for additional SMC concepts to add
Your feedback helps make this indicator better for everyone. Happy trading! 🚀

Wiz ATRAverage True Range for given day based off past X amount of time periods. Best used by Trader Dante who is a ledge

ATR High and Low Offset from PriceAverage True Range based on last X time periods. Learned this from the master Trader Dante, but wanted to code my own ATR indicator for practice and I noticed his keeps moving throughout the day on BTC, so testing my own.

Custom Session ORB - Extending Past Current CandleCustom Session ORB - Extending Past Current Candle
This indicator plots Opening Range Breakout (ORB) levels for one or two customizable trading sessions directly on your chart. It dynamically tracks the high, low, and midpoint of the defined session(s) and extends these levels beyond the session using a configurable offset.
Features:
Supports two custom sessions.
New York and Asia pre-saved.
Automatically tracks session High, Low, and Mid.
Option to extend ORB levels past the live candle.
Option to display only the most recent ORB for a clean chart.
Configurable line thickness, style, and label size.
Works in Eastern Standard Time (EST) without manual adjustment.
Settings:
Show Labels: Toggle to display ORB values on chart.
Label Font Size: Small, Normal, Large.
Mid Line Style: Solid, Dashed, or Dotted.
ORB Line Thickness: Set line thickness of ORB levels.
Extend Past Current Candle by N Bars: Controls how far the ORB extends visually.
Show Only Current ORB: Cleans chart by removing previous session ORB levels.
Enable Session 1 / 2: Toggle individual sessions on/off.
Session Time: Set the start and end times for each session (automatically in EST).
How It Works:
The indicator monitors the defined session time, records the high, low, and midpoint, and draws lines at those levels. When the session ends, the lines are extended by the specified offset for easy breakout visualization. Labels can optionally show the exact price levels.

Support and ResistanceSupport & Resistance Zones
This indicator automatically identifies support and resistance zones by clustering confirmed pivot highs and lows into statistically valid price areas.
Instead of drawing single horizontal lines, it creates price zones whose width is dynamically controlled using ATR (Average True Range), allowing the zones to adapt to market volatility.
Core Logic
The indicator scans a user-defined number of historical bars and detects pivot highs and pivot lows using a configurable pivot strength.
Each new pivot is evaluated against previously detected zones:
A zone becomes visible only after receiving sufficient confirmation (minimum number of pivot touches).
This ensures that only structurally meaningful levels are drawn.
Zone Construction Rules
Zones are formed by grouping pivot points whose total price range remains within ATR range
Each zone expands dynamically as new pivots confirm it
Zones are drawn as rectangular areas, not lines
Zones extend to the right, remaining active until price structure changes
This approach avoids over-plotting and reduces noise commonly seen in traditional support/resistance tools.
Dynamic Zone Coloring
Zones automatically change color based on current price position:
Support Color → Price is above the zone
Resistance Color → Price is below the zone
Neutral (In-Zone) Color → Price is trading inside the zone
This makes it easy to visually assess market context without additional indicators.
Inputs Explained
Logic Settings
Bars to Apply
Number of historical bars scanned to detect pivots and construct zones.
Pivot Strength
Number of candles required on both sides of a pivot high/low for confirmation.
Min Pivot Confirmation
Minimum number of aligned pivots required before a zone is drawn.
Styling
Support, resistance, and in-zone colors
Zone fill transparency
Why This Approach
Uses price structure, not arbitrary levels
Adapts to market volatility via ATR
Filters out weak, single-touch levels
Works across all markets and timeframes
This indicator is designed to highlight areas of interest, not generate buy or sell signals.
It is best used in combination with trend, momentum, or volume-based tools.

AperonFx Pivot Points ATRThis indicator builds on classic pivot point methodology and enhances it with volatility-based ATR offsets to define adaptive support and resistance zones.
The pivot level is derived from the prior period’s price data, while the surrounding levels are calculated using the current day’s ATR to reflect prevailing market conditions.
Support and resistance are placed at incremental distances of 0.5, 1, 1.5 and 2 ATR away from the pivot, creating a structured price framework.
Users can adjust the pivot calculation method, reference timeframe, and visual presentation to suit their workflow.

AperonFx Pivot Points 1.1This indicator plots ATR-based pivot levels with a clean, institutional layout.
The central pivot (P) is calculated from the selected timeframe and price formula, while support and resistance levels are placed at equal distance steps above and below the pivot.
Users can choose between an automatic step based on ATR or a fixed price step for fully controlled, symmetric levels.
All levels are drawn as continuous segments that align precisely with the active pivot period.
Price annotations are displayed in a minimal, unobtrusive style and always match the exact level values.
The indicator is designed to remain consistent across chart timeframes without recalculation drift.
It is intended for traders who want clear, structured reference levels rather than reactive signals.

Magical Lines (Dot-to-Dot)Automatically Support/Resistance as Magical Lines calculate from Daily ATR Range. This Indicator works with all Stocks/FnO/Index/Commodity.

Structure Lite - Automatic Major Trend LinesStructure Lite – Pivot-Based Market Structure Visualization
OVERVIEW
Structure Lite is an open-source charting tool designed to assist traders in visualizing higher-timeframe market structure. The script identifies major swing points using high-period pivot analysis and projects structural support and resistance lines directly on the chart. Its purpose is to highlight persistent market structure while minimizing visual noise.
CORE CONCEPTS & CALCULATIONS
Pivot Identification
The script uses Pine Script’s built-in ta.pivothigh() and ta.pivotlow() functions to identify confirmed swing highs and lows. A pivot is only validated after a user-defined number of bars (Major Pivot Lookback) have formed on both sides of the price extreme, ensuring that only structurally significant pivots are selected.
Structural Pairing
Each structural line is created only after two consecutive pivots of the same type are confirmed (high-to-high or low-to-low). The script stores the price and bar index of these pivots and uses them as fixed anchor points.
Line Projection
Once a valid pivot pair is formed, the script draws a line between the two points using line.new() and extends it forward using extend.right. These lines represent projected structural boundaries rather than trade signals.
Object Management
To maintain chart clarity and performance, the script manages all drawn objects through a line array. A FIFO (First-In, First-Out) method is applied so that only the three most recent structural lines remain visible. Older lines are automatically deleted as new ones are created.
DESIGN PHILOSOPHY & ORIGINALITY
While many indicators plot frequent swing points or short-term pivots, Structure Lite focuses on structural persistence. By filtering for higher-period pivots and limiting the number of displayed projections, the script emphasizes dominant market structure rather than short-term fluctuations. This approach is intended to support discretionary analysis, not replace it.
HOW TO USE
Major Pivot Lookback
Increase the value to focus on higher-timeframe structure (e.g., swing or position trading).
Decrease the value to visualize intraday structural levels.
Visual Encoding
Green lines represent projected structural support
Red lines represent projected structural resistance
Visibility Control
A boolean input allows all structure lines to be hidden instantly to restore a clean price chart.
LIMITATIONS & DISCLAIMER
This script is a visualization tool only. It does not generate trade signals, entry or exit points, alerts, or directional forecasts. All plotted levels are derived from historical price action and may change as new pivots form. The script is provided for educational and analytical purposes and should be used in conjunction with other forms of market analysis

SuperTrend Weighted by Divergence█ OVERVIEW
SuperTrend Weighted by Divergence is a trend-following indicator based on the classic SuperTrend, enhanced with dynamic ATR weighting driven by divergences. Its key feature is adaptive behavior: when a divergence appears, the indicator temporarily reduces the ATR multiplier, allowing the trend line to react faster to potential market reversals.
The indicator remains clean, visually clear, and well suited for traders who want to combine trend-following with early detection of weakening momentum.
█ CONCEPT
One of the biggest drawbacks of trend indicators is their lagging nature, caused by the characteristics of source data. Classic SuperTrends react only after the trend has already developed, which often leads to late entries or exits.
The idea behind SuperTrend Weighted by Divergence is to introduce dynamic adjustment of the trend line in response to the first signs of trend weakening.
Instead of treating ATR as a constant volatility buffer, the indicator temporarily modifies its impact when the market sends warning signals in the form of price–oscillator divergences.
For divergence detection, a hidden auxiliary oscillator called “MPO4 Lines – Modal Engine” (default settings) is used. This oscillator is not displayed on the chart – only the points where divergences are detected are shown as markers on price bars.
Divergences do not generate direct entry signals; they are used solely to temporarily adjust the behavior of the SuperTrend.
If, after detecting a divergence against the current trend, a divergence in line with the trend appears, the previous divergence is invalidated and the SuperTrend returns to its standard behavior (base ATR multiplier).
█ FEATURES
Data sources:
- ATR (Average True Range)
- Reference point: HL2 (high/low average)
- MPO4 Lines – Modal Engine oscillator (hidden, used only for divergence detection)
Divergence logic:
- Bullish divergence: lower low in price + higher low in the oscillator
- Bearish divergence: higher high in price + lower high in the oscillator
- Divergences are detected using pivots (left/right)
- Divergence detection is delayed by the pivot length, as confirmation requires a fixed number of bars on the right side
Divergence impact:
- After a divergence is detected, the ATR multiplier is reduced
- The reduction strength is controlled by Divergence Sensitivity
- The effect is active only for a limited number of bars – 200 bars by default (divBars)
- The effect is canceled on trend change or when a trend-aligned divergence appears
Trend change logic:
- Trend changes only after a confirmed close beyond the trailing line
- No repainting
- Trend lines break at reversal points
Visual signals:
- “Buy” and “Sell” labels only on confirmed trend changes
- Optional bar coloring based on current trend (Color bars by trend)
- Soft fill between price and the trend line
- Divergence markers (dots above/below bars) shown at the point of divergence detection, not across the entire divergence structure
Alerts:
- Buy Signal – trend change to bullish
- Sell Signal – trend change to bearish
- Bullish Divergence
- Bearish Divergence
█ HOW TO USE
Adding the indicator:
Paste the code into Pine Editor or search for “SuperTrend Weighted by Divergence” on TradingView
Main settings:
- ATR Length – ATR period
- Base ATR Multiplier – base SuperTrend width
- Pivot Length – divergence sensitivity and detection delay
- Divergence Sensitivity – strength of divergence impact (0.0–1.0)
- Color bars by trend – enable / disable bar coloring
- Line and fill colors – fully customizable
Interpretation:
- Green line and bars = uptrend
- Red line and bars = downtrend
- Divergence against the trend = possible weakening and faster SuperTrend reaction
- Trend-aligned divergence = return to standard SuperTrend behavior
- No divergence = classic, stable SuperTrend behavior
█ APPLICATIONS
Ideal for:
- Trend-following
Entering positions only in the direction of the current trend, using the SuperTrend as a directional filter.
- Early detection of trend weakness
Repeated divergences against the trend may indicate decreasing momentum and a potential upcoming reversal.
- Markets with variable dynamics (crypto, indices, forex)
Entries based on trend changes, preferably confirmed by other tools such as Fibonacci levels, RSI, support/resistance, or market structure.
- Scalping, day trading, and swing trading (with parameter adjustments)
Increasing Divergence Sensitivity to around 0.4–0.5 produces many more signals on small, often short-lived moves.
These settings work well for scalping and day trading, but are not ideal for swing trading, as they tend to generate more false signals and frequent trend changes.
█ NOTES
- Works on all markets and timeframes
- Divergences are used to adapt SuperTrend behavior, not as standalone entry signals
- Higher Divergence Sensitivity = faster reaction and more signals
- Lower Divergence Sensitivity = smoother trend and fewer changes
- Best results are achieved by tuning parameters to the instrument and trading style

Best Algo (SIIT) By Nagaraj HiremathBest Algo (SIIT) By Nagaraj Hiremath is Based on Ema,Pivot,Renko Candle

Open Interest Bubbles [BackQuant]Open Interest Bubbles
A visual OI positioning overlay that aggregates futures open interest across major venues, normalizes it into a consistent “signal strength” scale, then plots extreme events as bubbles, labels, and optional horizontal levels directly on price.
What this is for
Open interest is one of the cleanest ways to track when positioning is building, unwinding, or aggressively shifting. The problem is raw OI is noisy, exchange-specific, and hard to compare across time. This script solves that by:
- Aggregating OI across multiple exchanges.
- Letting you choose what “OI signal” you care about (raw, delta, percent versions).
- Normalizing the signal so “big events” are easy to spot.
- Plotting those events as bubbles and levels at the exact price they occurred.
You end up with a clean, fast visual map of where large positioning changes occurred, and where those events may later matter as reaction points.
────────────────────────────────────────────────────────────
Plotting types (what you can display)
Bubbles
This mode plots OI events as size-bucketed circles on the chart. Bigger bubbles represent stronger normalized events. You can tune:
- Bubble sizing by bucket (Tiny → Huge).
- Heatmap vs solid color styling.
- Signed vs unsigned coloring (positive/negative separation or magnitude-only).
Best use:
- Spotting “where something changed” at a glance.
- Identifying clusters of positioning events around key price zones.
- Seeing whether the market is repeatedly building/closing positions at similar levels.
Levels
Levels mode draws a horizontal line at the anchor price when an extreme OI event triggers. These act like “positioning memory” levels:
- They do not claim to be support/resistance by themselves.
- They highlight prices where the derivatives market clearly did something meaningful.
Best use:
- Marking potential reaction zones.
- Combining with your price action tools (structure, OBs, FVGs) to confirm whether an OI level aligns with a technical level.
- Building a “map” of where leverage likely entered or exited.
Modes available in the script:
- Off
- Bubbles
- Bubbles + Labels
- Labels Only
- Levels + Labels
────────────────────────────────────────────────────────────
Aggregated Open Interest source (multi-exchange)
This indicator builds a single aggregated OI series by requesting OI data from multiple exchanges and summing it. You can toggle exchanges on/off:
- Binance, Bybit, OKX, Bitget, Kraken, HTX, Deribit
You can also choose OI units:
- COIN , OI in base units (native sizing)
- USD , converted for a dollar-value representation
Important note:
Not every symbol has OI data on every venue. If the script cannot build an aggregated series for the symbol, it will throw an error rather than quietly plotting garbage.
────────────────────────────────────────────────────────────
OI Source, what the bubbles are measuring
You control what “signal” is normalized and plotted:
- Delta , change in aggregated OI from the prior bar.
Use when you want to highlight bursts of new positioning or sudden unwind events.
- Raw OI , the aggregated open interest level itself.
Use when you want to highlight absolute positioning build-up periods.
- Delta % , percent change in OI.
Use when you want moves normalized to the current OI regime, useful across different market eras.
- Raw OI % , percent change form of the raw series.
Use when you want relative changes rather than absolute size.
Practical guidance:
- Delta modes are best for “event detection”.
- Raw modes are better for “regime context” and whether positioning is structurally rising or fading.
────────────────────────────────────────────────────────────
Normalization (the key to making it readable)
Because OI varies massively across assets and time, the script includes multiple normalization modes to convert your chosen OI source into a comparable “strength” value.
Options:
- ZScore , deviation from a rolling mean in standard deviation units.
- StdNorm , scaled by rolling standard deviation.
- AbsZScore , absolute value version for magnitude-only mapping.
- AbsStdNorm , absolute value version for magnitude-only mapping.
- None , plots raw values (advanced users only, often too noisy visually).
Why this matters:
Normalization makes a “1.5” or “3.0” threshold mean something across different assets and timeframes, instead of being stuck to raw OI units.
────────────────────────────────────────────────────────────
Threshold system (when bubbles/levels trigger)
The plot is driven by two user thresholds:
- Base Threshold
Controls where “meaningful” events start. Raising this reduces noise and focuses on larger deviations.
- Extreme Threshold
Controls what qualifies as a top-tier event. Extreme events are what you typically want to convert into labels and levels.
You also control side filtering:
- Both , show positive and negative events.
- Positive Only , show only increases (or positive signal side depending on source).
- Negative Only , show only decreases (or negative signal side).
In practice:
- Use Base Threshold to tune chart cleanliness.
- Use Extreme Threshold to mark only the “big stuff” that tends to matter later.
────────────────────────────────────────────────────────────
Anchor Source (where the bubble/level is placed)
The indicator places bubbles, labels, and levels at a price anchor you choose:
- HL2, Close, Open, High, Low, VWAP
This is important because “where you pin the event” changes how it reads:
- Close is clean and consistent for backtesting and candle-close logic.
- High/Low can better represent where the fight occurred intrabar.
- VWAP can be useful for “fair price” anchoring in active markets.
────────────────────────────────────────────────────────────
Style system (theme, palette, signed logic)
This script is built to look good and stay readable on busy charts.
Themes
- BackQuant, Classic, Ice, Fire, Mono, Custom
Palette Mode
- Solid , one consistent color
- Heatmap , intensity increases with magnitude
- Single Color Adaptive , adapts to chart background for clarity
Side Coloring
- Signed , positive and negative events can use different ramps
- Unsigned , magnitude-only coloring
Negative theme handling:
- Auto (mirrors your chosen theme),
- Invert (flips the ramp),
- Custom (fully user-defined negative palette).
What this gives you:
- You can run a clean “mono” look for professional charts.
- Or a high-contrast heatmap for fast scanning.
- Or fully custom branding colors for BackQuant-style presentation.
────────────────────────────────────────────────────────────
Labels (what’s inside the label)
When labels are enabled, the script can display:
- OI , the aggregated OI value
- OI + Norm , OI plus normalized strength
- Norm Only , just the normalized strength
- Src + Norm , the selected source value (Delta, Raw, %) plus normalized strength
You can also control:
- Left/Center/Right label alignment
- Number formatting style (Raw, Compact, Volume format)
Best practice:
- Use “Src + Norm” when you want both the raw event size and its rarity.
- Use “Norm Only” when you want a clean, minimal chart.
────────────────────────────────────────────────────────────
Levels and object limits (performance and cleanliness)
Because this script draws objects, it includes a hard cleanup system:
- You set Max Levels / Labels to control chart clutter.
- The script deletes older lines/labels when the limit is exceeded.
This is critical if you trade lower timeframes, where OI events can trigger frequently.
────────────────────────────────────────────────────────────
How to interpret the signals
What a large bubble usually means:
- A statistically large positioning change relative to recent history.
- This can represent fresh leverage entering, forced liquidations, or aggressive de-risking, depending on direction and context.
How to use levels:
- Treat them as “attention levels”, not automatic entries.
- Combine them with structure and liquidity tools:
- If price revisits an OI level and shows rejection, it often confirms that level mattered.
- If price slices through with no reaction, it often indicates the OI event was transitional, not defended.
Common setups:
- Clustered extreme bubbles near a breakout zone, then retest later.
- Extreme negative event at capitulation low, followed by structure flip.
- Extreme positive build into resistance, then unwind and mean reversion.
Also, please check out @NoveltyTrade for the OI Aggregation logic & pulling the data source!
Here is the original script:

AI Chakra for Global Markets by Pooja🔮 AI Chakra for Global Markets — by Pooja
Invite-Only | Rule-Based Market Structure & Momentum Indicator
🔹 What this indicator actually does
AI Chakra is a rule-based indicator that generates Auto Buy / Auto Sell signals
only when predefined rules across trend, momentum, volatility and structure are satisfied together.
It is not a simple RSI, EMA or SMC indicator, and it is not a visual mash-up.
Each component has a fixed role, and no signal is allowed unless all required rules pass.
🟢 AUTO BUY / 🔴 AUTO SELL — How signals are generated
BUY signal is allowed ONLY when ALL rules below are true on candle close:
Trend Rule
Price above EMA trend structure
EMA alignment confirms bullish bias
Fair-Price Rule
Price above VWAP (no buy below VWAP)
Momentum Rule
RSI above its moving average
RSI–RSI-MA distance above minimum threshold
RSI-MA slope positive (flat momentum blocked)
Volatility Rule
ADX confirms market strength
ATR confirms sufficient price movement
Low-energy / sideways markets are ignored
Structure Rule
Market structure is valid (BOS or active CHoCH context)
No buy allowed against recent structure shift
Candle Confirmation Rule
Signal triggers only after candle close
No intrabar or repaint signals
If any single rule fails → NO BUY SIGNAL.
SELL signal follows the same rules in the opposite direction.
🧠 What “AI” means here (no hype, no prediction)
“AI” in this indicator does NOT mean machine learning or prediction.
It refers to:
Multi-rule decision logic
State-based signal control
Conditional signal rejection
Context-aware validation instead of single-condition triggers
👉 The indicator decides whether a signal is allowed or rejected, similar to a rule engine.
📉 Fake Breakout Protection (Core Purpose)
This indicator is specifically designed to avoid fake breakouts.
Fake signals are blocked using:
RSI distance + slope filter
ADX strength validation
ATR volatility requirement
VWAP position filter
Structure (BOS / CHoCH) alignment
Low-volume, sideways and weak momentum moves are intentionally ignored.
🧱 Market Structure (SMC) — How it is used
Break of Structure (BOS)
Detected using swing highs / lows
Confirms continuation of current trend
Used as structure validation, not as a trade trigger
Change of Character (CHoCH)
Detected when price breaks previous structure
Marks possible trend shift
Remains valid only for limited bars
⚠️ BOS / CHoCH do not generate trades alone.
They only allow or block signals from the main engine.
🔁 Partial Signals — Why they exist
Instead of only final Buy/Sell, the indicator shows Partial Signals:
CHoCH + RSI
EMA + VWAP + RSI
EMA + VWAP + Supertrend + RSI
Breakout structure (RSI intentionally excluded)
Partial signals:
Do not mean trade entry
Show which rules are already satisfied
Help traders track setup development
📍 Support & Resistance (Context Only)
Traditional Pivot Points
Multi-timeframe calculation (Daily / Weekly / Monthly)
Optional price labels
Pivot levels:
Never generate signals
Used only as support / resistance reference
📐 Trendline Module (Optional)
Trendlines drawn from swing points
ATR / Std-Dev / Regression-based slope
Extended forward for interaction zones
Trendlines are contextual, not breakout triggers.
⚙️ Trading Modes (Different rule handling)
Intraday Mode
Direction resets daily
Prevents repeated same-side signals in one session
Positional Mode
Direction stays active until opposite structure appears
No daily reset
Logic is different internally — not cosmetic.
🔔 Alerts
Auto Buy / Auto Sell alerts
Partial alerts available
Candle-close only
Non-repainting
Webhook compatible
🔒 Why Invite-Only
The script uses:
Stateful signal logic
Multi-rule validation
Structure-based filters
Partial-to-confirmed signal flow
Source is restricted to protect these mechanisms.
⚠️ Disclaimer
This indicator is for educational and analytical use only.
It does not provide financial advice or trade recommendations.
Risk management is the user’s responsibility.

Power Bar SMA Directional (Trade Your Edge)GENERAL OVERVIEW:
The Power Bar SMA Directional (Trade Your Edge) indicator identifies high-momentum Power Bars and uses a structured SMA-based breakout model to generate Long and Short trading signals. Once a signal appears, the indicator automatically places a Stop-Loss and three Take-Profit levels, with an optional dynamic trailing stop-loss. Alerts are available for every trade event.
This indicator was developed by Flux Charts in collaboration with Steven Adams (Trade Your Edge).
What is the purpose of the indicator?:
The purpose of the Power Bar SMA Indicator is to turn an unusually strong candle (Power Bar) into a complete, rule-based trade setup. The indicator does three main things, very specifically:
It spots “power bars”. These are candles where the body is both large compared to the candle’s own range and large compared to nearby candles.
It only cares about power bars when they align with the trend’s direction: bullish or bearish.
When that happens, the indicator gives a buy or sell signal with an entry at the signal candle, a stop-loss at the low/high of the power bar, and three take-profit targets placed at fixed multiples of the entry to stop-loss distance. You can also have the stop move up/down after each target is hit with the trailing stop-loss feature.
What’s the theory behind the indicator?:
The theory behind this indicator is that large, one-sided candles often mark the start of directional strength. When a candle’s body takes up most of its total range and exceeds the average size of recent candlesticks, it shows clear control from either buyers or sellers. The indicator combines this concept with a simple moving average to confirm trend direction, ensuring signals only align with the current bias. It then checks if price breaks a recent swing high or low to confirm momentum is continuing rather than consolidating inside a range. By combining three core elements: trend bias, momentum identification, and confirmation that price has room for new discovery beyond prior ranges, the indicator can focus on finding trade setups that have multiple market factors in alignment.
POWER BAR SMA DIRECTIONAL FEATURES:
The Power Bar SMA Directional indicator includes 4 main features:
Power Bars
Trend Bias
Long / Short Signals + Risk Management
Alerts
POWER BARS:
🔹What are Power Bars?:
Power Bars are large, high-momentum candles that show strength in one direction of the market. They form when a candle’s body (the distance between open and close) dominates most of the candle’s total range (the distance between high and low), meaning price moved strongly in one direction with little to no pullback. To qualify, the candle must also be large relative to nearby candles. This size difference confirms that the candle is a burst of momentum.
🔹How to interpret and use Power Bars:
When a Power Bar forms, it signals that price has just made a strong directional move with little to no pullback. Traders can use these bars to identify momentum shifts and potential trade setups.
A bullish Power Bar means buyers controlled the entire candle, marking the start of upward momentum. A bearish Power Bar means sellers were in control of the entire candle, signaling the start of downwards momentum. In the Power Bar SMA Directional indicator, these candles are only used for signals when they align with the market trend and satisfy other entry requirements, mentioned later on.
Bullish Power Bars forming above the Simple Moving Average (SMA) can signal potential long opportunities.
Bullish Power Bars forming below the SMA can signal potential short opportunities.
🔹How are Power Bars identified:
Power Bars are detected and confirmed only after the candle closes, ensuring that the full candlestick body and range can be measured. The indicator does not repaint or change past bars. Once a Power Bar is confirmed, it stays fixed on the chart. Power Bars can be detected on any timeframe or symbol that produces standard candlestick data.
The indicator identifies Power Bars using two user-defined inputs: Sensitivity and Body %.
◇ Sensitivity:
The Sensitivity setting determines how large a candle’s body must be relative to nearby candles. It uses the Average True Range (ATR) to compare the current candle’s size with recent candles, and the Sensitivity value acts as a multiplier of that ATR. A higher Sensitivity value means the candle must be much larger than recent candles to qualify, so fewer Power Bars will form. A lower value makes the filter less strict, allowing more candles to qualify.
◇ Body %:
The Body % setting controls what percentage of the candle’s total range must be body rather than Wick. A higher value requires the body to take up more of the candle’s total range, so fewer candles pass the filter. A lower value allows candles with more wick to qualify, so more Power Bars will form.
Body % Example:
If Body % is set to 50, the candle body must cover at least half of the candle’s total range. For example, if a candle’s high is $11, its low is $10, its open is $10.20, and its close is $10.80, then the total range is $1 ($11 - $10) and the body is $0.60 ($10.80 - $10.20). Body % = (Body / Total Range) * 100 = (0.60 ÷ 1.00 × 100) = 60%. Since 60% is greater than the input of 50%, this candle passes the Body % criteria.
Once a candlestick closes and it meets both the Sensitivity and Body % requirements, it will be plotted in a different color, using barcolor() function. Users can adjust the bullish/bearish colors of Power Bars by adjusting the ‘Candle Coloring’ setting. The Power Bar candle coloring is purely visual and does not affect signal logic or strategy calculations.
TREND BIAS:
The indicator uses a Simple Moving Average (SMA) to determine overall trend direction and ensure that long/short signals align with the market bias.
When the SMA is sloping upward and price is trading above it, the market is considered to be in a bullish trend. In this case, only long setups are allowed. When the SMA is sloping downward and price is below it, the market is considered bearish, and only short setups are valid. This filtering ensures that every signal follows the current trend rather than fighting it.
Within the settings, the SMA length can be customized to match different trading styles. A shorter SMA period reacts more quickly to price changes, making it better suited for scalping or lower timeframes where traders want faster entries and exits. A longer SMA period responds more slowly, which smooths out smaller fluctuations and is more useful for day traders or swing traders who focus on larger trends. By default, the SMA length is set to 20.
Signals on SEED_ALEXDRAYM_SHORTINTEREST2:NQ 5-minute timeframe with a 10 SMA vs. 100 SMA:
🔹Why does the indicator include a trend filter?:
This indicator is built around the assumption that markets tend to continue moving in their current direction. Thus, if the trend is bullish, it’s assumed that price will continue moving higher. If the trend is bearish, it’s assumed that price will continue moving lower. By combining the SMA filter with the momentum logic of the power bars, the indicator avoids countertrend setups. This keeps signals focused on continuation setups where both the trend and short-term strength (momentum) are in agreement.
LONG/SHORT SIGNALS:
This indicator identifies potential trade setups by combining momentum, trend alignment, and structural confirmation. It detects when a Power Bar candle appears, and then looks for confirmation that the move is valid through trend alignment and a structure break.
There are three long setups and three short setups:
Momentum Breakout
Proximity Breakout
Delayed Breakout
All setups require:
A valid Power Bar forming in the correct context relative to the SMA.
A break of nearby structure (defined by the Swing Length setting).
🔹Signal Settings:
◇ SMA Distance:
This setting defines how close a Power Bar must be to the SMA to qualify for the proximity breakout setup type. It measures the maximum allowed distance between the Power Bar’s open price and the SMA, expressed as a multiple of the Average True Range (ATR).
This setting only affects Setup #2 (Proximity Breakout) and sometimes Setup #3 (Delayed Breakout). Setup #1 does not use this filter because its logic depends on price crossing the SMA or confirming later. In proximity setups, the power bar candle must both open and close on the same side of the SMA (bullish or bearish) while still being within the allowed SMA Distance range. This condition prevents signals when price is stretched too far away from the SMA, which could indicate exhaustion or a potential pullback rather than continuation.
A lower SMA Distance value tightens this filter, allowing only Power Bars that form very close to the SMA, resulting in fewer but more conservative signals. A higher SMA Distance value gives wiggle room and allows setups that form farther from the SMA, generating more frequent signals.
In the example below, when the SMA Distance is set to 0.5 (left chart), the bullish Power Bar does not trigger a long signal because its opening price is too far from the SMA. When the SMA Distance is increased to 1.0 (right chart), the same candle now falls within the allowed range, making the setup valid and displaying a long signal label.
◇ Swing Length:
The Swing Length setting defines how the indicator identifies recent structure levels used for breakout confirmation. These structure levels are swing highs and swing lows, which represent points where price reversed direction over a specified number of bars. The indicator uses these high/low levels to determine whether price has broken past a meaningful area of prior support or resistance before confirming a trade setup.
The Swing Length value determines how far back the indicator looks when calculating these points. Internally, it uses the Highest/Lowest method, scanning the last N bars (where N is the Swing Length input) to find the highest high and lowest low within that range.
The highest high becomes the immediate resistance level for potential long setups.
The lowest low becomes the immediate support level for potential short setups.
A lower Swing Length value makes the indicator reference closer levels. This increases the number of potential signals because nearby highs and lows are easier for price to reach.
A higher Swing Length value references farther structure levels, typically major swing points, which reduces signal frequency.
Every setup requires a structure break for confirmation. The Swing Length setting directly affects how strict or lenient the entire indicator behaves for each setup type.
In Setup #1 (Baseline Momentum Breakout) and Setup #2 (Trend-Aligned Proximity Breakout), the Power Bar must break the structure level during or immediately after its formation.
In Setup #3 (Delayed Breakout Confirmation), the same Swing Length level is referenced for a limited number of candles defined by the Candles Between Confirmation setting.
◇ Candles Between Confirmation:
The Candles Between Confirmation setting defines how long the indicator will wait for price to confirm a breakout after a qualifying Power Bar forms. It represents the maximum number of bars allowed between the Power Bar’s close and the moment when price breaks the nearby structure level, which is derived from the Swing Length setting. The structure level is defined as the most recent swing high (for long setups) or swing low (for short setups).
If a structure break occurs within the specified window, a valid signal is triggered, and the Long or Short label is plotted at the close of the breakout candle. If price fails to break through the level within a certain number of candles, the setup is invalidated. This ensures that signals only appear when momentum follows through promptly, and not when price stalls or consolidates for an extended period.
Lower values make confirmations stricter, capturing only quick momentum breakouts. Higher values allow more time for slower markets or higher timeframes to complete structure breaks. Adjust this setting based on market volatility and trading style.
In the example below, when Candles Between Confirmation is set to 10, no signal appears because price breaks the swing high after 15 bars, which is greater than the allowed limit. When the setting is increased to 15, the same move qualifies, and a long signal is triggered as price breaks the swing high 15 candles after the initial bullish Power Bar that crossed the SMA.
🔹Long Setups:
Long Setup #1: Momentum Breakout
A bullish Power Bar opens below the SMA, and closes above it, showing buyer strength.
A breakout must occur during this bullish Power Bar candle through a nearby resistance level derived from the Swing Length setting.
When this breakout occurs, a Long Signal appears at bar close.
After a signal appears, three take-profit levels and one stop-loss level are also plotted.
Stop-Loss: Placed at the Power Bar’s low.
Take-Profit 1: Set using a 1:1 risk distance from the Stop-Loss to entry.
Take-Profit 2: Extends to 1:1.5 risk-to-reward.
Take-Profit 3: Extends to 1:2 risk-to-reward.
(Power Bars are white in this image)
Long Setup #2: Proximity Breakout
A bullish Power Bar opens and closes above the SMA, but is still close enough to it to show price hasn’t extended too far. (Refer to SMA Distance setting). As long as the opening of that candle is within the SMA Distance threshold, the setup remains valid.
The bullish Power Bar candle must break through the recent swing high (refer to Swing Length setting).
A Long Signal triggers when that breakout is confirmed.
After a signal appears, three take-profit levels and one stop-loss level are also plotted, similar to Long Setup #1.
(Power Bars are white in this image)
Long Setup #3: Delayed Breakout
A bullish Power Bar appears in a valid location (Refer to Long Setup #1 or Long Setup #2), but structure is not broken immediately.
The indicator waits for confirmation within the maximum Candles Between Confirmation window. If price breaks structure within that time, a Long Signal appears. If price fails to break structure in time, the setup is discarded.
Risk Management:
Same Stop-Loss, TP 1, TP 2, and TP 3 logic as Long Setup #1
(Power Bars are white in this image)
🔹Short Setups:
Short Setup #1: Momentum Breakout
A bearish Power Bar opens above the SMA, and closes below it, showing seller strength.
A breakout must occur during this bearish Power Bar candle through a nearby support level derived from the Swing Length setting.
When this breakout occurs, a Short Signal appears at bar close.
After a signal appears, three take-profit levels and one stop-loss level are also plotted.
Stop-Loss: Placed at the Power Bar’s high.
Take-Profit 1: Set using a 1:1 risk distance from the Stop-Loss to entry.
Take-Profit 2: Extends to 1:1.5 risk-to-reward.
Take-Profit 3: Extends to 1:2 risk-to-reward.
(Power Bars are white in this image)
Short Setup #2: Proximity Breakout
A bearish Power Bar opens and closes below the SMA, but is still close enough to it to show price hasn’t extended too far. (Refer to SMA Distance setting). As long as the opening of that candle is within the SMA Distance threshold, the setup remains valid.
The bearish Power Bar candle must break through the recent swing low (refer to Swing Length setting).
A Short Signal triggers when that breakout is confirmed.
After a signal appears, three take-profit levels and one stop-loss level are also plotted, similar to Short Setup #1.
(Power Bars are white in this image)
Short Setup #3: Delayed Breakout
A bearish Power Bar appears in a valid location (Refer to Short Setup #1 or Short Setup #2), but structure is not broken immediately.
The indicator waits for confirmation within the maximum Candles Between Confirmation window. If price breaks structure within that time, a Short Signal appears. If price fails to break structure in time, the setup is discarded.
Risk Management:
Same Stop-Loss, TP 1, TP 2, and TP 3 logic as Long Setup #1
(Power Bars are white in this image)
🔹Trailing Stop-Loss Feature:
When the Trailing Stop-Loss setting is enabled, the Stop-Loss (SL) automatically adjusts as price reaches take-profit levels. This feature helps secure profits while keeping the trade logic completely rule-based and non-discretionary.
Here’s exactly how it works step-by-step:
Initial Stop-Loss placement:
For a Long trade, the initial SL is set at the low of the bullish Power Bar that triggered the setup.
For a Short trade, the initial SL is set at the high of the bearish Power Bar that triggered the setup.
This level stays fixed until one of the Take-Profit targets is reached.
After TP 1 is hit:
The SL automatically moves to the entry price (breakeven).
After TP2 is hit:
The SL automatically moves to TP 1
Final exit condition:
The trade is considered complete once either the trailing Stop-Loss or TP 3 is reached.
🔹Visualization:
Users can enable or disable:
Long Signals
Short Signals
Take-Profit Lines
Take-Profit Labels
Stop-Loss Lines
Stop-Loss Labels
Signal Line
SMA
◇ Signal Line:
The Signal Line is an optional visual feature that helps users see exactly which structure level the indicator is using to confirm a breakout. It does not change how signals are generated. It only displays the reference point on the chart.
Users can customize the Signal Line style (Dashed, Dotted, Solid) and choose different colors for bullish and bearish signal lines. The Signal Line can also be turned off completely. When disabled, signals will not be affected.
ALERTS:
The indicator supports alerts, so you never miss a key market move. You can choose to receive alerts for each of the following conditions:
Long Signal
Short Signal
TP 1 (Take-Profit 1)
TP 2 (Take-Profit 2)
TP 3 (Take-Profit 3)
SL (Stop-Loss)
UNIQUENESS:
This indicator automates a strategy that is normally managed manually using multiple steps: identifying large momentum candles, validating trend direction, confirming breakout strength through structure, and then projecting clean risk-based targets. The SMA Distance filter, confirmation window, and swing structure rules work together to ensure signals only trigger when momentum (Power Bars) aligns with technical levels. This indicator turns Power Bars into complete trade ideas with real-time SL/TP management and alerts.

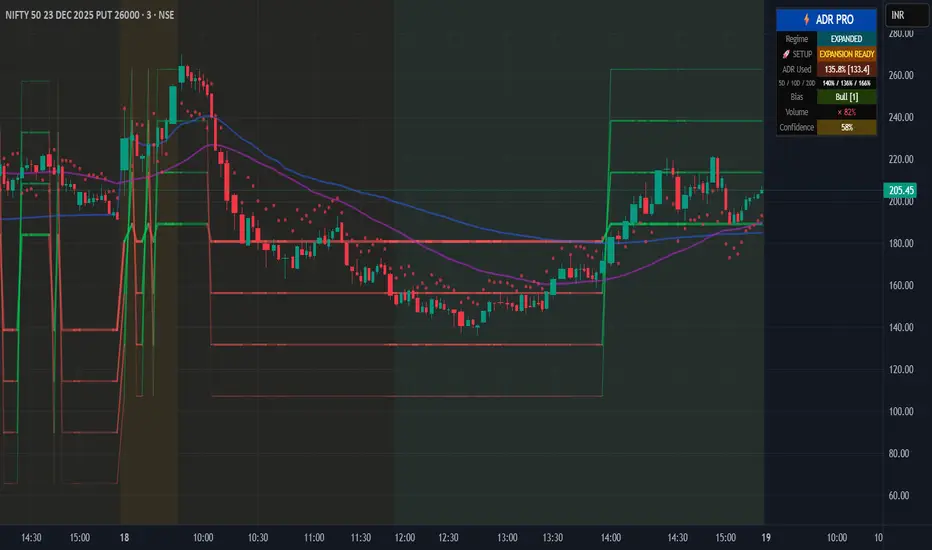
Institutional ADR Regime System [Pro]# 📊 Institutional ADR Regime System - Advanced Average Daily Range Analysis
## 🎯 Overview
The **Institutional ADR Regime System** is a comprehensive volatility and regime analysis tool designed for professional traders who use Average Daily Range (ADR) as a cornerstone of their intraday strategy. This indicator goes far beyond simple ADR calculation by integrating **multi-timeframe analysis**, **directional bias detection**, **volume confirmation**, **regime classification**, and **probability-based target projections**.
Built specifically for **Nifty, Bank Nifty, Stock Futures, Forex, and Crypto** traders, this system helps you identify high-probability setups based on volatility regimes and ADR expansion/compression cycles.
***
## 🚀 Key Features
### 📈 **Multi-Timeframe ADR Engine**
- **Three ADR Lookbacks**: Fast (5-period), Medium (10-period), Slow (20-period) for complete volatility context
- **Real-time Session Tracking**: Live calculation of current day's range vs ADR percentages
- **Multiple Calculation Methods**: True Range (gap-adjusted), High-Low (intraday), Close-to-Close
- **Configurable Base Timeframes**: Daily or Weekly ADR projections
### 🧠 **Intelligent Regime Classification**
- **4 Market Regimes**: Compressed (<65% ADR), Normal (65-120%), Expanded (120-150%), Exhausted (>150%)
- **Compression Cluster Detection**: Identifies "coiled spring" setups when market compresses for multiple consecutive days
- **Visual Regime Indicators**: Background color-coding for instant regime recognition
- **Automated Expansion Alerts**: Get notified when compression clusters are ready to break
### 🎯 **Dynamic Target Projection System**
- **4 Probabilistic Targets**: 50% / 75% / 100% / 125% ADR levels
- **Historical Hit-Rate Tracking**: See success rates for each target level over last N sessions
- **Confidence Scoring (0-100%)**: Multi-factor scoring based on regime, trend, volume, and statistics
- **Adaptive Transparency**: Target lines fade when confidence is low, highlight when high
### 📊 **Directional Context Engine**
- **Trend Filter**: Higher timeframe EMA alignment (auto-detects bullish/bearish bias)
- **VWAP Integration**: Monitors price position relative to VWAP for institutional bias
- **Multi-TF Trend Confirmation**: Optional higher timeframe trend filter (Weekly/Monthly)
- **Bias Scoring System**: -3 to +3 score combining trend, VWAP, and HTF alignment
- **Auto/Manual Mode**: Let the system decide bull/bear targets or override manually
### 📈 **Volume Confirmation Layer**
- **Volume MA Threshold**: Requires volume confirmation above customizable threshold (default 1.2×)
- **Real-time Volume Status**: Displays current volume as % of moving average
- **Volume-Gated Alerts**: Smart alerts only fire when volume confirms the move
### ⚖️ **Risk Management Module**
- **ATR-Based Stop Suggestions**: Auto-calculates suggested stop loss based on ATR multiplier
- **R:R Calculator**: Shows risk-reward ratios for each target level
- **Position Sizing Hints**: Helps determine appropriate lot size based on account risk %
- **Dynamic Stop Visualization**: Plots suggested stop level on chart
### 📊 **Professional Statistics Dashboard**
- **Real-Time ADR Usage Meter**: Shows % of ADR consumed (color-coded risk zones)
- **Multi-Period Comparison**: Current range vs 5D / 10D / 20D ADR
- **Historical Hit-Rates**: Target success rates tracked over configurable lookback
- **Playbook Hints**: Context-aware trading suggestions (Breakout Play, Fade Zone, Trend Day, etc.)
- **Compact/Full/Minimal Modes**: Choose your preferred panel size
- **Mobile-Optimized**: Readable on all screen sizes
### 🔔 **Smart Alert System**
- **Target 1 Approach**: Fires when price approaches T1 with high confidence + volume
- **Exhaustion Zone**: Alerts when ADR >150% used (fade opportunity)
- **Coiled Spring**: Triggers on compression cluster completion (expansion setup)
- **High-Probability Confirmation**: Multi-factor confirmation alerts (trend + volume + T1 break)
***
## 💡 Use Cases & Trading Applications
### ✅ **Intraday Range Traders**
- Identify compressed days for range-bound strategies
- Avoid overextended days with exhaustion warnings
- Scale into positions at probabilistic support/resistance levels
### ✅ **Breakout & Momentum Traders**
- Detect "coiled spring" compression clusters before expansion
- Enter on confirmed ADR breakouts with volume
- Use confidence scoring to filter low-probability setups
### ✅ **Mean Reversion & Fade Specialists**
- Identify exhaustion zones (>150% ADR) for counter-trend entries
- Fade extremes when price reaches 125% target with weak volume
- Use HTF resistance/support confluence with ADR targets
### ✅ **Position Traders (Swing)**
- Weekly ADR projections for multi-day targets
- Trend + ADR alignment for high-conviction entries
- R:R-based position sizing at each target level
### ✅ **Options Traders**
- Volatility regime classification for straddle/strangle timing
- Compression clusters = pre-expansion option buying opportunity
- Exhaustion zones = premium selling setups
***
## 🔧 Configuration Guide
### **Core Settings**
- **Market Type**: Equity / Futures / Forex / Crypto (affects session detection)
- **Base Timeframe**: Daily or Weekly ADR calculation
- **Target Direction**: Auto (trend-based) / Bull / Bear (manual override)
### **ADR Parameters**
- **Fast/Med/Slow Periods**: Customize ADR lookbacks (default: 5/10/20)
- **Calculation Method**: True Range (recommended) / High-Low / Close-to-Close
- **Regime Thresholds**: Adjust compression/expansion levels to your instrument
### **Session Settings** (Critical for Intraday)
- **Enable Session Filter**: Only calculate ADR during RTH (Regular Trading Hours)
- **Session Hours**: Set your market's trading hours (e.g., 09:15-15:30 IST for Nifty)
- **Timezone**: Select your market's timezone
### **Filters & Confirmations**
- **Trend EMA Length**: Adjust trend filter sensitivity (default: 50)
- **Volume Threshold**: Set volume confirmation multiplier (default: 1.2×)
- **Higher TF Trend**: Enable weekly/monthly trend filter
### **Risk Management**
- **Stop ATR Multiplier**: Default stop distance (default: 1.5× ATR)
- **Account Risk %**: For position sizing calculations
### **Statistics**
- **Statistical Lookback**: Hit-rate calculation period (default: 50 sessions)
- **Enable Stats**: Toggle historical probability tracking
***
## 📖 Interpretation Guide
### **Regime Colors** (Background)
- 🟠 **Orange**: Compressed (<65% ADR) - Range-bound day likely
- 🔵 **Aqua**: Expanded (120-150%) - Strong trending day
- 🔴 **Red**: Exhausted (>150%) - Overextended, fade zone
- ⚪ **Neutral**: Normal (65-120%) - Standard volatility
### **Target Line Transparency**
- **Bold/Solid**: High confidence (>70%) - Strong probability
- **Medium**: Moderate confidence (50-70%)
- **Faded**: Low confidence (<50%) - Caution advised
### **Bias Score**
- **+2 to +3**: Strong bullish alignment (trend + VWAP + HTF)
- **+1**: Weak bullish bias
- **0**: Neutral
- **-1**: Weak bearish bias
- **-2 to -3**: Strong bearish alignment
### **Playbook Hints**
- ⚡ **"BREAKOUT PLAY"**: Coiled spring detected, expansion imminent
- ⚠️ **"FADE ZONE"**: Exhausted + volume = reversal opportunity
- 📈 **"TREND DAY"**: Expanded regime + directional bias = follow trend
- 💤 **"RANGE TRADE"**: Compressed regime = buy support, sell resistance
- ➡️ **"NORMAL DAY"**: Standard conditions, no special setup
***
## 🎓 Trading Strategy Examples
### **Strategy 1: Compression Breakout**
1. Wait for 3+ consecutive compressed days (<65% ADR)
2. Monitor for "🚀 EXPANSION READY" alert
3. Enter on first 50% target break with volume confirmation
4. Target: 100-125% levels | Stop: Suggested ATR stop
### **Strategy 2: Exhaustion Fade**
1. Price reaches 125-150% ADR target
2. Volume confirmation present but regime shows "EXHAUSTED"
3. Enter counter-trend at target level
4. Target: Mean reversion to 75% level | Stop: 1.5× ATR beyond entry
### **Strategy 3: Trend Following**
1. Bias score ≥ +2 (or ≤ -2 for bearish)
2. Price in expanded regime (120-150%)
3. Enter on pullbacks to 50-75% levels
4. Target: Next sequential target | Stop: VWAP or EMA
***
## ⚙️ Technical Specifications
- **Pine Script Version**: v6
- **Chart Type**: Overlay indicator
- **Max Labels/Lines**: 500 each (optimized for performance)
- **Calculation Frequency**: Real-time (tick-by-tick)
- **Memory Usage**: Efficient array management for long-term statistics
- **Repaint Behavior**: No repainting - uses confirmed HTF data only
***
## 🔔 Alert Setup Guide
1. **Add Indicator** to chart
2. Click **"Create Alert"** (TradingView alert icon)
3. **Condition**: Select desired alert from dropdown:
- 🎯 T1 Approach
- ⚠️ Exhaustion Zone
- 🚀 Coiled Spring Active
- ✅ High-Probability Setup
4. **Configure frequency**: Once Per Bar Close (recommended)
5. **Enable notifications** (Email, SMS, Webhook)
***
## 📱 Best Practices
### ✅ **DO:**
- Combine with support/resistance zones for confluence
- Wait for volume confirmation on target breaks
- Use confidence score to filter low-probability setups
- Adjust session hours for your specific market
- Track hit-rates over time to calibrate thresholds
### ❌ **DON'T:**
- Trade against strong directional bias (score ≤ -2 or ≥ +2)
- Ignore regime classification (don't fade in expansion, don't breakout in compression)
- Chase targets in exhaustion zone without mean reversion plan
- Trade without volume confirmation in low-liquidity sessions
- Override auto bias without clear technical reason
***
## 🎯 Ideal For
✅ **Day Traders** (Nifty, Bank Nifty, Stock Futures)
✅ **Scalpers** (using 5-min / 15-min charts)
✅ **Swing Traders** (Weekly ADR mode)
✅ **Options Traders** (volatility regime analysis)
✅ **Prop Traders** (institutional-grade risk management)
***
## 📜 Disclaimer
This indicator is a **decision-support tool** and does not constitute financial advice. Past performance of hit-rates does not guarantee future results. Always use proper risk management, position sizing, and stop losses. The creator is not responsible for any trading losses incurred using this tool. Test thoroughly on paper/demo accounts before live trading.
***
## 🔄 Updates & Support
**Current Version**: 1.0
**Last Updated**: December 2025
For questions, feedback, or feature requests, comment below or message directly.
***
## 🏆 Credits
Developed by a quantitative trader for institutional-grade ADR analysis. Inspired by PivotBoss ADR methodology and enhanced with modern regime detection, multi-factor confirmation, and probability-based targeting.
***
**Tags**: #ADR #AverageDailyRange #VolatilityIndicator #RegimeAnalysis #IntradayTrading #NiftyTrading #BankNifty #Options #BreakoutStrategy #MeanReversion
***
**🌟 If this indicator helps your trading, please leave a like and share with fellow traders!**
MTF CPR Boxes & Multiple Pivots - Nadeem Al-QahwiMTF CPR Boxes & Multiple Pivots is designed to make those structural zones easier to see by turning classic pivot math into clean, multi-timeframe visual regions directly on your chart.
⸻
The Concept: Central Pivot Range (CPR) Math
This tool is based on the well-known Central Pivot Range (CPR) methodology.
For each selected timeframe, the CPR is calculated from the previous period’s OHLC data:
• Central Pivot:
Pivot = (High + Low + Close) / 3
• Bottom Central:
BC = (High + Low) / 2
• Top Central:
TC = (Pivot - BC) + Pivot (equivalently TC = 2 * Pivot - BC)
This indicator computes these CPR levels for Daily, Weekly, and Monthly timeframes and overlays them on the current chart. The idea is to reveal how price is interacting with higher-timeframe value areas and potential support/resistance clusters in real time.
⸻
Visual Innovation:
• Instead of drawing only thin lines for TC, Pivot, and BC, the area between TC and BC is rendered as a box (zone).
• The central pivot is still drawn as a line inside the box for reference, but the main emphasis is on the entire value range, not a single price.
• This box-based representation helps traders visually identify:
• Liquidity clusters inside the CPR range
• Overlapping CPR zones across multiple timeframes (powerful confluence)
• Compression areas where price is likely to build up orders before expansion
⸻
Key Features
• Multi-Timeframe CPR (MTF Overlay)
• Daily CPR box
• Weekly CPR box
• Monthly CPR box
All three can be enabled simultaneously, allowing you to see where short-term and higher-timeframe value zones overlap.
• Institutional Color Theme
• Separate colors for Daily, Weekly, and Monthly CPR zones
• Designed to be visually distinct yet clean, so confluence is easy to spot without clutter.
• Multiple Pivot Types (Traditional + Camarilla)
• Traditional pivots (PP, S1–S5, R1–R5)
• Camarilla pivots (L1–L6, H1–H6)
These are drawn as classic lines with label/price options and can be used together with CPR boxes for a richer structural map.
• Dynamic Zone Levels (DZL) Engine
• Automatically detects pivot-based support and resistance zones from historical swings.
• Clusters nearby pivots into channels based on a configurable width and strength filter.
• Draws only the strongest zones to keep the chart readable and focused on meaningful levels.
⸻
Settings Guide (How to Customize)
The script includes a set of user-friendly controls so you can adapt the visuals to your style and chart theme:
• General Settings
• Pivot timeframe selection for the main (non-CPR) pivots.
• “Pivots Back” and “CPR Levels Back” to control how many historical periods are displayed (helpful for performance).
• CPR Visual Style (SMC Boxes)
• Box Transparency: Adjusts how opaque the CPR zones are (0 = solid, 100 = invisible fill).
• Border Style & Width: Choose between Solid, Dashed, Dotted, or hide borders completely.
• Text Options: Toggle CPR labels inside each box (e.g., “D-CPR”, “W-CPR”), set text color, size, and placement (center or corner positions).
• Pivots & Labels
• Enable/disable Traditional and Camarilla sets independently.
• Control which levels to display (e.g., show R1–R3 only).
• Choose whether to show level names, prices, or both.
• DZL Settings
• Pivot period for swing detection.
• Channel width (% of price range).
• Maximum number of zones and minimum strength (how many pivots must cluster to form a valid zone).
• Separate style controls for support vs. resistance colors.
⸻
Disclaimer
This indicator is provided for educational and analytical purposes only.
It does not constitute financial advice, investment advice, or a recommendation to buy or sell any security or instrument. Always perform your own analysis and use proper risk management. Trading involves risk, and you are solely responsible for your own decisions.

DX Supply and Demand Pro💎 DX Supply and Demand Pro: Adaptive Line and Zone Mastery
The DX Supply and Demand Pro indicator is an advanced, hybrid trading tool engineered for precision and context. It seamlessly integrates the proprietary Arbitor Line with dynamic, volume-weighted Supply and Demand Zones. This unique combination provides traders with a clear, adaptive view of both the current trend bias and critical structural price levels.
⚠️ Critical Trading Disclaimer 🛑
Trading is highly speculative and carries a substantial risk of loss. The use of this indicator does not guarantee profits, and you may lose more than your initial capital. Before using this tool in a live trading environment, you must test its performance thoroughly using paper trading or a simulated account.
Why Traders Need the DX S&D Pro 🎯
Proprietary Adaptive Intelligence: The Arbitor Line is a calculated price anchor derived from a complex, undisclosed combination of multiple market factors and proprietary equations. It automatically adjusts its sensitivity based on the chart's timeframe, effectively filtering out market noise to present an accurate, weighted average of the prevailing market bias.
Structural Clarity: It detects high-probability Supply and Demand Zones using pivot points, filtering them for strength based on volume, ATR (volatility), and High Volume Node (HVN) confirmation from a higher timeframe.
Actionable Confluence: The indicator combines dynamic trend bias (the Arbitor Line) with static structural levels (S&D Zones). This allows traders to identify high-conviction setups where the structural turning point is confirmed by the real-time bias of the Arbitor Line.
📚 How to Use DX Supply and Demand Pro
This indicator is best used as a confluence tool, where the Arbitor Line confirms the strength and direction of the setup identified by the Supply/Demand Zones.
Trading Confluence with the Arbitor Line:
Scenario: Buy Zone Rejection 🟢
Condition: Price touches a Demand Zone.
Confluence: The Arbitor Line is Above the zone.
Interpretation: Indicates a Bullish Bias is confirming the structural support. Focus on long entries.
Scenario: Sell Zone Rejection 🔴
Condition: Price touches a Supply Zone.
Confluence: The Arbitor Line is Below the zone.
Interpretation: Indicates a Bearish Bias is confirming the structural resistance. Focus on short entries.
Scenario: Momentum Break ⚡
Condition: Price Closes strongly beyond a zone.
Confluence: The Arbitor Line is Aligned with the Break.
Interpretation: Confirms market momentum and suggests the structural break is valid for directional continuation.
⚙️ Key Settings and Optimization Guide 🔧
Arbitor Line Settings (Trend Bias):
VWAP Weight: (Default: 0.33) — The weight applied to a key volume component within the proprietary Arbitor calculation.
Suggestion for High Volatility/Volume: Increase to 0.40 to emphasize volume's influence.
Suggestion for Clean Trends: Decrease to 0.25 to allow momentum components to dictate the line's position.
Supply & Demand Zone Settings (Structural Levels)
HVN Volume TF: (Default: D - Daily) — Crucial Context Setter. The higher timeframe used to look for High Volume Nodes (HVNs) to confirm zone strength.
For Scalping (1m-15m): Use 1H or 4H for validation.
For Day Trading (30m-1H): Use 4H or D. D is the recommended default.
For Swing Trading (4H-Daily): Use W (Weekly).
HVN Bonus %: (Default: 20) — The strength boost applied to a zone if it aligns with an HVN.
Max Supply/Demand Zones: (Default: 2) — Limits the number of active, displayed zones to keep the chart clean.
Retest Bonus %: (Default: 10) — Boosts a zone's strength score each time it is retested (up to max retests).
Time Decay Rate %: (Default: 1) — Reduces a zone's strength for every 10 bars it remains unbroken (stale zones weaken).
Flip Zone on Break: (Default: True) — Turns a broken Demand Zone into a Supply Zone (and vice versa), reflecting structural flip concepts.
💡 Suggestions for Power Users 🚀
Look for Flipped Zones: Pay attention to zones that have been broken and flipped (indicated by yellow text in the labels). Flipped zones that confirm the Arbitor direction often lead to high-momentum continuation moves.
Confirm HVN Strength: Always prioritize trading zones with a high strength score (e.g., 90% or higher), as this indicates maximum confluence of Volume, Volatility, and the HVN Bonus.
Adaptive Timeframes: Use the indicator on multiple timeframes to ensure the Arbitor bias aligns with your trade direction. If the Arbitor is bullish on both the 5-minute and the 1-hour chart, the conviction is exceptionally high.
Final Note: The DX S&D Pro combines the best of trend following with the best of structural trading. It's so good, we call it the Arbitor because it settles the arguments between buyers and sellers... until the next bar, of course! 😉
....................................................................................
💎 مؤشر DX Supply and Demand Pro: خط التكيّف وإتقان المناطق ✨
مؤشر DX Supply and Demand Pro هو أداة تداول هجينة ومتقدمة مصممة للدقة والسياق. إنه يدمج بسلاسة خط Arbitor الخاص بنا مع مناطق العرض والطلب الديناميكية المرجحة بالحجم. يوفر هذا المزيج الفريد للمتداولين رؤية واضحة ومتكيفة لكل من انحياز الاتجاه الحالي ومستويات الأسعار الهيكلية (Structural Price Levels) الحرجة.
⚠️ إخلاء مسؤولية حاسم بشأن التداول 🛑
التداول ينطوي على مخاطرة عالية للغاية ويحمل مخاطر خسارة كبيرة. استخدام هذا المؤشر لا يضمن الأرباح، وقد تخسر أكثر من رأس مالك الأولي. قبل استخدام هذه الأداة في بيئة تداول حقيقية، يجب عليك اختبار أدائها بشكل شامل باستخدام التداول الورقي (Paper Trading) أو حساب محاكاة.
لماذا يحتاج المتداولون إلى مؤشر DX S&D Pro 🎯
ذكاء تكيّفي خاص (Proprietary Adaptive Intelligence): خط Arbitor هو مرساة سعر محسوبة مشتقة من تركيبة معقدة وغير معلنة من عوامل سوق متعددة ومعادلات خاصة. يقوم بضبط حساسيته تلقائيًا بناءً على الإطار الزمني للرسم البياني، مما يزيل ضوضاء السوق بشكل فعال لتقديم متوسط مرجح ودقيق للانحياز السائد في السوق.
وضوح هيكلي (Structural Clarity): يكتشف مناطق العرض والطلب ذات الاحتمالية العالية باستخدام نقاط التحول (Pivot Points)، ويقوم بترشيحها وتحديد قوتها بناءً على الحجم، ATR (التقلب)، وتأكيد من عقدة الحجم العالية (HVN) من إطار زمني أعلى.
تضافر قابل للتطبيق (Actionable Confluence): يجمع المؤشر بين انحياز الاتجاه الديناميكي (خط Arbitor) ومستويات الهيكل الثابتة (مناطق العرض والطلب). يتيح ذلك للمتداولين تحديد إعدادات ذات قناعة عالية حيث يتم تأكيد نقطة التحول الهيكلية من خلال انحياز خط Arbitor في الوقت الفعلي.
📚 كيفية استخدام مؤشر DX Supply and Demand Pro
يُفضل استخدام هذا المؤشر كأداة تضافر، حيث يؤكد خط Arbitor قوة واتجاه الإعداد المحدد بواسطة مناطق العرض والطلب.
تضافر التداول مع خط Arbitor:
السيناريو: ارتداد منطقة الشراء 🟢
الحالة: يلامس السعر منطقة الطلب (Demand Zone).
التضافر: يقع خط Arbitor فوق المنطقة.
التفسير: يشير إلى أن انحياز صعودي (Bullish Bias) يؤكد الدعم الهيكلي. التركيز على صفقات الشراء (Long Entries).
السيناريو: ارتداد منطقة البيع 🔴
الحالة: يلامس السعر منطقة العرض (Supply Zone).
التضافر: يقع خط Arbitor أسفل المنطقة.
التفسير: يشير إلى أن انحياز هبوطي (Bearish Bias) يؤكد المقاومة الهيكلية. التركيز على صفقات البيع (Short Entries).
السيناريو: كسر الزخم ⚡
الحالة: يُغلق السعر بقوة خارج المنطقة.
التضافر: يتماشى خط Arbitor مع الكسر.
التفسير: يؤكد زخم السوق ويشير إلى أن الكسر الهيكلي صالح للاستمرار الاتجاهي.
⚙️ الإعدادات الرئيسية ودليل التحسين 🔧
إعدادات خط Arbitor (انحياز الاتجاه)
VWAP Weight (وزن VWAP): (افتراضي: 0.33) — الوزن المطبق على مكون حجم رئيسي ضمن حساب Arbitor الخاص بنا.
اقتراح للتقلب/الحجم العالي: زيادة إلى 0.40 للتأكيد على تأثير الحجم.
اقتراح للاتجاهات النظيفة: تقليل إلى 0.25 للسماح لمكونات الزخم بتحديد موقع الخط بشكل أقوى.
إعدادات مناطق العرض والطلب (المستويات الهيكلية)
HVN Volume TF (الإطار الزمني لحجم HVN): (افتراضي: D - يومي) — مُحدِد السياق الحاسم. الإطار الزمني الأعلى المستخدم للبحث عن عقد الحجم العالية (HVNs) لتأكيد قوة المنطقة.
للمضاربة اللحظية (1د-15د): استخدم 1س أو 4س للتحقق.
للتداول اليومي (30د-1س): استخدم 4س أو D. D هو الإعداد الافتراضي الموصى به.
للتداول المتأرجح (4س-يومي): استخدم W (أسبوعي).
HVN Bonus % (مكافأة HVN %): (افتراضي: 20) — تعزيز القوة المطبق على المنطقة إذا كانت تتماشى مع عقدة HVN.
Max Supply/Demand Zones (الحد الأقصى لمناطق العرض/الطلب): (افتراضي: 2) — يحد من عدد المناطق النشطة المعروضة للحفاظ على نظافة الرسم البياني.
Retest Bonus % (مكافأة إعادة الاختبار %): (افتراضي: 10) — يعزز درجة قوة المنطقة في كل مرة يتم فيها إعادة اختبارها (حتى الحد الأقصى لإعادة الاختبارات).
Time Decay Rate % (معدل الاضمحلال الزمني %): (افتراضي: 1) — يقلل من قوة المنطقة لكل 10 شمعات تبقى فيها دون كسر (المناطق القديمة تضعف).
Flip Zone on Break (قلب المنطقة عند الكسر): (افتراضي: True - صحيح) — يحول منطقة الطلب المكسورة إلى منطقة عرض (والعكس صحيح)، مما يعكس مفاهيم التحول الهيكلي.
💡 اقتراحات للمستخدمين المتقدمين 🚀
ابحث عن المناطق المقلوبة (Flipped Zones): انتبه بشكل خاص إلى المناطق التي تم كسرها وقلبها (يشار إليها بنص أصفر في التسميات). غالبًا ما تؤدي المناطق المقلوبة التي تؤكد اتجاه Arbitor إلى تحركات استمرارية ذات زخم عالٍ.
تأكيد قوة HVN: أعطِ الأولوية دائمًا لتداول المناطق ذات درجة القوة العالية (على سبيل المثال، 90% أو أعلى)، حيث يشير هذا إلى أقصى درجات التضافر بين الحجم والتقلب ومكافأة HVN.
الأطر الزمنية التكيفية: استخدم المؤشر على أطر زمنية متعددة للتأكد من توافق انحياز Arbitor مع اتجاه تداولك. إذا كان Arbitor صعوديًا على كل من الرسم البياني 5 دقائق والساعة الواحدة، تكون القناعة عالية بشكل استثنائي.
ملاحظة أخيرة: يجمع مؤشر DX S&D Pro أفضل ما في تتبع الاتجاه مع أفضل ما في التداول الهيكلي. إنه جيد جدًا، لدرجة أننا نطلق عليه اسم Arbitor لأنه يحسم الجدل بين المشترين والبائعين... حتى الشمعة التالية بالطبع! 😉
دعواتكم 🙏.
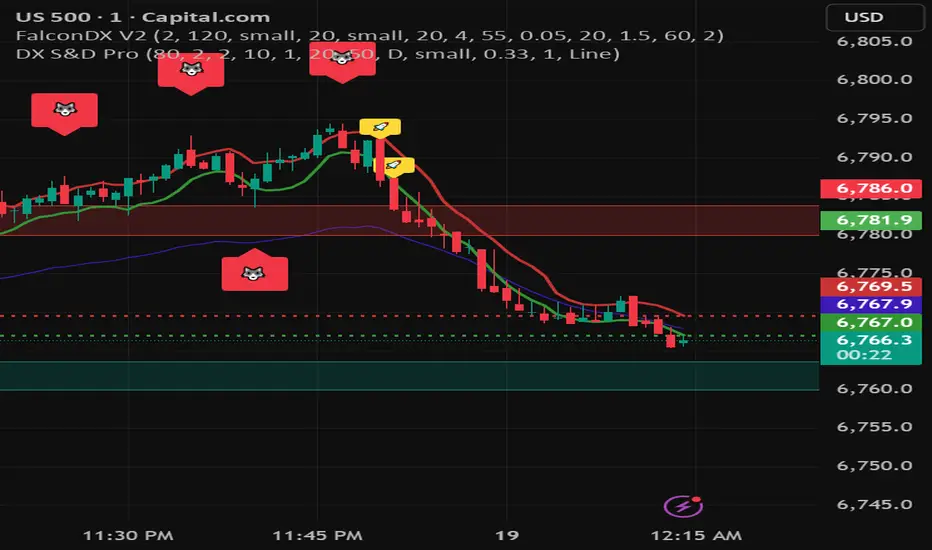
DX Supply and Demand Pro💎 DX Supply and Demand Pro: Adaptive Line and Zone Mastery
The DX Supply and Demand Pro indicator is an advanced, hybrid trading tool engineered for precision and context. It seamlessly integrates the proprietary Arbitor Line with dynamic, volume-weighted Supply and Demand Zones. This unique combination provides traders with a clear, adaptive view of both the current trend bias and critical structural price levels.
⚠️ Critical Trading Disclaimer 🛑
Trading is highly speculative and carries a substantial risk of loss. The use of this indicator does not guarantee profits, and you may lose more than your initial capital. Before using this tool in a live trading environment, you must test its performance thoroughly using paper trading or a simulated account.
Why Traders Need the DX S&D Pro 🎯
Proprietary Adaptive Intelligence: The Arbitor Line is a calculated price anchor derived from a complex, undisclosed combination of multiple market factors and proprietary equations. It automatically adjusts its sensitivity based on the chart's timeframe, effectively filtering out market noise to present an accurate, weighted average of the prevailing market bias.
Structural Clarity: It detects high-probability Supply and Demand Zones using pivot points, filtering them for strength based on volume, ATR (volatility), and High Volume Node (HVN) confirmation from a higher timeframe.
Actionable Confluence: The indicator combines dynamic trend bias (the Arbitor Line) with static structural levels (S&D Zones). This allows traders to identify high-conviction setups where the structural turning point is confirmed by the real-time bias of the Arbitor Line.
Feedback & Accountability 🤝
This indicator is provided "as is" and its performance is based on the parameters set by the user. Any suggestions or comments from users regarding performance, bugs, or feature requests should be directed to the developer here or X @Falcondxeye. The developer assumes no liability for trading losses incurred using this tool.
📚 How to Use DX Supply and Demand Pro
This indicator is best used as a confluence tool, where the Arbitor Line confirms the strength and direction of the setup identified by the Supply/Demand Zones.
Trading Confluence with the Arbitor Line:
Scenario: Buy Zone Rejection 🟢
Condition: Price touches a Demand Zone.
Confluence: The Arbitor Line is Above the zone.
Interpretation: Indicates a Bullish Bias is confirming the structural support. Focus on long entries.
Scenario: Sell Zone Rejection 🔴
Condition: Price touches a Supply Zone.
Confluence: The Arbitor Line is Below the zone.
Interpretation: Indicates a Bearish Bias is confirming the structural resistance. Focus on short entries.
Scenario: Momentum Break ⚡
Condition: Price Closes strongly beyond a zone.
Confluence: The Arbitor Line is Aligned with the Break.
Interpretation: Confirms market momentum and suggests the structural break is valid for directional continuation.
⚙️ Key Settings and Optimization Guide 🔧
Arbitor Line Settings (Trend Bias):
VWAP Weight: (Default: 0.33) — The weight applied to a key volume component within the proprietary Arbitor calculation.
Suggestion for High Volatility/Volume: Increase to 0.40 to emphasize volume's influence.
Suggestion for Clean Trends: Decrease to 0.25 to allow momentum components to dictate the line's position.
Supply & Demand Zone Settings (Structural Levels)
HVN Volume TF: (Default: D - Daily) — Crucial Context Setter. The higher timeframe used to look for High Volume Nodes (HVNs) to confirm zone strength.
For Scalping (1m-15m): Use 1H or 4H for validation.
For Day Trading (30m-1H): Use 4H or D. D is the recommended default.
For Swing Trading (4H-Daily): Use W (Weekly).
HVN Bonus %: (Default: 20) — The strength boost applied to a zone if it aligns with an HVN.
Max Supply/Demand Zones: (Default: 2) — Limits the number of active, displayed zones to keep the chart clean.
Retest Bonus %: (Default: 10) — Boosts a zone's strength score each time it is retested (up to max retests).
Time Decay Rate %: (Default: 1) — Reduces a zone's strength for every 10 bars it remains unbroken (stale zones weaken).
Flip Zone on Break: (Default: True) — Turns a broken Demand Zone into a Supply Zone (and vice versa), reflecting structural flip concepts.
💡 Suggestions for Power Users 🚀
Look for Flipped Zones: Pay attention to zones that have been broken and flipped (indicated by yellow text in the labels). Flipped zones that confirm the Arbitor direction often lead to high-momentum continuation moves.
Confirm HVN Strength: Always prioritize trading zones with a high strength score (e.g., 90% or higher), as this indicates maximum confluence of Volume, Volatility, and the HVN Bonus.
Adaptive Timeframes: Use the indicator on multiple timeframes to ensure the Arbitor bias aligns with your trade direction. If the Arbitor is bullish on both the 5-minute and the 1-hour chart, the conviction is exceptionally high.
Final Note: The DX S&D Pro combines the best of trend following with the best of structural trading. It's so good, we call it the Arbitor because it settles the arguments between buyers and sellers... until the next bar, of course! 😉
....................................................................................
💎 مؤشر DX Supply and Demand Pro: خط التكيّف وإتقان المناطق ✨
مؤشر DX Supply and Demand Pro هو أداة تداول هجينة ومتقدمة مصممة للدقة والسياق. إنه يدمج بسلاسة خط Arbitor الخاص بنا مع مناطق العرض والطلب الديناميكية المرجحة بالحجم. يوفر هذا المزيج الفريد للمتداولين رؤية واضحة ومتكيفة لكل من انحياز الاتجاه الحالي ومستويات الأسعار الهيكلية (Structural Price Levels) الحرجة.
⚠️ إخلاء مسؤولية حاسم بشأن التداول 🛑
التداول ينطوي على مخاطرة عالية للغاية ويحمل مخاطر خسارة كبيرة. استخدام هذا المؤشر لا يضمن الأرباح، وقد تخسر أكثر من رأس مالك الأولي. قبل استخدام هذه الأداة في بيئة تداول حقيقية، يجب عليك اختبار أدائها بشكل شامل باستخدام التداول الورقي (Paper Trading) أو حساب محاكاة.
لماذا يحتاج المتداولون إلى مؤشر DX S&D Pro 🎯
ذكاء تكيّفي خاص (Proprietary Adaptive Intelligence): خط Arbitor هو مرساة سعر محسوبة مشتقة من تركيبة معقدة وغير معلنة من عوامل سوق متعددة ومعادلات خاصة. يقوم بضبط حساسيته تلقائيًا بناءً على الإطار الزمني للرسم البياني، مما يزيل ضوضاء السوق بشكل فعال لتقديم متوسط مرجح ودقيق للانحياز السائد في السوق.
وضوح هيكلي (Structural Clarity): يكتشف مناطق العرض والطلب ذات الاحتمالية العالية باستخدام نقاط التحول (Pivot Points)، ويقوم بترشيحها وتحديد قوتها بناءً على الحجم، ATR (التقلب)، وتأكيد من عقدة الحجم العالية (HVN) من إطار زمني أعلى.
تضافر قابل للتطبيق (Actionable Confluence): يجمع المؤشر بين انحياز الاتجاه الديناميكي (خط Arbitor) ومستويات الهيكل الثابتة (مناطق العرض والطلب). يتيح ذلك للمتداولين تحديد إعدادات ذات قناعة عالية حيث يتم تأكيد نقطة التحول الهيكلية من خلال انحياز خط Arbitor في الوقت الفعلي.
الملاحظات والمساءلة 🤝
يتم توفير هذا المؤشر "كما هو" ويستند أدائه إلى الاعدادات التي يحددها المستخدم. يجب توجيه أي اقتراحات أو تعليقات من المستخدمين بخصوص الأداء أو الأخطاء أو طلبات الميزات إلى المطور هنا أو على X @Falcondxeye. لا يتحمل المطور أي مسؤولية عن خسائر التداول المتكبدة باستخدام هذه الأداة.
📚 كيفية استخدام مؤشر DX Supply and Demand Pro
يُفضل استخدام هذا المؤشر كأداة تضافر، حيث يؤكد خط Arbitor قوة واتجاه الإعداد المحدد بواسطة مناطق العرض والطلب.
تضافر التداول مع خط Arbitor:
السيناريو: ارتداد منطقة الشراء 🟢
الحالة: يلامس السعر منطقة الطلب (Demand Zone).
التضافر: يقع خط Arbitor فوق المنطقة.
التفسير: يشير إلى أن انحياز صعودي (Bullish Bias) يؤكد الدعم الهيكلي. التركيز على صفقات الشراء (Long Entries).
السيناريو: ارتداد منطقة البيع 🔴
الحالة: يلامس السعر منطقة العرض (Supply Zone).
التضافر: يقع خط Arbitor أسفل المنطقة.
التفسير: يشير إلى أن انحياز هبوطي (Bearish Bias) يؤكد المقاومة الهيكلية. التركيز على صفقات البيع (Short Entries).
السيناريو: كسر الزخم ⚡
الحالة: يُغلق السعر بقوة خارج المنطقة.
التضافر: يتماشى خط Arbitor مع الكسر.
التفسير: يؤكد زخم السوق ويشير إلى أن الكسر الهيكلي صالح للاستمرار الاتجاهي.
⚙️ الإعدادات الرئيسية ودليل التحسين 🔧
إعدادات خط Arbitor (انحياز الاتجاه)
VWAP Weight (وزن VWAP): (افتراضي: 0.33) — الوزن المطبق على مكون حجم رئيسي ضمن حساب Arbitor الخاص بنا.
اقتراح للتقلب/الحجم العالي: زيادة إلى 0.40 للتأكيد على تأثير الحجم.
اقتراح للاتجاهات النظيفة: تقليل إلى 0.25 للسماح لمكونات الزخم بتحديد موقع الخط بشكل أقوى.
إعدادات مناطق العرض والطلب (المستويات الهيكلية)
HVN Volume TF (الإطار الزمني لحجم HVN): (افتراضي: D - يومي) — مُحدِد السياق الحاسم. الإطار الزمني الأعلى المستخدم للبحث عن عقد الحجم العالية (HVNs) لتأكيد قوة المنطقة.
للمضاربة اللحظية (1د-15د): استخدم 1س أو 4س للتحقق.
للتداول اليومي (30د-1س): استخدم 4س أو D. D هو الإعداد الافتراضي الموصى به.
للتداول المتأرجح (4س-يومي): استخدم W (أسبوعي).
HVN Bonus % (مكافأة HVN %): (افتراضي: 20) — تعزيز القوة المطبق على المنطقة إذا كانت تتماشى مع عقدة HVN.
Max Supply/Demand Zones (الحد الأقصى لمناطق العرض/الطلب): (افتراضي: 2) — يحد من عدد المناطق النشطة المعروضة للحفاظ على نظافة الرسم البياني.
Retest Bonus % (مكافأة إعادة الاختبار %): (افتراضي: 10) — يعزز درجة قوة المنطقة في كل مرة يتم فيها إعادة اختبارها (حتى الحد الأقصى لإعادة الاختبارات).
Time Decay Rate % (معدل الاضمحلال الزمني %): (افتراضي: 1) — يقلل من قوة المنطقة لكل 10 شمعات تبقى فيها دون كسر (المناطق القديمة تضعف).
Flip Zone on Break (قلب المنطقة عند الكسر): (افتراضي: True - صحيح) — يحول منطقة الطلب المكسورة إلى منطقة عرض (والعكس صحيح)، مما يعكس مفاهيم التحول الهيكلي.
💡 اقتراحات للمستخدمين المتقدمين 🚀
ابحث عن المناطق المقلوبة (Flipped Zones): انتبه بشكل خاص إلى المناطق التي تم كسرها وقلبها (يشار إليها بنص أصفر في التسميات). غالبًا ما تؤدي المناطق المقلوبة التي تؤكد اتجاه Arbitor إلى تحركات استمرارية ذات زخم عالٍ.
تأكيد قوة HVN: أعطِ الأولوية دائمًا لتداول المناطق ذات درجة القوة العالية (على سبيل المثال، 90% أو أعلى)، حيث يشير هذا إلى أقصى درجات التضافر بين الحجم والتقلب ومكافأة HVN.
الأطر الزمنية التكيفية: استخدم المؤشر على أطر زمنية متعددة للتأكد من توافق انحياز Arbitor مع اتجاه تداولك. إذا كان Arbitor صعوديًا على كل من الرسم البياني 5 دقائق والساعة الواحدة، تكون القناعة عالية بشكل استثنائي.
ملاحظة أخيرة: يجمع مؤشر DX S&D Pro أفضل ما في تتبع الاتجاه مع أفضل ما في التداول الهيكلي. إنه جيد جدًا، لدرجة أننا نطلق عليه اسم Arbitor لأنه يحسم الجدل بين المشترين والبائعين... حتى الشمعة التالية بالطبع! 😉
دعواتكم 🙏..

Cosmic Crypto Golden ZoneCosmic Crypto Golden Zone
## Overview
**Cosmic Crypto Golden Zone** is an all-in-one swing trading indicator designed to identify high-probability retracement entries using Fibonacci levels, multi-timeframe confluence, and a simple Buy/Sell scoring system. The indicator removes the guesswork from trading pullbacks by combining structure analysis, momentum indicators, and volume confirmation into a single, easy-to-read signal.
**Best Used For:** Swing trading on 15m, 1H, and 4H timeframes in crypto, forex, and stocks.
---
## Key Features
### 🎯 Golden Zone Detection
Automatically identifies the optimal entry zone (0.5 - 0.786 Fibonacci retracement) where price is most likely to reverse and continue the trend.
### 📊 Buy/Sell Scoring (1-10)
A simplified signal table that scores setups from 1-10, telling you exactly when to buy or sell without needing to interpret multiple indicators.
### 📈 Multi-Timeframe Confluence
Filters trades to align with the higher timeframe trend (default: 4H), ensuring you only trade in the dominant direction.
### 🔍 Structure Detection (HH/HL/LH/LL)
Tracks market structure with Higher Highs, Higher Lows, Lower Highs, and Lower Lows to determine trend direction.
### 💧 Liquidity Sweep Detection
Identifies when price sweeps beyond the 0.886 level (stop-hunting zone) and reclaims the entry zone—a premium reversal signal.
### 📉 RSI Divergence Detection
Spots bullish and bearish divergences within the golden zone for additional confirmation.
### 🛡️ Dynamic Stop Loss
ATR-based stop loss that adjusts to current volatility, protecting you in both calm and volatile markets.
### 🎯 Smart Take Profit
Calculates TP based on your chosen entry point (FOMO, ENTRY, or Average) with customizable Risk:Reward targeting.
---
## How to Read the Signal Table
The table in the bottom-right corner gives you everything you need at a glance:
| Row | What It Shows |
|-----|---------------|
| **BUY/SELL + Score** | Direction and strength (1-10) |
| **Action** | 🚀 NOW (8+), ✓ READY (6-7), 👀 WATCH (4-5), ⏳ WAIT (<4) |
| **Zone** | Whether price is IN the golden zone or waiting |
| **Entry / TP / SL** | Your exact trade levels |
| **R:R** | Risk-to-Reward ratio with quality indicator |
### Score Breakdown
| Score | Meaning | Action |
|-------|---------|--------|
| **8-10** | High conviction setup | Enter on next candle close |
| **6-7** | Good setup | Enter with confirmation candle |
| **4-5** | Possible setup | Wait for more confluence |
| **1-3** | Weak/No setup | Skip this trade |
---
## How to Use: Step-by-Step
### Step 1: Check the Trend Direction
Look at the **Structure** in the info display:
- **BULLISH** (HH + HL pattern) → Only look for BUY signals
- **BEARISH** (LL + LH pattern) → Only look for SELL signals
### Step 2: Wait for Price to Enter the Golden Zone
The golden zone is highlighted between the **FOMO (0.618)** and **ENTRY (0.786)** levels. The table will show "✓ IN ZONE" when price reaches this area.
### Step 3: Check Your Score
Wait for the Buy/Sell score to reach **6 or higher** before considering an entry. Higher scores = higher probability.
### Step 4: Look for Confirmation
The best entries have multiple confirmations:
- ✅ Score 6+
- ✅ In Golden Zone
- ✅ Stochastic oversold/overbought
- ✅ RSI Divergence (DIV label)
- ✅ Liquidity Sweep (LIQ label) — *Premium signal*
- ✅ Bullish/Bearish candle pattern
### Step 5: Execute the Trade
Use the levels shown on the chart and in the table:
- **Entry:** FOMO (aggressive) or ENTRY (conservative)
- **Stop Loss:** Below/above the SL line (red)
- **Take Profit:** At the TP line (green)
---
## Chart Labels Explained
| Label | Color | Meaning |
|-------|-------|---------|
| **FOMO: ** | Green | 0.618 Fib - Aggressive entry level |
| **ENTRY: ** | Yellow (Bold) | 0.786 Fib - Conservative entry level |
| **LIQ: ** | Red | 0.886 Fib - Liquidity/stop-hunt zone |
| **TP: ** | Green | Take Profit target |
| **SL: ** | Red (Bold) | Stop Loss level |
| **R:R ** | Green/Orange | Risk-to-Reward ratio |
| **HH/HL/LH/LL** | Various | Structure swing labels |
| **DIV** | Lime/Pink | RSI Divergence detected |
| **LIQ** (arrow) | Lime/Red | Liquidity sweep signal |
| **AE** | Green/Red | Williams Vix Fix Aggressive Entry |
| **B/S** | Green/Red | Buy/Sell signal with score |
---
## Recommended Settings
### For Crypto (BTC, ETH, Altcoins)
- **Timeframe:** 1H or 4H
- **HTF:** 4H or Daily
- **Use Logarithmic Fibs:** ✅ ON
- **TP R:R Target:** 2.0 - 3.0
### For Forex
- **Timeframe:** 15m or 1H
- **HTF:** 4H
- **Use Logarithmic Fibs:** ❌ OFF
- **TP R:R Target:** 1.5 - 2.0
### For Stocks
- **Timeframe:** 1H or Daily
- **HTF:** Daily or Weekly
- **Use Logarithmic Fibs:** ✅ ON
- **TP R:R Target:** 2.0
---
## Settings Reference
### Structure (ZigZag)
- **Left Bars:** Lookback period for pivot detection (default: 10)
- **Right Bars:** Confirmation bars (default: 2)
- **Show Swing Labels:** Display HH/HL/LH/LL markers
### Multi-Timeframe Confluence
- **Enable MTF Filter:** Only trade when aligned with HTF trend
- **Higher Timeframe:** The timeframe to check trend (default: 4H)
### ADX Trend Strength
- **Enable ADX Filter:** Filter out choppy/ranging markets
- **ADX Threshold:** Minimum ADX value for trend confirmation (default: 20)
### Auto Fib Settings
- **Use Logarithmic Fibs:** Better for large % moves (crypto/stocks)
- **Fib Length:** How far the fib lines extend
### Split-Entry Trade Planner
- **Entry 1 Ratio:** FOMO level (default: 0.618)
- **Entry 2 Ratio:** ENTRY level (default: 0.786)
- **TP Calculation Mode:** Base TP on ENTRY, FOMO, or Average
- **TP R:R Target:** Your desired risk-to-reward ratio
- **Use ATR-Based Dynamic SL:** Volatility-adjusted stop loss
- **SL ATR Multiplier:** How many ATRs below entry for SL
### Williams Vix Fix
- **Show Bullish/Bearish AE:** Aggressive entry signals based on volatility extremes
- **Only Show in Golden Zone:** Filter VixFix signals to golden zone only
---
## Pro Tips
### 1. The Liquidity Sweep is Gold
When you see the **LIQ** arrow after price wicks below 0.886 and reclaims 0.786, this is often the best entry. Stops have been hunted, weak hands are out, and smart money is entering.
### 2. Don't Fight the HTF Trend
If the 4H is bearish, don't take long signals on the 15m just because the score is high. Always align with the bigger picture.
### 3. Wait for "IN ZONE"
Patience pays. The best setups come when price actually pulls back to the golden zone. Chasing breakouts leads to poor R:R.
### 4. Score 6+ is the Minimum
Scores of 4-5 can work, but your win rate will be significantly higher waiting for 6+. Scores of 8+ are rare but highly reliable.
### 5. Use Multiple Timeframes
Check the setup on your trading timeframe AND one timeframe higher. If both show bullish structure with good scores, confidence is higher.
### 6. Respect the Stop Loss
The SL is placed below the liquidity zone for a reason. If price closes below it, the setup is invalidated. Don't move your stop.
---
## Alerts Available
- **High Confluence Long/Short** — When score reaches your threshold
- **Bullish/Bearish Liquidity Sweep** — Premium reversal signal
- **RSI Divergence Detected** — Divergence in golden zone
- **Williams Vix Fix AE** — Aggressive entry signal
---
## Credits
Created by **Cosmic Crypto**
Combines concepts from:
- Fibonacci Retracement Trading
- Smart Money Concepts (Liquidity Sweeps)
- Williams Vix Fix
- Multi-Timeframe Analysis
- Stochastic RSI
- ADX Trend Strength
---
*Trade responsibly. Past performance does not guarantee future results. Always use proper risk management.*

ICT Unicorn Model [Kodexius]ICT Unicorn Model is a market structure and imbalance confluence tool that automatically detects high probability “Unicorn” setups by combining three key elements into a single, clean script:
-A first, clean break of that swing level (displacement style break)
-A Fair Value Gap that overlaps a breaker candle body range
Instead of plotting every pivot or every imbalance independently, the script waits for a specific sequence: price establishes a valid swing, breaks that swing for the first time, and prints a setup only when the resulting context aligns with a valid, volatility filtered FVG and a clearly defined breaker range.
Each detected setup is drawn directly on the chart with labeled zones (Breaker and FVG) and is then actively monitored. If price violates the breaker boundary based on your chosen invalidation basis (Close or Wick), the setup is marked inactive and can optionally be removed to keep the chart clean.
This indicator is designed for traders who work with ICT style concepts such as liquidity runs, displacement, breaker blocks, and imbalance reversion, and who want a structured, rules based visualization rather than discretionary drawing.
🔹 Features
🔸 Fair Value Gap Detection With Volatility Filtering
Bullish and bearish FVGs are detected using classic three candle imbalance logic. To avoid low quality gaps during compression, the script applies an ATR based minimum size filter using the “FVG Min Size (ATR Multiplier)” input. Only gaps larger than ATR * threshold are considered valid.
🔸 First Break Validation (Clean Break Logic)
A key part of the model is identifying a “first break” of a swing level. The script checks whether the swing price has already been invalidated between the swing bar and the current bar. If it has, the swing is ignored. This helps reduce repeated signals and focuses on fresh structural breaks.
🔸 Breaker and FVG Confluence With Overlap Requirement
After a valid break occurs, the script defines a breaker range using the body of the swing candle (open and close). A setup is only created if this breaker body range overlaps the detected FVG price range. This overlap requirement is what filters many “almost” conditions and keeps signals more selective.
Bullish Unicorn:
Bearish Unicorn:
🔸 Configurable Invalidation Basis (Close or Wick)
You can choose how a setup fails:
-Close: invalidation requires a candle close beyond the breaker boundary
-Wick: invalidation occurs as soon as any wick crosses beyond the breaker boundary
This allows the tool to adapt to different trading styles, from conservative confirmation to more sensitive risk control.
🔸 Automatic Cleanup of Failed Setups
If “Delete Invalidated Setups” is enabled, the script removes the breaker box, FVG box, and label as soon as the setup is invalidated. If disabled, the zones remain visible for review while the setup is marked inactive internally.
🔸 Clear Chart Visuals
Each setup plots:
-A labeled Breaker zone box
-A labeled FVG zone box
-A directional Unicorn label (Bull or Bear) that updates position as the chart advances
Colors for bullish and bearish structures are fully configurable.
🔸 Alert Conditions
Two alert conditions are provided:
-Bullish Unicorn Setup Detected
-Bearish Unicorn Setup Detected
Alerts trigger only on the bar a new setup is created.
🔹 Calculations
This section summarizes the main computations used internally. The goal here is to explain the model mechanics rather than reproduce every implementation detail.
1. Swing Detection (Pivot High / Pivot Low)
Swing levels are detected using a symmetric pivot definition with “Swing Length” bars on both sides:
float ph = ta.pivothigh(high, swingLength, swingLength)
float pl = ta.pivotlow(low, swingLength, swingLength)
When a pivot is confirmed, its price and originating bar index are stored:
-Swing High: price = pivot high, isHigh = true
-Swing Low: price = pivot low, isHigh = false
The script keeps a limited history (most recent swings) to stay efficient.
2. Fair Value Gap Detection
FVGs use the classic three candle displacement imbalance:
Bullish FVG condition
bool isBullFVG = high < low
Bullish gap range is defined as:
-Top = low
-Bottom = high
Bearish FVG condition
bool isBearFVG = low > high
Bearish gap range is defined as:
-Top = low
-Bottom = high
3. ATR Based Minimum Gap Filter
ATR is computed (length 14), then the gap size is compared against a user threshold:
float atr = ta.atr(14)
bool validBullFVG = isBullFVG and (bullFvgTop - bullFvgBot) > (atr * fvgThreshold)
bool validBearFVG = isBearFVG and (bearFvgTop - bearFvgBot) > (atr * fvgThreshold)
This prevents very small imbalances from generating setups in low volatility conditions.
4. “First Break” Check Using Level Invalidation Scan
Before accepting a swing break, the script scans forward from the swing bar to the current bar to confirm the level has not already been breached. The scan can be based on wick or close:
-Wick mode: uses high or low
-Close mode: uses close
Conceptually:
priceToCheck = mode == "Wick" ? (checkBelow ? low : high) : close
If a prior breach is found, the swing is treated as already invalidated and is ignored for setup creation.
5. Break Of Structure Condition
Bullish break requirement
A bullish setup requires breaking a stored swing high with bullish body intent:
-close > swingHighPrice
-open < close
Bearish break requirement
A bearish setup requires breaking a stored swing low with bearish body intent:
-close < swingLowPrice
-open > close
An additional proximity filter is applied in the bearish branch to reduce weak or overly extended breaks by requiring the prior close to be reasonably near the swing level.
6. Breaker Range Construction
Once a qualifying swing is found, the breaker range is derived from the body of the swing candle (the candle at the swing bar index). The body boundaries are:
float breakerTop = math.max(bOpen, bClose)
float breakerBot = math.min(bOpen, bClose)
This models the breaker as the candle body range rather than full wick range, which typically produces more practical invalidation boundaries.
7. Overlap Test Between Breaker and FVG
A setup is only created if the breaker body overlaps the FVG zone. Conceptually the script rejects cases where one range is fully above or fully below the other:
-If there is no overlap, no setup is created
-If overlap exists, the Unicorn setup is valid
8. Active Monitoring and Invalidation
Each setup remains active until invalidated. Invalidation is evaluated every bar using your selected basis:
-Close basis: compares close to breaker boundary
-Wick basis: compares high or low to breaker boundary
Bullish invalidation
Setup fails if price crosses below breaker bottom.
Bearish invalidation
Setup fails if price crosses above breaker top.
If deletion is enabled, all drawings related to that setup are removed immediately on invalidation.
9. Drawing Updates and Object Lifecycle
Breaker and FVG boxes are extended to the right while the setup is active to keep zones visible into the near future. The Unicorn label is also repositioned as new bars print so the most recent context stays readable.

Boyen_Clean Historical Key Levels (WO, MO, YO & Mon)Define historical Key Level Weekly Open, Montly Open and Yearly Open
Additional with current Monday low & Monday high level
