Polynomial Regression HeatmapPolynomial Regression Heatmap – Advanced Trend & Volatility Visualizer
Overview
The Polynomial Regression Heatmap is a sophisticated trading tool designed for traders who require a clear and precise understanding of market trends and volatility. By applying a second-degree polynomial regression to price data, the indicator generates a smooth trend curve, augmented with adaptive volatility bands and a dynamic heatmap. This framework allows users to instantly recognize trend direction, potential reversals, and areas of market strength or weakness, translating complex price action into a visually intuitive map.
Unlike static trend indicators, the Polynomial Regression Heatmap adapts to changing market conditions. Its visual design—including color-coded candles, regression bands, optional polynomial channels, and breakout markers—ensures that price behavior is easy to interpret. This makes it suitable for scalping, swing trading, and longer-term strategies across multiple asset classes.
How It Works
The core of the indicator relies on fitting a second-degree polynomial to a defined lookback period of price data. This regression curve captures the non-linear nature of market movements, revealing the true trajectory of price beyond the distortions of noise or short-term volatility.
Adaptive upper and lower bands are constructed using ATR-based scaling, surrounding the regression line to reflect periods of high and low volatility. When price moves toward or beyond these bands, it signals areas of potential overextension or support/resistance.
The heatmap colors each candle based on its relative position within the bands. Green shades indicate proximity to the upper band, red shades indicate proximity to the lower band, and neutral tones represent mid-range positioning. This continuous gradient visualization provides immediate feedback on trend strength, market balance, and potential turning points.
Optional polynomial channels can be overlaid around the regression curve. These three-line channels are based on regression residuals and a fixed width multiplier, offering additional reference points for analyzing price deviations, trend continuation, and reversion zones.
Signals and Breakouts
The Polynomial Regression Heatmap includes statistical pivot-based signals to highlight actionable price movements:
Buy Signals – A triangular marker appears below the candle when a pivot low occurs below the lower regression band.
Sell Signals – A triangular marker appears above the candle when a pivot high occurs above the upper regression band.
These markers identify significant deviations from the regression curve while accounting for volatility, providing high-quality visual cues for potential entry points.
The indicator ensures clarity by spacing markers vertically using ATR-based calculations, preventing overlap during periods of high volatility. Users can rely on these signals in combination with heatmap intensity and regression slope for contextual confirmation.
Interpretation
Trend Analysis :
The slope of the polynomial regression line represents trend direction. A rising curve indicates bullish bias, a falling curve indicates bearish bias, and a flat curve indicates consolidation.
Steeper slopes suggest stronger momentum, while gradual slopes indicate more moderate trend conditions.
Volatility Assessment :
Band width provides an instant visual measure of market volatility. Narrow bands correspond to low volatility and potential consolidation, whereas wide bands indicate higher volatility and significant price swings.
Heatmap Coloring :
Candle colors visually represent price position within the bands. This allows traders to quickly identify zones of bullish or bearish pressure without performing complex calculations.
Channel Analysis (Optional) :
The polynomial channel defines zones for evaluating potential overextensions or retracements. Price interacting with these lines may suggest areas where mean-reversion or trend continuation is likely.
Breakout Signals :
Buy and Sell markers highlight pivot points relative to the regression and volatility bands. These are statistical signals, not arbitrary triggers, and should be interpreted in context with trend slope, band width, and heatmap intensity.
Strategy Integration
The Polynomial Regression Heatmap supports multiple trading approaches:
Trend Following – Enter trades in the direction of the regression slope while using the heatmap for momentum confirmation.
Pullback Entries – Use breakouts or deviations from the regression bands as low-risk entry points during trend continuation.
Mean Reversion – Price reaching outer channel boundaries can indicate potential reversal or retracement opportunities.
Multi-Timeframe Alignment – Overlay on higher and lower timeframes to filter noise and improve entry timing.
Stop-loss levels can be set just beyond the opposing regression band, while take-profit targets can be informed by the distance between the bands or the curvature of the polynomial line.
Advanced Techniques
For traders seeking greater precision:
Combine the Polynomial Regression Heatmap with volume, momentum, or volatility indicators to validate signals.
Observe the width and slope of the regression bands over time to anticipate expanding or contracting volatility.
Track sequences of breakout signals in conjunction with heatmap intensity for systematic trade management.
Adjusting regression length allows customization for different assets or timeframes, balancing responsiveness and smoothing. The combination of polynomial curve, adaptive bands, heatmap, and optional channels provides a comprehensive statistical framework for informed decision-making.
Inputs and Customization
Regression Length – Determines the number of bars used for polynomial fitting. Shorter lengths increase responsiveness; longer lengths improve smoothing.
Show Bands – Toggle visibility of the ATR-based regression bands.
Show Channel – Enable or disable the polynomial channel overlay.
Color Settings – Customize bullish, bearish, neutral, and accent colors for clarity and visual preference.
All other internal parameters are fixed to ensure consistent statistical behavior and minimize potential misconfiguration.
Why Use Polynomial Regression Heatmap
The Polynomial Regression Heatmap transforms complex price action into a clear, actionable visual framework. By combining non-linear trend mapping, adaptive volatility bands, heatmap visualization, and breakout signals, it provides a multi-dimensional perspective that is both quantitative and intuitive.
This indicator allows traders to focus on execution, interpret market structure at a glance, and evaluate trend strength, overextensions, and potential reversals in real time. Its design is compatible with scalping, swing trading, and long-term strategies, providing a robust tool for disciplined, data-driven trading.
Polynomialregressionanalysis

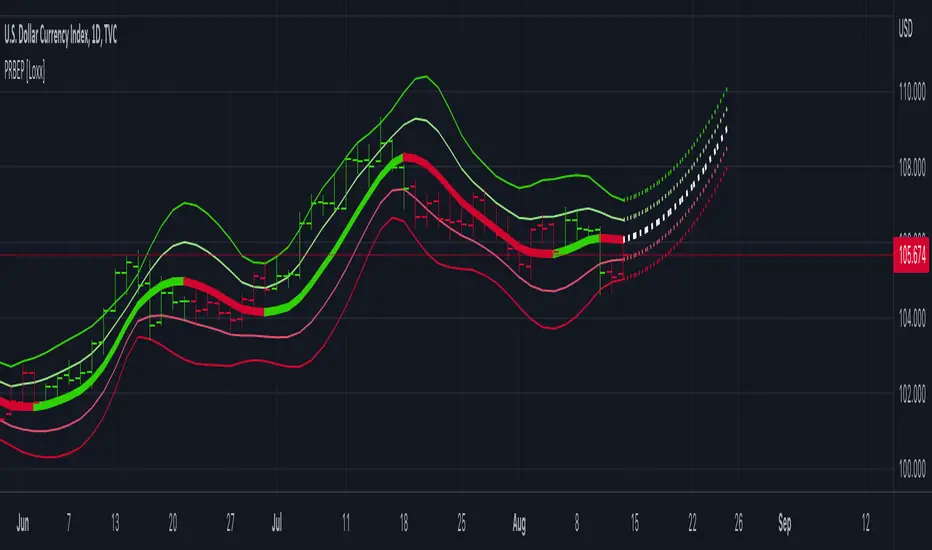
Polynomial Regression Bands w/ Extrapolation of Price [Loxx]Polynomial Regression Bands w/ Extrapolation of Price is a moving average built on Polynomial Regression. This indicator paints both a non-repainting moving average and also a projection forecast based on the Polynomial Regression. I've included 33 source types and 38 moving average types to smooth the price input before it's run through the Polynomial Regression algorithm. This indicator only paints X many bars back so as to increase on screen calculation speed. Make sure to read the tooltips to answer any questions you have.
What is Polynomial Regression?
In statistics, polynomial regression is a form of regression analysis in which the relationship between the independent variable x and the dependent variable y is modeled as an nth degree polynomial in x. Polynomial regression fits a nonlinear relationship between the value of x and the corresponding conditional mean of y, denoted E(y |x). Although polynomial regression fits a nonlinear model to the data, as a statistical estimation problem it is linear, in the sense that the regression function E(y | x) is linear in the unknown parameters that are estimated from the data. For this reason, polynomial regression is considered to be a special case of multiple linear regression .
Related indicators
Polynomial-Regression-Fitted Oscillator
Polynomial-Regression-Fitted RSI
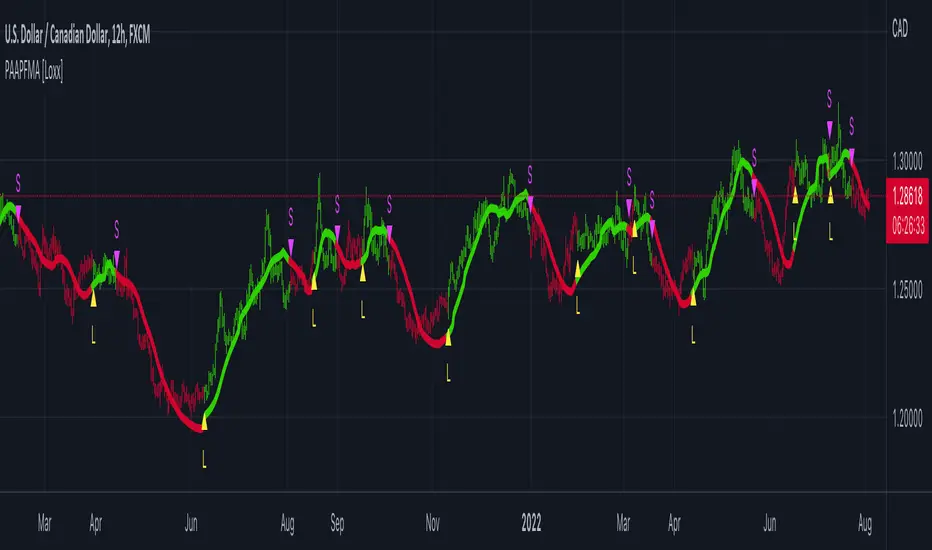
PA-Adaptive Polynomial Regression Fitted Moving Average
Poly Cycle
Fourier Extrapolator of Price w/ Projection Forecast
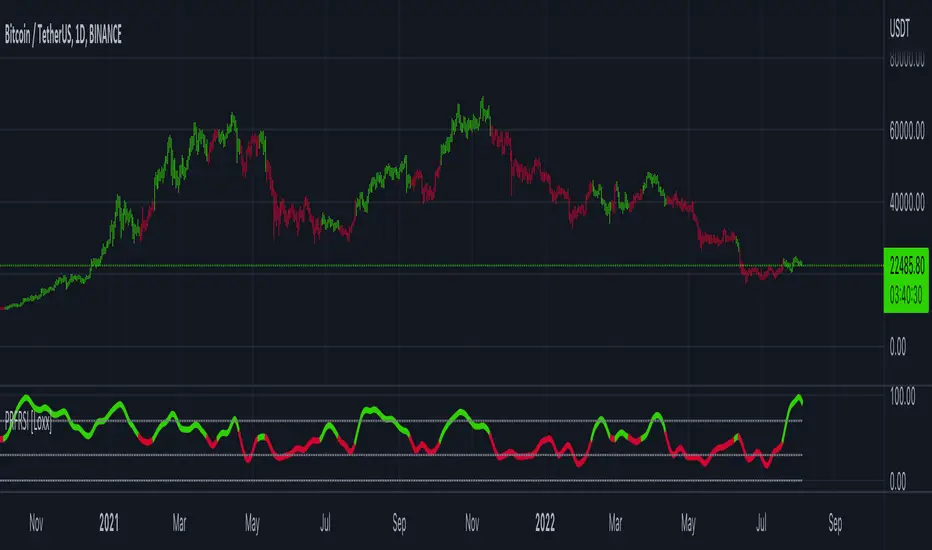
Polynomial-Regression-Fitted RSI [Loxx]Polynomial-Regression-Fitted RSI is an RSI indicator that is calculated using Polynomial Regression Analysis. For this one, we're just smoothing the signal this time. And we're using an odd moving average to do so: the Sine Weighted Moving Average. The Sine Weighted Moving Average assigns the most weight at the middle of the data set. It does this by weighting from the first half of a Sine Wave Cycle and the most weighting is given to the data in the middle of that data set. The Sine WMA closely resembles the TMA (Triangular Moving Average). So we're trying to tease out some cycle information here as well, however, you can change this MA to whatever soothing method you wish. I may come back to this one and remove the point modifier and then add preliminary smoothing, but for now, just the signal gets the smoothing treatment.
What is Polynomial Regression?
In statistics, polynomial regression is a form of regression analysis in which the relationship between the independent variable x and the dependent variable y is modeled as an nth degree polynomial in x. Polynomial regression fits a nonlinear relationship between the value of x and the corresponding conditional mean of y, denoted E(y |x). Although polynomial regression fits a nonlinear model to the data, as a statistical estimation problem it is linear, in the sense that the regression function E(y | x) is linear in the unknown parameters that are estimated from the data. For this reason, polynomial regression is considered to be a special case of multiple linear regression .
Included
Alerts
Signals
Bar coloring
Loxx's Expanded Source Types
Loxx's Moving Averages
Other indicators in this series using Polynomial Regression Analysis.
Poly Cycle
PA-Adaptive Polynomial Regression Fitted Moving Average
Polynomial-Regression-Fitted Oscillator
Polynomial-Regression-Fitted Oscillator [Loxx]Polynomial-Regression-Fitted Oscillator is an oscillator that is calculated using Polynomial Regression Analysis. This is an extremely accurate and processor intensive oscillator.
What is Polynomial Regression?
In statistics, polynomial regression is a form of regression analysis in which the relationship between the independent variable x and the dependent variable y is modeled as an nth degree polynomial in x. Polynomial regression fits a nonlinear relationship between the value of x and the corresponding conditional mean of y, denoted E(y |x). Although polynomial regression fits a nonlinear model to the data, as a statistical estimation problem it is linear, in the sense that the regression function E(y | x) is linear in the unknown parameters that are estimated from the data. For this reason, polynomial regression is considered to be a special case of multiple linear regression .
Things to know
You can select from 33 source types
The source is smoothed before being injected into the Polynomial fitting algorithm, there are 35+ moving averages to choose from for smoothing
This indicator is very processor heavy. so it will take some time load on the chart. Ideally the period input should allow for values from 1 to 200 or more, but due to processing restraints on Trading View, the max value is 80.
Included
Alerts
Signals
Bar coloring
Other indicators in this series using Polynomial Regression Analysis.
Poly Cycle
PA-Adaptive Polynomial Regression Fitted Moving Average

PA-Adaptive Polynomial Regression Fitted Moving Average [Loxx]PA-Adaptive Polynomial Regression Fitted Moving Average is a moving average that is calculated using Polynomial Regression Analysis. The purpose of this indicator is to introduce polynomial fitting that is to be used in future indicators. This indicator also has Phase Accumulation adaptive period inputs. Even though this first indicator is for demonstration purposes only, its still one of the only viable implementations of Polynomial Regression Analysis on TradingView is suitable for trading, and while this same method can be used to project prices forward, I won't be doing that since forecasting is generally worthless and causes unavoidable repainting. This indicator only repaints on the current bar. Once the bar closes, any signal on that bar won't change.
For other similar Polynomial Regression Fitted methodologies, see here
Poly Cycle
What is the Phase Accumulation Cycle?
The phase accumulation method of computing the dominant cycle is perhaps the easiest to comprehend. In this technique, we measure the phase at each sample by taking the arctangent of the ratio of the quadrature component to the in-phase component. A delta phase is generated by taking the difference of the phase between successive samples. At each sample we can then look backwards, adding up the delta phases.When the sum of the delta phases reaches 360 degrees, we must have passed through one full cycle, on average.The process is repeated for each new sample.
The phase accumulation method of cycle measurement always uses one full cycle’s worth of historical data.This is both an advantage and a disadvantage.The advantage is the lag in obtaining the answer scales directly with the cycle period.That is, the measurement of a short cycle period has less lag than the measurement of a longer cycle period. However, the number of samples used in making the measurement means the averaging period is variable with cycle period. longer averaging reduces the noise level compared to the signal.Therefore, shorter cycle periods necessarily have a higher out- put signal-to-noise ratio.
What is Polynomial Regression?
In statistics, polynomial regression is a form of regression analysis in which the relationship between the independent variable x and the dependent variable y is modelled as an nth degree polynomial in x. Polynomial regression fits a nonlinear relationship between the value of x and the corresponding conditional mean of y, denoted E(y |x). Although polynomial regression fits a nonlinear model to the data, as a statistical estimation problem it is linear, in the sense that the regression function E(y | x) is linear in the unknown parameters that are estimated from the data. For this reason, polynomial regression is considered to be a special case of multiple linear regression.
Things to know
You can select from 33 source types
The source is smoothed before being injected into the Polynomial fitting algorithm, there are 35+ moving averages to choose from for smoothing
The output of the Polynomial fitting algorithm is then smoothed to create the signal, there are 35+ moving averages to choose from for smoothing
Included
Alerts
Signals
Bar coloring