BTC CME Gaps Detector [SwissAlgo]BTC CME Gaps Detector
Track Unfilled Gaps & Identify Price Magnets
------------------------------------------------------
Overview
The BTC CME Gap Detector identifies and tracks unfilled price gaps on any timeframe (1-minute recommended for scalping) to gauge potential trading bias.
Verify Gap Behavior Yourself : Use TradingView's Replay Mode on the 1-Minute chart to observe how the price interacts with gaps. Load the BTC1! ticker (Bitcoin CME Futures), enable Replay Mode, and play forward through time (for example: go back 15 days). You may observe patterns such as price frequently returning to fill gaps, nearest gaps acting as near-term targets, and gaps serving as potential support/resistance zones. Some gaps may fill quickly, while others may remain open for longer periods. This hands-on analysis lets you independently assess how gaps may influence price movement in real market conditions and whether you may use this indicator as a complement to your trading analysis.
------------------------------------------------------
Purpose
Price gaps occur when there is a discontinuity between consecutive candles - when the current candle's low is above the previous candle's high (gap up), or when the current candle's high is below the previous candle's low (gap down).
This indicator identifies and tracks these gaps on any timeframe to help traders:
Identify gap zones that may attract price (potential "price magnets")
Monitor gap fill progression
Assess potential directional bias based on nearest unfilled gaps (long, short)
Analyze market structure and liquidity imbalances
------------------------------------------------------
Why Use This Indicator?
Universal Gap Detection : Identifies all gaps on any timeframe (1-minute, hourly, daily, etc.)
Multi-Candle Mitigation Tracking : Detects gap fills that occur across multiple candles
Distance Analysis : Shows percentage distance to nearest bullish and bearish gaps
Visual Representation : Color-coded boxes indicate gap status (active vs. mitigated)
Age Filtering : Option to display only gaps within specified time periods (3/6/12/24 months), as older gaps may lose relevance
ATR-Based Sizing : Minimum gap size adjusts to instrument volatility to filter noise (i.e. small gaps)
------------------------------------------------------
Trading Concept
Gaps represent price zones where no trading occurred. Historical market behavior suggests that unfilled gaps may attract price action as markets tend to revisit areas of incomplete price discovery. This phenomenon creates potential trading opportunities:
Bullish gaps (above current price) may act as upside targets where the price could move to fill the gap
Bearish gaps (below current price) may act as downside targets where price could move to fill the gap
The nearest gap often provides directional bias, as closer gaps may have a higher probability of being filled in the near term
This indicator helps quantify gap proximity and provides a visual reference for these potential target zones.
EXAMPLE
Step 1: Bearish Gaps Appear Below Price
Step 2: Price Getting Close to Fill Gap
Step 3: Gap Mitigated Gap
------------------------------------------------------
Recommended Setup
Timeframe: 1-minute chart recommended for maximum gap detection frequency. Works on all timeframes (higher timeframes will show fewer, larger gaps).
Symbol: Any tradable instrument. Originally designed for BTC1! (CME Bitcoin Futures) but compatible with all symbols.
Settings:
ATR Length: 14 (default)
Min Gap Size: 0.5x ATR (adjust based on timeframe and noise level)
Gap Age Limit: 3 months (configurable)
Max Historical Gaps: 300 (adjustable 1-500)
------------------------------------------------------
How It Works
Gap Detection : Identifies price discontinuities on every candle where:
Gap up: current candle low > previous candle high
Gap down: current candle high < previous candle low
Minimum gap size filter (ATR-based) eliminates insignificant gaps
Mitigation Tracking : Monitors when price touches both gap boundaries. A gap is marked as filled when the price has touched both the top and bottom of the gap zone, even if this occurs across multiple candles.
Visual Elements :
Green boxes: Unfilled gaps above current price (potential bullish targets)
Red boxes: Unfilled gaps below current price (potential bearish targets)
Gray boxes: Filled gaps (historical reference)
Labels: Display gap type, price level, and distance percentage
Analysis Table: Shows :
Distance % to nearest bullish gap (above price)
Distance % to nearest bearish gap (below price)
Trade bias (LONG if nearest gap is above, SHORT if nearest gap is below)
------------------------------------------------------
Key Features
Detects gaps on any timeframe (1m, 5m, 1h, 1D, etc.)
Boxes extend 500 bars forward for active gaps, stop at the fill bar for mitigated gaps
Real-time distance calculations update on every candle
Configurable age filter removes outdated gaps
ATR multiplier ensures gap detection adapts to market volatility and timeframe
------------------------------------------------------
Disclaimer
This indicator is provided for informational and educational purposes only.
It does not constitute financial advice, investment recommendations, or trading signals. The concept that gaps attract price is based on historical observation and does not guarantee future results.
Gap fills are not certain - gaps may remain unfilled indefinitely, or the price may reverse before reaching a gap. This indicator should not be used as the sole basis for trading decisions.
All trading involves substantial risk, including the potential loss of principal. Users should conduct their own research, apply proper risk management, test strategies thoroughly, and consult with qualified financial professionals before making trading decisions.
The authors and publishers are not responsible for any losses incurred through the use of this indicator.
Gestione portafoglio

Volatility-Targeted Momentum Portfolio [BackQuant]Volatility-Targeted Momentum Portfolio
A complete momentum portfolio engine that ranks assets, targets a user-defined volatility, builds long, short, or delta-neutral books, and reports performance with metrics, attribution, Monte Carlo scenarios, allocation pie, and efficiency scatter plots. This description explains the theory and the mechanics so you can configure, validate, and deploy it with intent.
Table of contents
What the script does at a glance
Momentum, what it is, how to know if it is present
Volatility targeting, why and how it is done here
Portfolio construction modes: Long Only, Short Only, Delta Neutral
Regime filter and when the strategy goes to cash
Transaction cost modelling in this script
Backtest metrics and definitions
Performance attribution chart
Monte Carlo simulation
Scatter plot analysis modes
Asset allocation pie chart
Inputs, presets, and deployment checklist
Suggested workflow
1) What the script does at a glance
Pulls a list of up to 15 tickers, computes a simple momentum score on each over a configurable lookback, then volatility-scales their bar-to-bar return stream to a target annualized volatility.
Ranks assets by raw momentum, selects the top 3 and bottom 3, builds positions according to the chosen mode, and gates exposure with a fast regime filter.
Accumulates a portfolio equity curve with risk and performance metrics, optional benchmark buy-and-hold for comparison, and a full alert suite.
Adds visual diagnostics: performance attribution bars, Monte Carlo forward paths, an allocation pie, and scatter plots for risk-return and factor views.
2) Momentum: definition, detection, and validation
Momentum is the tendency of assets that have performed well to continue to perform well, and of underperformers to continue underperforming, over a specific horizon. You operationalize it by selecting a horizon, defining a signal, ranking assets, and trading the leaders versus laggards subject to risk constraints.
Signal choices . Common signals include cumulative return over a lookback window, regression slope on log-price, or normalized rate-of-change. This script uses cumulative return over lookback bars for ranking (variable cr = price/price - 1). It keeps the ranking simple and lets volatility targeting handle risk normalization.
How to know momentum is present .
Leaders and laggards persist across adjacent windows rather than flipping every bar.
Spread between average momentum of leaders and laggards is materially positive in sample.
Cross-sectional dispersion is non-trivial. If everything is flat or highly correlated with no separation, momentum selection will be weak.
Your validation should include a diagnostic that measures whether returns are explained by a momentum regression on the timeseries.
Recommended diagnostic tool . Before running any momentum portfolio, verify that a timeseries exhibits stable directional drift. Use this indicator as a pre-check: It fits a regression to price, exposes slope and goodness-of-fit style context, and helps confirm if there is usable momentum before you force a ranking into a flat regime.
3) Volatility targeting: purpose and implementation here
Purpose . Volatility targeting seeks a more stable risk footprint. High-vol assets get sized down, low-vol assets get sized up, so each contributes more evenly to total risk.
Computation in this script (per asset, rolling):
Return series ret = log(price/price ).
Annualized volatility estimate vol = stdev(ret, lookback) * sqrt(tradingdays).
Leverage multiplier volMult = clamp(targetVol / vol, 0.1, 5.0).
This caps sizing so extremely low-vol assets don’t explode weight and extremely high-vol assets don’t go to zero.
Scaled return stream sr = ret * volMult. This is the per-bar, risk-adjusted building block used in the portfolio combinations.
Interpretation . You are not levering your account on the exchange, you are rescaling the contribution each asset’s daily move has on the modeled equity. In live trading you would reflect this with position sizing or notional exposure.
4) Portfolio construction modes
Cross-sectional ranking . Assets are sorted by cr over the chosen lookback. Top and bottom indices are extracted without ties.
Long Only . Averages the volatility-scaled returns of the top 3 assets: avgRet = mean(sr_top1, sr_top2, sr_top3). Position table shows per-asset leverages and weights proportional to their current volMult.
Short Only . Averages the negative of the volatility-scaled returns of the bottom 3: avgRet = mean(-sr_bot1, -sr_bot2, -sr_bot3). Position table shows short legs.
Delta Neutral . Long the top 3 and short the bottom 3 in equal book sizes. Each side is sized to 50 percent notional internally, with weights within each side proportional to volMult. The return stream mixes the two sides: avgRet = mean(sr_top1,sr_top2,sr_top3, -sr_bot1,-sr_bot2,-sr_bot3).
Notes .
The selection metric is raw momentum, the execution stream is volatility-scaled returns. This separation is deliberate. It avoids letting volatility dominate ranking while still enforcing risk parity at the return contribution stage.
If everything rallies together and dispersion collapses, Long Only may behave like a single beta. Delta Neutral is designed to extract cross-sectional momentum with low net beta.
5) Regime filter
A fast EMA(12) vs EMA(21) filter gates exposure.
Long Only active when EMA12 > EMA21. Otherwise the book is set to cash.
Short Only active when EMA12 < EMA21. Otherwise cash.
Delta Neutral is always active.
This prevents taking long momentum entries during obvious local downtrends and vice versa for shorts. When the filter is false, equity is held flat for that bar.
6) Transaction cost modelling
There are two cost touchpoints in the script.
Per-bar drag . When the regime filter is active, the per-bar return is reduced by fee_rate * avgRet inside netRet = avgRet - (fee_rate * avgRet). This models proportional friction relative to traded impact on that bar.
Turnover-linked fee . The script tracks changes in membership of the top and bottom baskets (top1..top3, bot1..bot3). The intent is to charge fees when composition changes. The template counts changes and scales a fee by change count divided by 6 for the six slots.
Use case: increase fee_rate to reflect taker fees and slippage if you rebalance every bar or trade illiquid assets. Reduce it if you rebalance less often or use maker orders.
Practical advice .
If you rebalance daily, start with 5–20 bps round-trip per switch on liquid futures and adjust per venue.
For crypto perp microcaps, stress higher cost assumptions and add slippage buffers.
If you only rotate on lookback boundaries or at signals, use alert-driven rebalances and lower per-bar drag.
7) Backtest metrics and definitions
The script computes a standard set of portfolio statistics once the start date is reached.
Net Profit percent over the full test.
Max Drawdown percent, tracked from running peaks.
Annualized Mean and Stdev using the chosen trading day count.
Variance is the square of annualized stdev.
Sharpe uses daily mean adjusted by risk-free rate and annualized.
Sortino uses downside stdev only.
Omega ratio of sum of gains to sum of losses.
Gain-to-Pain total gains divided by total losses absolute.
CAGR compounded annual growth from start date to now.
Alpha, Beta versus a user-selected benchmark. Beta from covariance of daily returns, Alpha from CAPM.
Skewness of daily returns.
VaR 95 linear-interpolated 5th percentile of daily returns.
CVaR average of the worst 5 percent of daily returns.
Benchmark Buy-and-Hold equity path for comparison.
8) Performance attribution
Cumulative contribution per asset, adjusted for whether it was held long or short and for its volatility multiplier, aggregated across the backtest. You can filter to winners only or show both sides. The panel is sorted by contribution and includes percent labels.
9) Monte Carlo simulation
The panel draws forward equity paths from either a Normal model parameterized by recent mean and stdev, or non-parametric bootstrap of recent daily returns. You control the sample length, number of simulations, forecast horizon, visibility of individual paths, confidence bands, and a reproducible seed.
Normal uses Box-Muller with your seed. Good for quick, smooth envelopes.
Bootstrap resamples realized returns, preserving fat tails and volatility clustering better than a Gaussian assumption.
Bands show 10th, 25th, 75th, 90th percentiles and the path mean.
10) Scatter plot analysis
Four point-cloud modes, each plotting all assets and a star for the current portfolio position, with quadrant guides and labels.
Risk-Return Efficiency . X is risk proxy from leverage, Y is expected return from annualized momentum. The star shows the current book’s composite.
Momentum vs Volatility . Visualizes whether leaders are also high vol, a cue for turnover and cost expectations.
Beta vs Alpha . X is a beta proxy, Y is risk-adjusted excess return proxy. Useful to see if leaders are just beta.
Leverage vs Momentum . X is volMult, Y is momentum. Shows how volatility targeting is redistributing risk.
11) Asset allocation pie chart
Builds a wheel of current allocations.
Long Only, weights are proportional to each long asset’s current volMult and sum to 100 percent.
Short Only, weights show the short book as positive slices that sum to 100 percent.
Delta Neutral, 50 percent long and 50 percent short books, each side leverage-proportional.
Labels can show asset, percent, and current leverage.
12) Inputs and quick presets
Core
Portfolio Strategy . Long Only, Short Only, Delta Neutral.
Initial Capital . For equity scaling in the panel.
Trading Days/Year . 252 for stocks, 365 for crypto.
Target Volatility . Annualized, drives volMult.
Transaction Fees . Per-bar drag and composition change penalty, see the modelling notes above.
Momentum Lookback . Ranking horizon. Shorter is more reactive, longer is steadier.
Start Date . Ensure every symbol has data back to this date to avoid bias.
Benchmark . Used for alpha, beta, and B&H line.
Diagnostics
Metrics, Equity, B&H, Curve labels, Daily return line, Rolling drawdown fill.
Attribution panel. Toggle winners only to focus on what matters.
Monte Carlo mode with Normal or Bootstrap and confidence bands.
Scatter plot type and styling, labels, and portfolio star.
Pie chart and labels for current allocation.
Presets
Crypto Daily, Long Only . Lookback 25, Target Vol 50 percent, Fees 10 bps, Regime filter on, Metrics and Drawdown on. Monte Carlo Bootstrap with Recent 200 bars for bands.
Crypto Daily, Delta Neutral . Lookback 25, Target Vol 50 percent, Fees 15–25 bps, Regime filter always active for this mode. Use Scatter Risk-Return to monitor efficiency and keep the star near upper left quadrants without drifting rightward.
Equities Daily, Long Only . Lookback 60–120, Target Vol 15–20 percent, Fees 5–10 bps, Regime filter on. Use Benchmark SPX and watch Alpha and Beta to keep the book from becoming index beta.
13) Suggested workflow
Universe sanity check . Pick liquid tickers with stable data. Thin assets distort vol estimates and fees.
Check momentum existence . Run on your timeframe. If slope and fit are weak, widen lookback or avoid that asset or timeframe.
Set risk budget . Choose a target volatility that matches your drawdown tolerance. Higher target increases turnover and cost sensitivity.
Pick mode . Long Only for bull regimes, Short Only for sustained downtrends, Delta Neutral for cross-sectional harvesting when index direction is unclear.
Tune lookback . If leaders rotate too often, lengthen it. If entries lag, shorten it.
Validate cost assumptions . Increase fee_rate and stress Monte Carlo. If the edge vanishes with modest friction, refine selection or lengthen rebalance cadence.
Run attribution . Confirm the strategy’s winners align with intuition and not one unstable outlier.
Use alerts . Enable position change, drawdown, volatility breach, regime, momentum shift, and crash alerts to supervise live runs.
Important implementation details mapped to code
Momentum measure . cr = price / price - 1 per symbol for ranking. Simplicity helps avoid overfitting.
Volatility targeting . vol = stdev(log returns, lookback) * sqrt(tradingdays), volMult = clamp(targetVol / vol, 0.1, 5), sr = ret * volMult.
Selection . Extract indices for top1..top3 and bot1..bot3. The arrays rets, scRets, lev_vals, and ticks_arr track momentum, scaled returns, leverage multipliers, and display tickers respectively.
Regime filter . EMA12 vs EMA21 switch determines if the strategy takes risk for Long or Short modes. Delta Neutral ignores the gate.
Equity update . Equity multiplies by 1 + netRet only when the regime was active in the prior bar. Buy-and-hold benchmark is computed separately for comparison.
Tables . Position tables show current top or bottom assets with leverage and weights. Metric table prints all risk and performance figures.
Visualization panels . Attribution, Monte Carlo, scatter, and pie use the last bars to draw overlays that update as the backtest proceeds.
Final notes
Momentum is a portfolio effect. The edge comes from cross-sectional dispersion, adequate risk normalization, and disciplined turnover control, not from a single best asset call.
Volatility targeting stabilizes path but does not fix selection. Use the momentum regression link above to confirm structure exists before you size into it.
Always test higher lag costs and slippage, then recheck metrics, attribution, and Monte Carlo envelopes. If the edge persists under stress, you have something robust.

ICT Sessions Ranges [SwissAlgo]ICT Session Ranges - ICT Liquidity Zones & Market Structure
OVERVIEW
This indicator identifies and visualizes key intraday trading sessions and liquidity zones based on Inner Circle Trader (ICT) methodology (AM, NY Lunch Raid, PM Session, London Raid). It tracks 'higher high' and 'lower low' price levels during specific time periods that may represent areas where market participants have placed orders (liquidity).
PURPOSE
The indicator helps traders observe:
Session-based price ranges during different market hours
Opening range gaps between market close and next day's open
Potential areas where liquidity may be concentrated and trigger price action
SESSIONS TRACKED
1. London Session (02:00-05:00 ET): Tracks price range during early London trading hours
2. AM Session (09:30-12:00 ET): Tracks price range during the morning New York session
3. NY Lunch Session (12:00-13:30 ET): Tracks price range during typical low-volume lunch period
4. PM Session (13:30-16:00 ET): Tracks price range during the afternoon New York session
CALCULATIONS
Session High/Low: The highest high and lowest low recorded during each active session period
Opening Range Gap: Calculated as the difference between the previous day's 16:00 close and the current day's 09:30 open
Gap Mitigation: A gap is considered mitigated when the price reaches 50% of the gap range
All times are based on America/New_York timezone (ET)
BACKGROUND INDICATORS
NY Trading Hours (09:30-16:00 ET): Optional gray background overlay
Asian Session (20:00-23:59 ET): Optional purple background overlay
VISUAL ELEMENTS
Horizontal lines mark session highs and lows
Subtle background boxes highlight each session range
Labels identify each session type
Orange shaded boxes indicate unmitigated opening range gaps
Dotted line at 50% gap level shows mitigation threshold
FEATURES
Toggle visibility for each session independently
Customizable colors for each session type
Automatic removal of mitigated gaps
All drawing objects use transparent backgrounds for chart clarity
ICT CONCEPTS
This tool relates to concepts discussed by Inner Circle Trader regarding liquidity pools, session-based analysis, and gap theory. The indicator assumes that session highs and lows may represent areas where liquidity is concentrated, and that opening range gaps may attract price until mitigated.
USAGE NOTES
Best used on intraday timeframes (1-15 minute charts)
All sessions are calculated based on actual price movement during specified time periods
Historical session data is preserved as new sessions develop
Gap detection only triggers at 09:30 ET market open
DISCLAIMER
This indicator is for educational and informational purposes only. It displays historical price levels and time-based calculations. Past performance of price levels is not indicative of future results. The identification of "liquidity zones" is a theoretical concept and does not guarantee that orders exist at these levels or that prices will react to them. Trading involves substantial risk of loss. Users should conduct their own analysis and risk assessment before making any trading decisions.
TIME ZONE
Set your timezone to: America/New_York (UTC-5)

DTC - Profile W1: Watchlist Scanner🚀 DTC - Profile W1: 12-Symbol Watchlist Scanner
Stop flipping through dozens of charts!
This is a complete multi-symbol dashboard and scanner that runs the full, complex logic of the 'Alt Coin Dynamic Trend Core v2' (DTC) system on 12 different symbols at once.
It is designed to be your primary dashboard for monitoring an entire watchlist of altcoins, helping you spot new trends and confirmed trade signals at a single glance.
✨ Key Features
12 Configurable Tickers: Monitor your entire watchlist from one chart. All 12 ticker inputs can be changed in the settings.
Configurable Timeframe: Run your analysis on any timeframe. Simply change the "Analysis Timeframe" in the settings (e.g., "60" for 1H, "240" for 4H, "D" for Daily).
Advanced Trend Engine: Uses the SAMA-based 'Dynamic Trend Core' logic as its foundation.
Multi-Layer Filtering: Signals are not just simple crossovers. They are confirmed by a powerful suite of filters, including:
Market Cycle (Halving & Mayer Multiple)
Market Regime (TOTAL Market Cap filter)
Momentum (NMS & Cyclic RSI)
Trend Strength (ADX)
Volume & Volatility (Consolidation Filter)
Delta Pressure (Wick Analysis)
Automation-Ready Alerts: Fires JSON-formatted alerts perfect for 3Commas, webhooks, or any other trading bot.
100% Non-Repainting: All calculations are performed on confirmed, closed-bar data, so signals are stable and reliable.
📊 How to Read the Dynamic Table
The table is designed for quick, "at-a-glance" decisions.
1. TOKEN Column
Your chosen ticker.
2. TREND Column
Text: Shows the current trend state with an emoji:
🚀 BULL
💣 BEAR
🤷 CHOP
Background (Heatmap): This is the most important feature. The color is a gradient that shows the strength of the trend.
A weak, new bull trend will be dark green.
A strong, accelerating bull trend will be bright green.
A weak bear trend will be dark red.
A strong, collapsing bear trend will be bright red.
3. SIGNAL Column
This column only lights up when a new signal fires.
▲ LONG: A new long signal has just been confirmed on this bar.
▼ SHORT: A new short signal has just been confirmed on this bar.
—: The trend is established, and we are waiting for the next signal.
⚙️ How to Use
Add the script to your chart.
Open the Script Settings.
Under "Watchlist Configuration," change the 12 tickers to your favorite symbols. Make sure to include the exchange prefix (e.g., BYBIT:SOLUSDT, BINANCE:BTCUSDT).
Set your desired "Analysis Timeframe."
Monitor the dashboard for new signals.
For Automation:
Create a new alert.
Select the script (DTC-W1) as the condition.
Choose "Any alert() function call."
In the "Message" box, use the {{plot_0}} placeholder to capture the JSON alert message.
Disclaimer: This script is for informational and educational purposes only. All trading involves risk. Past performance is not indicative of future results.
Author: Andrew_S_1981 Framework & Refactoring by Gemini

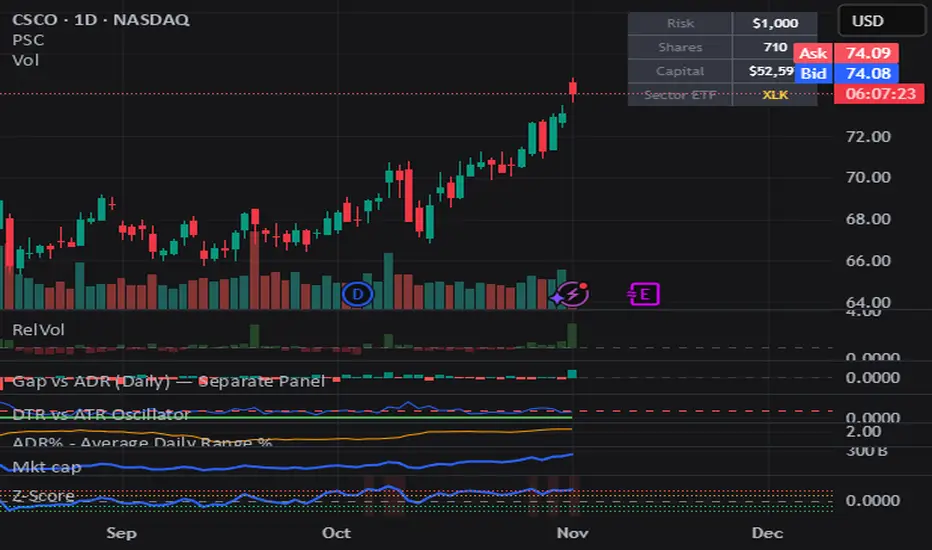
Position Sizer (% of Acct & Shares Req)
This indicator calculates % position size and share quantity required based on total capital and user-defined risk percentages
This indicator differs from the Shares Qty indicator in that it is based on %'s rather than a user-defined, fixed dollar amount to risk (for those who prefer to calculate risk in this manner instead)
Tracks real-time Low of Day (LoD) during regular trading hours (RTH) for accurate stop placement
Current price as well as output rows 2 and 3 can be toggled on/off, per preference
Allows stop loss selection between LoD, Low of Week (LoW), and Prior Day Low (PDL)
Keeps data updating intraday to reflect changing LoD and price conditions
Provides a second “Stop Loss Compare” dropdown to compare two stop methods side by side
Displays all results in a dynamic on-chart table that updates with live prices
Shows capital amount, stop type, stop price, and share counts for three risk levels
=========
Risk rows displayed as: Risk of Cap Amt: ,
=========
Disclaimer:
This indicator is for educational and informational purposes only. It should not be used as the sole basis for trading decisions. Always combine with other forms of analysis, proper risk management techniques, and consider your individual trading plan and risk tolerance. All calculations and outputs are provided as-is, and it is your responsibility to verify their accuracy before making any trading decisions.

Aquantprice: Institutional Structure MatrixSETUP GUIDE
Open TradingView
Go to Indicators
Search: Aquantprice: Institutional Structure Matrix
Click Add to Chart
Customize:
Min Buy = 10, Min Sell = 7
Show only PP, R1, S1, TC, BC
Set Decimals = 5 (Forex) or 8 (Crypto)
USE CASES & TRADING STRATEGIES
1. CPR Confluence Trading (Most Popular)
Rule: Enter when ≥3 timeframes show Buy ≥10/15 or Sell ≥7/13
text Example:
Daily: 12/15 Buy
Weekly: 11/15 Buy
Monthly: 10/15 Buy
→ **STRONG LONG BIAS**
Enter on pullback to nearest **S1 or L3**
2. Hot Zone Scalping (Forex & Indices)
Rule: Trade only when price is in Hot Zone (closest 2 levels)
text Hot: S1-PP → Expect bounce or breakout
Action:
- Buy at S1 if Buy Count ↑
- Sell at PP if Sell Count ↑
3. Institutional Reversal Setup
Rule: Price at H3/L3 + Reversal Condition
text Scenario:
Price touches **Monthly L3**
L3 in **Hot Zone**
Buy Count = 13/15
→ **High-Probability Reversal Long**
4. CPR Width Filter (Avoid Choppy Markets)
Rule: Trade only if CPR Label = "Strong Trend"
text CPR Size < 0.25 → Trending
CPR Size > 0.75 → Sideways (Avoid)
5. Multi-Timeframe Bias Dashboard
Use "Buy" and "Sell" columns as a sentiment meter
TimeframeBuySellBiasDaily123BullishWeekly89BearishMonthly112Bullish
→ Wait for alignment before entering
HOW TO READ THE TABLE
Column Meaning Time frame D, W, M, 3M, 6M, 12MOpen Price Current session open PP, TC, BC, etc. Pivot levels (color-coded if in Hot Zone) Buy X/15 conditions met (≥10 = Strong Buy)Sell X/13 conditions met (≥7 = Strong Sell)CPR Size Histogram + Label (Trend vs Range)Zone Hot: PP-S1, Med: S2-L3, etc. + PP Distance
PRO TIPS
Best on 5M–1H charts for entries
Use with volume or order flow for confirmation
Set alerts on Buy ≥12/15 or Sell ≥10/13
Hide unused levels to reduce clutter
Combine with AQuantPrice Dashboard (Small TF) for full system
IDEAL MARKETS
Forex (EURUSD, GBPUSD, USDJPY)
Indices (NAS100, SPX500, DAX)
Crypto (BTC, ETH – use 6–8 decimals)
Commodities (Gold, Oil)
🚀 **NEW INDICATOR ALERT**
**Aquantprice: Institutional Structure Matrix**
The **ALL-IN-ONE CPR Dashboard** used by smart money traders.
✅ **6 Timeframes in 1 Table** (Daily → Yearly)
✅ **15 Buy + 13 Sell Conditions** (Institutional Logic)
✅ **Hot Zones, CPR Width, PP Distance**
✅ **Fully Customizable – Show/Hide Any Level**
✅ **Real-Time Zone Detection** (Hot, Med, Low)
✅ **Precision up to 8 Decimals**
**No more switching charts. No more confusion.**
See **where institutions are positioned** — instantly.
👉 **Add to Chart Now**: Search **"Aquantprice: Institutional Structure Matrix"**
🔥 **Free Access | Pro-Level Insights**
*By AQuant – Trusted by 10,000+ Traders*
#CPR #PivotTrading #SmartMoney #TradingView
FINAL TAGLINE
"See What Institutions See — Before They Move."
Aquantprice: Institutional Structure Matrix
Your Edge. One Dashboard.

AudenFX Futures Risk Management & CalculatorAudenFX Futures Risk Management (FRM) is a specialized utility indicator designed to help Futures traders calculate position size, risk exposure, and reward potential in a structured and consistent manner.
Unlike signal or entry indicators, this tool focuses entirely on capital protection and risk allocation, supporting traders in making more deliberate and well-planned decisions.
This indicator is particularly made for Micro and Mini Futures markets, where tick values vary across instruments, and miscalculation of position size can significantly affect overall account performance. FRM removes guesswork by using accurate, contract-specific tick values built directly into the calculation.
What Makes This Indicator Different
Most position sizing or risk calculators available publicly:
Are designed mainly for Forex / Pips, not Tick-valued Futures
Require manual tick value input, which can lead to calculation errors
Do not account for the difference between theoretical vs. executable contract sizing
Or only display formulas, instead of practical contract size output
AudenFX FRM addresses these limitations by:
Automatically applying correct tick value for each supported Futures contract
Using Stop Loss in ticks, matching actual Futures market structure
Providing rounded contract size that can be realistically executed (no decimals)
Showing both expected and actual risk after rounding, for transparency
Presenting data in a clear, on-chart table without cluttering price action
This helps minimize position size error and ensures risk is intentional, not accidental.
Key Features
Contract Support Works with Micro and Mini Futures contracts such as: MES, MNQ, MGC, SIL, MYM, ES, NQ, GC, SI, YM, RTY, M2K
Risk-Based Position Sizing Calculates trade size based on % of account equity or user-defined risk tolerance
Tick-Based SL Input Accepts Stop Loss in ticks, consistent with Futures charting and DOM placement
Accurate Tick Value Mapping Built-in tick value per contract — no manual lookup or conversion required
Contract Size Output Returns rounded number of contracts suitable for actual order execution
Actual Risk Transparency Displays the real dollar risk after rounding, preventing under/over exposure
Reward Estimation Calculates potential reward based on chosen Reward:Risk ratio (RR)
Customizable Table Display Adjustable position & size to match any chart layout preference
Intended Use
This indicator is suitable for:
Traders who prioritize risk management and capital preservation
Traders refining sizing consistency across volatile market environments
Manual, discretionary, price action, or system-based Futures traders
This tool does not generate buy/sell signals, define market direction, or promise trade outcomes.
It is meant to support a planned, methodical approach to risk, which can be applied in any strategy.
Important Disclaimer
This indicator is provided for educational and informational purposes only.
It does not guarantee profitability, prevent loss, or provide trading instructions or recommendations.
Users are fully responsible for their own trading decisions and financial outcomes.

OverBought & OverSold [SwissAlgo]OverBought & OverSold
Statistical analysis of momentum extremes
----------------------------------------------------------
Purpose
This indicator was built to answer three questions:
Is the current price move statistically extreme? - By comparing current momentum to historical distribution
What is the current market regime? - By combining trend position and momentum direction
Is momentum accelerating or decelerating? - By analyzing weekly momentum shifts
----------------------------------------------------------
What You Can Do With This Indicator
Identify Statistical Extremes
See when price momentum seems to have reached levels that historically preceded reversals
Compare the current Rate of Change to its historical mean and standard deviation
Spot when readings exceed ±1σ, ±2σ, or higher thresholds
Monitor Market Regime/State
Track whether the market seems to be in BULL, WEAK BULL, BEAR, or WEAK BEAR state
Observe potential transitions between regimes as they occur
Understand the relationship between price position and momentum
Assess Momentum Quality
Distinguish between potentially accelerating momentum (lime/red bars) and decelerating momentum (green/maroon bars)
Watch for possible momentum deterioration within established trends
Track weekly momentum patterns that filter out daily noise
Measure Distance from Trend
Monitor how far the price is from its long-term moving average (EMA 350)
Identify when price approaches trend support/resistance
Contextualize current position relative to historical distance patterns
----------------------------------------------------------
Overview
This indicator calculates a volume-weighted Rate of Change (ROC) and displays it with statistical Z-Score bands. It combines ROC analysis with market regime detection using weekly MACD and EMA positioning.
Key Features
Volume-weighted ROC calculation with 5-bar smoothing
Dynamic Z-Score bands (±0.5σ to ±6σ)
Four-state market regime classification
Weekly Stochastic RSI-based histogram coloring
Visual markers for extreme readings
Information table with current statistics
Calculations
Volume-Weighted ROC
The indicator compares two 5-bar volume-weighted average prices separated by the ROC
Length period:
Recent VWAP = Σ(Price × Volume) / Σ(Volume) for last 5 bars
Past VWAP = Σ(Price × Volume) / Σ(Volume) for 5 bars at lookback
ROC = ((Recent VWAP - Past VWAP) / Past VWAP) × 100
Default ROC Length: 30 periods
Why volume-weighted:
Single price points can be affected by temporary spikes
Volume weighting emphasizes legitimate price moves
5-bar averaging reduces single-bar noise
Z-Score Bands
The indicator maintains separate statistical distributions for positive and negative ROC values:
For positive ROC values:
Calculates mean and standard deviation of all positive ROC readings
Plots bands at +0.5σ, +1σ, +2σ, +3σ, +4σ, +5σ, +6σ above the mean
For negative ROC values:
Calculates mean and standard deviation of all negative ROC readings
Plots bands at -0.5σ, -1σ, -2σ, -3σ, -4σ, -5σ, -6σ below the mean
Z-Score formula:
If ROC > 0: Z = (ROC - Positive Mean) / Positive Std Dev
If ROC < 0: Z = (ROC - Negative Mean) / Negative Std Dev
Why separate distributions:
Upward and downward momentum often have different statistical properties
Separate analysis provides more accurate extreme identification
Each side maintains its own mean and volatility characteristics
The ±1σ bands use thicker lines (linewidth=2) as these levels are most frequently tested.
Market Regime States
Four states based on weekly MACD (10, 24, 8) and EMA 350:
BULL
Conditions: Price > EMA 350, Weekly MACD > 0, MACD > Signal, ROC histogram lime
Background: Lime (85% transparency)
Interpretation: Price above long-term trend with accelerating momentum
WEAK BULL
Conditions: Price > EMA 350 AND (MACD < Signal OR ROC histogram green)
Background: Green (95% transparency)
Interpretation: Price above trend, but momentum seems to be decelerating
BEAR
Conditions: Price < EMA 350, Weekly MACD < 0, MACD < Signal, ROC histogram red
Background: Red (85% transparency)
Interpretation: Price below long-term trend with accelerating downward momentum
WEAK BEAR
Conditions: Price < EMA 350 AND (MACD > Signal OR ROC histogram maroon)
Background: Maroon (95% transparency)
Interpretation: Price below trend, but downward momentum seems to be decelerating
NEUTRAL
Conditions: None of the above met
Background: Gray (95% transparency)
Interpretation: Transitional state between regimes
Why weekly MACD:
Filters daily volatility and noise
Provides more stable regime classification
Reduces false regime switches
Histogram Colors
Colors determined by Weekly Stochastic RSI (14, 14, 3, 3):
Lime: ROC > 0 and K > D (rising positive momentum)
Green: ROC > 0 and K < D (falling positive momentum)
Red: ROC < 0 and K < D (falling negative momentum)
Maroon: ROC < 0 and K > D (rising negative momentum)
Why weekly Stochastic RSI:
Shows momentum direction independent of absolute level
Weekly timeframe provides stable readings
K/D crossover indicates momentum shifts
Visual Markers
Red arrows (↓): Display when ROC ≥ +1σ (overbought zone)
Lime arrows (↑): Display when ROC ≤ -0.5σ (oversold zone)
These markers highlight when readings reach statistical extremes.
Information Table
Located at the top-right, displays four rows:
Row 1 - Market State
Shows current regime text (BULL/WEAK BULL/BEAR/WEAK BEAR/NEUTRAL)
Color matches regime state
Row 2 - Current Z-Score
Shows Z-Score value with 2 decimal places
Lime when Z ≤ -0.5 (statistically oversold)
Red when Z ≥ +1 (statistically overbought)
White for values between -0.5 and +1 (normal range)
Adds bullet (●) for extreme values
Row 3 - Price ROC %
Shows current ROC percentage
Lime when positive
Red when negative
Row 4 - Distance % EMA
Shows percentage distance from EMA 350
Calculates Z-score of distance
Red with ● when close to EMA in bull market (|Z| < 0.5)
Lime with ● when close to EMA in bear market (|Z| < 0.5)
Standard colors otherwise (lime when above EMA, red when below)
Why distance matters:
A price approaching EMA 350 in a bull market can signal a support test
Price near EMA 350 in a bear market can signal a resistance test
Z-score of distance shows if the current proximity is statistically unusual
----------------------------------------------------------
Settings
ROC Length (Integer, default: 30, minimum: 1)
Number of periods for ROC lookback
Higher values = slower response, smoother
Lower values = faster response, more sensitive
Source (Source, default: close)
Price data input for calculations
Can use close, open, high, low, hl2, hlc3, ohlc4
Show Info Table (Boolean, default: true)
Toggle table visibility
----------------------------------------------------------
Technical Details
Uses lookahead=barmerge.lookahead_off for all request.security() calls
Accumulates all historical ROC values in arrays for Z-Score calculation
Weekly timeframe data retrieved via request.security() on "1W" resolution
EMA length hardcoded to 350 periods
All plots use Pine Script v6 syntax
Data Requirements
Minimum bars required: ROC Length + 5 bars
Works on any timeframe
Applicable to any instrument with volume data
Historical data used: All available bars on the chart
Display Elements
Plots:
ROC histogram (plotcandle format)
Zero line (horizontal line)
14 standard deviation lines (7 positive, 7 negative)
13 filled regions between bands
14 sigma labels (displayed on last bar only)
Extreme zone markers (arrows)
Color Scheme:
Positive bands: Lime with varying transparency
Negative bands: Red with varying transparency
Fills: Green (positive) and Red (negative) with high transparency
Bands beyond 3σ use increased transparency (85%, 90%, 93%)
Visual Hierarchy
±1σ bands: Thicker lines (most important levels)
±0.5σ to ±3σ: Standard visibility
±4σ to ±6σ: Faded (visible only during extreme events)
Notes
This is an oscillator-type indicator (overlay=false)
Displays in a separate pane below the price chart
Does not generate automatic buy/sell signals
Does not include alert conditions
Does not repaint (all calculations use confirmed data)
Limitations
Requires sufficient historical data for meaningful statistics
Z-Score bands recalculate as new data accumulates
Market regime requires weekly MACD calculation (may show neutral on insufficient data)
Volume-weighting requires volume data availability
EMA 350 is fixed (not adjustable via inputs)
Statistical extremes do not guarantee reversals
Past distribution patterns do not predict future behavior
----------------------------------------------------------
Disclaimer
Educational Purpose Only
This indicator is provided for educational and informational purposes only. It is a technical analysis tool that displays statistical calculations and historical data patterns.
Not Financial Advice
This indicator does not provide financial, investment, trading, or any other type of professional advice. All content and calculations are for informational purposes only and should not be construed as a recommendation to buy, sell, or hold any security or financial instrument.
No Guarantee of Results
Past performance and historical statistical patterns do not guarantee future results. Markets are inherently unpredictable, and statistical analysis cannot predict future price movements with certainty. The appearance of statistical extremes does not ensure that reversals will occur.
User Responsibility
Users of this indicator are solely responsible for their own trading and investment decisions. You should conduct your own research and due diligence and consult with qualified financial professionals before making any investment decisions.
Risk Warning
Trading and investing in financial markets involves substantial risk of loss. You should only trade with capital you can afford to lose. The use of technical indicators does not eliminate market risk.
No Warranty
This indicator is provided "as is" without warranty of any kind, either expressed or implied, including but not limited to warranties of accuracy, reliability, or fitness for a particular purpose. The author makes no guarantees regarding the accuracy of calculations or the absence of errors.
Limitation of Liability
The author and publisher of this indicator shall not be held liable for any losses, damages, or claims arising from the use or inability to use this indicator, including but not limited to trading losses, lost profits, or any other financial losses.
Data Accuracy
While efforts have been made to ensure calculation accuracy, users should independently verify all outputs. The indicator relies on data provided by TradingView, and the author is not responsible for data feed errors or interruptions.
User Agreement
By using this indicator, you acknowledge that you have read, understood, and agree to this disclaimer. If you do not agree with any part of this disclaimer, you should not use this indicator.

Position Sizer (Share Qty)
This indicator enables fast & accurate position sizing for traders using (user defined) fixed dollar risk, eliminating the need for manual calculations and supporting disciplined risk management directly on the chart
Calculates precise share quantity for fixed-risk trades using the formula Shares = Risk Amount / (Current Price – Stop Price), rounded to the nearest whole share, updating in real time on every bar
Offers two dynamic stop-loss options: Low of Day (LoD) — tracked only during Regular Trading Hours (9:30 AM – 4:00 PM ET) with automatic daily reset — or Low of Week (LoW) via weekly timeframe data
Displays all critical trade data in a clean, customizable on-screen table showing: Risk Amount, Stop Loss type (LoD/LoW), Stop Price, and calculated Shares Qty
Allows full table placement control with four corner positions with optional Top Offset and Bottom Offset (0–20 blank rows each) to prevent overlap with price action or other indicators
Provides complete visual styling control for header text/background, value text/background, and share quantity text/background
Ensures efficient rendering by recreating the table only when position, row count, or layout changes, deleting the prior instance to avoid flicker or memory issues
Handles edge cases safely: shows 0 shares if stop is 'na' or above current price, and initializes LoD only on the first RTH bar of each session
For use on equities only (table will not display on futures instruments)
--
Future improvements:
Visual Stop Loss line for either LoD or LoW
Functionality and toggle to include Extended hours (PM /AH) for LoD stop pricing

Risk & Position DashboardRisk & Position Dashboard
Overview
The Risk & Position Dashboard is a comprehensive trading tool designed to help traders calculate optimal position sizes, manage risk, and visualize potential profit/loss scenarios before entering trades. This indicator provides real-time calculations for position sizing based on account size, risk percentage, and stop-loss levels, while displaying multiple take-profit targets with customizable risk-reward ratios.
Key Features
Position Sizing & Risk Management:
Automatic position size calculation based on account size and risk percentage
Support for leveraged trading with maximum leverage limits
Fractional shares support for brokers that allow partial share trading
Real-time fee calculation including entry, stop-loss, and take-profit fees
Break-even price calculation including trading fees
Multi-Target Profit Management:
Support for up to 3 take-profit levels with individual portion allocations
Customizable risk-reward ratios for each take-profit target
Visual profit/loss zones displayed as colored boxes on the chart
Individual profit calculations for each take-profit level
Visual Dashboard:
Clean, customizable table display showing all key metrics
Configurable label positioning and styling options
Real-time tracking of whether stop-loss or take-profit levels have been reached
Color-coded visual zones for easy identification of risk and reward areas
Advanced Configuration:
Comprehensive input validation and error handling
Support for different chart timeframes and symbols
Customizable colors, fonts, and display options
Hide/show individual data fields for personalized dashboard views
How to Use
Set Account Parameters: Configure your account size, maximum risk percentage per trade, and trading fees in the "Account Settings" section.
Define Trade Setup: Use the "Entry" time picker to select your entry point on the chart, then input your entry price and stop-loss level.
Configure Take Profits: Set your desired risk-reward ratios and portion allocations for each take-profit level. The script supports 1-3 take-profit targets.
Analyze Results: The dashboard will automatically calculate and display position size, number of shares, potential profits/losses, fees, and break-even levels.
Visual Confirmation: Colored boxes on the chart show profit zones (green) and loss zones (red), with lines extending to current price levels.
Reset Entry and SL:
You can easily reset the entry and stop-loss by clicking the "Reset points..." button from the script's "More" menu.
This is useful if you want to quickly clear your current trade setup and start fresh without manually adjusting the points on the chart.
Calculations
The script performs sophisticated calculations including:
Position size based on risk amount and price difference between entry and stop-loss
Leverage requirements and position amount calculations
Fee-adjusted risk-reward ratios for realistic profit expectations
Break-even price including all trading costs
Individual profit calculations for partial position closures
Detailed Take-Profit Calculation Formula:
The take-profit prices are calculated using the following mathematical formula:
// Core variables:
// risk_amount = account_size * (risk_percentage / 100)
// total_risk_per_share = |entry_price - sl_price| + (entry_price * fee%) + (sl_price * fee%)
// shares = risk_amount / total_risk_per_share
// direction_factor = 1 for long positions, -1 for short positions
// Take-profit calculation:
net_win = total_risk_per_share * shares * RR_ratio
tp_price = (net_win + (direction_factor * entry_price * shares) + (entry_price * fee% * shares)) / (direction_factor * shares - fee% * shares)
Step-by-step example for a long position (based on screenshot):
Account Size: 2,000 USDT, Risk: 2% = 40 USDT
Entry: 102,062.9 USDT, Stop Loss: 102,178.4 USDT, Fee: 0.06%
Risk per share: |102,062.9 - 102,178.4| + (102,062.9 × 0.0006) + (102,178.4 × 0.0006) = 115.5 + 61.24 + 61.31 = 238.05 USDT
Shares: 40 ÷ 238.05 = 0.168 shares (rounded to 0.17 in display)
Position Size: 0.17 × 102,062.9 = 17,350.69 USDT
Position Amount (with 9x leverage): 17,350.69 ÷ 9 = 1,927.85 USDT
For 2:1 RR: Net win = 238.05 × 0.17 × 2 = 80.94 USDT
TP1 price = (80.94 + (1 × 102,062.9 × 0.17) + (102,062.9 × 0.0006 × 0.17)) ÷ (1 × 0.17 - 0.0006 × 0.17) = 101,464.7 USDT
For 3:1 RR: TP2 price = 101,226.7 USDT (following same formula with RR=3)
This ensures that after accounting for all fees, the actual risk-reward ratio matches the specified target ratio.
Risk Management Features
Maximum Trade Amount: Optional setting to limit position size regardless of account size
Leverage Limits: Built-in maximum leverage protection
Fee Integration: All calculations include realistic trading fees for accurate expectations
Validation: Automatic checking that take-profit portions sum to 100%
Historical Tracking: Visual indication when stop-loss or take-profit levels are reached (within last 5000 bars)
Understanding Max Trade Amount - Multiple Simultaneous Trades:
The "Max Trade Amount" feature is designed for traders who want to open multiple positions simultaneously while maintaining proper risk management. Here's how it works:
Key Concept:
- Risk percentage (2%) always applies to your full Account Size
- Max Trade Amount limits the capital allocated per individual trade
- This allows multiple trades with full risk on each trade
Example from Screenshot:
Account Size: 2,000 USDT
Max Trade Amount: 500 USDT
Risk per Trade: 2% × 2,000 = 40 USDT per trade
Stop Loss Distance: 0.11% from entry
Result: Position Size = 17,350.69 USDT with 35x leverage
Total Risk (including fees): 40.46 USDT
Multiple Trades Strategy:
With this setup, you can open:
Trade 1: 40 USDT risk, 495.73 USDT position amount (35x leverage)
Trade 2: 40 USDT risk, 495.73 USDT position amount (35x leverage)
Trade 3: 40 USDT risk, 495.73 USDT position amount (35x leverage)
Trade 4: 40 USDT risk, 495.73 USDT position amount (35x leverage)
Total Portfolio Exposure:
- 4 simultaneous trades = 4 × 495.73 = 1,982.92 USDT position amount
- Total risk exposure = 4 × 40 = 160 USDT (8% of account)

Simulated Fear & Greed (CNN-calibrated v2)🧭 Fear & Greed Index — TradingView Version (Simulated CNN Model)
🔍 Purpose
The Fear & Greed Index is a sentiment indicator that quantifies market emotion on a scale from 0 to 100, where:
0 represents Extreme Fear (capitulation, oversold conditions), and
100 represents Extreme Greed (euphoria, overbought conditions).
It helps traders assess whether the market is driven by fear (risk aversion) or greed (risk appetite) — giving a high-level view of potential turning points in market sentiment.
⚙️ How It Works in TradingView
Because TradingView cannot directly access CNN’s or alternative external sentiment feeds, this indicator simulates the Fear & Greed Index by analyzing in-chart technical data that reflect investor psychology.
It uses a multi-factor model, converting price and volume signals into a composite sentiment score.
🧩 Components Used (Simulated Metrics)
Category Metric Emotional Interpretation
Volatility ATR (Average True Range) High ATR = Fear, Low ATR = Greed
Momentum RSI + MACD Histogram Rising momentum = Greed, Falling = Fear
Volume Activity Volume Z-Score High positive deviation = Greed, Low = Fear
Trend Context SMA Regime Bias (50/200) Downtrend adds Fear penalty, Uptrend supports Greed
These elements are normalized into a 0–100 scale using percentile ranks (like statistical scoring) and then combined using user-adjustable weights.
⚖️ CNN-Style Calibration
The script follows CNN’s five sentiment bands for clarity:
Range Zone Colour Description
0–25 Extreme Fear 🔴 Red Panic, forced selling, capitulation risk
25–45 Fear 🟠 Orange Uncertainty, hesitation, early accumulation phase
45–55 Neutral ⚪ Gray Balanced sentiment, indecision
55–75 Greed 🟢 Light Green Optimism, trend continuation
75–100 Extreme Greed 💚 Bright Green Euphoria, risk of reversal
This structure aligns visually with CNN’s public gauge, making it easy to interpret.

Dual Harmonic-based AHR DCA (Default :BTC-ETH)A panel indicator designed for dual-asset BTC/ETH DCA (Dollar Cost Averaging) decisions.
It is inspired by the Chinese community indicator "AHR999" proposed by “Jiushen”.
How to use:
Lower HM-based AHR → cheaper (potential buy zone).
Higher HM-based AHR → more expensive (potential risk zone).
Higher than Risk Threshold → consider to sell, but not suitable for DCA.
When both AHR lines are below the Risk threshold → buy the cheaper one (or split if similar).
If one AHR is above Risk → buy the other asset.
If both are above Risk → simulation shows “STOP (both risk)”.
Not limited to BTC/ETH — you can freely change symbols in the input panel
to build any dual-asset DCA pair you want (e.g., BTC/BNB, ETH/SOL, etc.).
What you’ll see:
Two lines: AHR BTC (HM) and AHR ETH (HM)
Two dashed lines: OppThreshold (green) and RiskThreshold (red)
Colored fill showing which asset is cheaper (BTC or ETH)
Buy markers:
- B = Buy BTC
- E = Buy ETH
- D = Dual (split budget)
Top-right table: prices, AHRs, thresholds, qOpp/qRisk%, simulation, P&L
Labels showing last-bar AHR values
Core idea:
Use an AHR based on Harmonic Moving Average (HM) — a ratio that measures how “cheap or expensive” price is relative to both its short-term mean and long-term trend.
The original AHR999 used SMA and was designed for BTC only.
This indicator extends it with cross-exchange percentile mapping, allowing the empirical “opportunity/risk” zones of the AHR999 (on Bitstamp) to adapt automatically to the current market pair.
The indicator derives two adaptive thresholds:
OppThreshold – opportunity zone
RiskThreshold – risk zone
These thresholds are compared with the current HM-based AHR of BTC and ETH to decide which asset is cheaper, and whether it is good to DCA or not, or considering to sell(When it in risk area).
This version uses
Display base: Binance (default: perpetual) with HM-based AHR
Percentile base: Bitstamp spot SMA-AHR (complete, stable history)
Rolling window: 2920 daily bars (~8 years) for percentile tracking
Concept summary
AHR measures the ratio of price to its long-term regression and short-term mean.
HM replaces SMA to better reflect equal-fiat-cost DCA behavior.
Cross-exchange percentile mapping (Bitstamp → Binance) keeps thresholds consistent with the original AHR999 interpretation.
Recommended settings (1D):
DCA length (harmonic): 200
Log-regression lookback: 1825 (≈5 years)
Rolling window: 2920 (≈8 years)
Reference thresholds: 0.45 / 1.20 (AHR999 empirical priors)
Tie split tolerance (ΔAHR): 0.05
Daily budget: 15 USDT (simulation)
All display options can be toggled: table, markers, labels, etc.
Notes:
When the rolling window is filled (2920 bars by default), thresholds are first calculated and then visually backfilled as left-extended lines.
The “buy markers” and “decision table” are light simulations without fees or funding costs — for rhythm and relative analysis, not backtesting.

Earnings CountdownAdd to a chart to show a text box with how long to next earnings.
Being updated to add functionality from original open source Pine script

Position Size CalculatorPosition Size Calculator (PSC) helps size trades by dollar risk.
Set your Risk Amount ($).
Choose risk unit: ADR (avg high–low) or ATR (Wilder’s, gap-aware).
Shares = round(Risk $ / risk_unit).
Capital = Shares × current close.
Small table shows Risk $, Shares, Capital, and a mapped sector ETF (e.g., XLK, XLE).
Use ATR for gap-aware sizing; ADR for a simpler range. Adjust period to fit your stop style (shorter = more responsive). PSC is display-only (no orders), works on any symbol/timeframe, and updates on the latest bar.
ATR Position SizerFound the substack from Ryan Wright (raen prop trading) which has amazing insights into the real prop trading world.
In his post Your Trading Edge Isn't Your Setup . It's Your Knowledge he shared a few interesting nuggets of knowledge.
Especially the part about Risk according to the 20-day ATR caught my eye, so i reconstructed a version of that formula directly for Tradingview. It works with ES (MES), NQ (MNQ), GC (MGC), YM and can be extended.
Additionally I implemented a function that tracks the chart ATR (automatically on the chosen time frame) on a defined period. This can of course be disable.
Hope it helps

Trailing 12M % Gain/Lossthis script shows profit or loss for training 12 months, works only on daily time frame


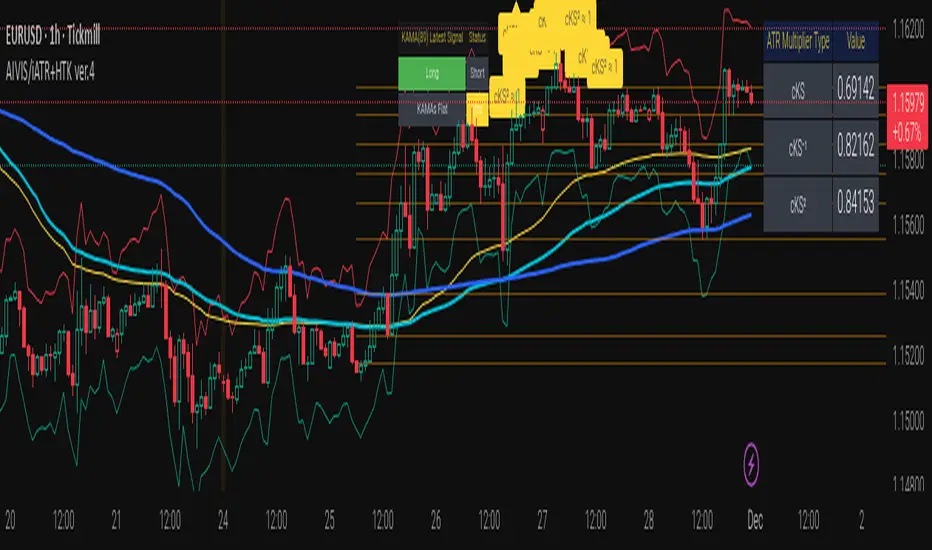
Integrated Volatility Intelligence System (IVIS) AutoKVolMind™ AutoK — Integrated Volatility Intelligence System (IVIS)
IVIS AutoK
Author: © lfu
Public Description (for publication)
VolMind™ AutoK represents an institutional-grade open-source framework for adaptive volatility intelligence and probabilistic trade management.
This system fuses Kalman-inspired KAMA smoothing, CVD dynamics, Auto K-Means clustering, entropy-based regime analysis, and a Kolmogorov–Smirnov market normality test into a single modular platform.
Key Capabilities:
Adaptive ATR Stop Bands dynamically scale with volatility, entropy, and cluster variance.
Auto KMeans Intelligence automatically selects the optimal cluster count for price structure recognition (3–10 clusters).
Entropy Module quantifies structural uncertainty and information decay within price movement.
KS-Test Integration identifies non-normal distributions, signaling regime divergence and volatility inflection.
CVD Dynamics reveal real-time directional bias via cumulative volume delta.
MSI Composite Signal fuses multi-source indicators (ATR, CVD, entropy, clusters) to model market stress and adaptive risk.
Designed for forward-looking quant traders, IVIS serves as a volatility intelligence backbone for portfolio automation, volatility forecasting, and adaptive stop-loss scaling.
Fully open-source for research and applied strategy development. Not a financial advice. DYOR.
Trade Journal ProTrade Journal Pro
A powerful, visual trading journal that enforces discipline with real-time feedback, reflective prompts, and strict risk limits — all in one clean overlay box.
Jesus is King — trade with wisdom, not emotion.
FEATURES
• AUTO-CALCULATED DAILY TRADES
→ `Trades Today = Wins + Losses + Breakevens` (no manual input needed)
• 4 ENFORCED RISK LIMITS
1. Max Trades Per Day
2. Max Risk Rule Violations
3. Max Consecutive Losses (tilt protection)
4. Max Total Losses Allowed (lifetime/session cap)
• SMART VISUAL FEEDBACK
• GREEN BOX = You hit a limit exactly → “WELL DONE!”
• RED BOX = Breached any limit → “STOP & REFLECT” + ALERT
• Dark = Normal (under all limits)
• REFLECTIVE PROMPTS (Customizable)
1. Why this setup?
2. What was my emotional state?
3. Did I follow my plan?
• LIVE ADVICE ENGINE
→ Win: “Great execution! Log what worked.”
→ Loss: “Loss = tuition. What did you learn?”
→ Breakeven: “Review entry/exit precision.”
• DAILY REMINDER
→ Always visible: “Trade the plan, not the emotion.”
• FULLY CUSTOMIZABLE
• Font size (Tiny → Huge)
• Box position (bars to the right)
• Toggle: Metrics / Prompts / Advice
• Custom colors, messages, limits
• ALERTS
• Breach any limit → Immediate alert
• Hit limit exactly → Discipline win notification
HOW TO USE
1. After each closed trade:
→ Update Wins, Losses, or Breakevens
→ Update Consecutive Losses (reset to 0 on win/BE)
→ Increment Risk Violations if you broke a rule
2. Answer the 3 prompts in your journal
3. Let the box guide your behavior:
• GREEN = Celebrate discipline
• RED = STOP TRADING. Reflect. Reset.
Perfect for day traders, swing traders, or anyone building a professional edge through journaling and risk control.
No strategy entries. No repainting. Pure accountability.
“The market is a mirror. This journal is the polish.”
Developed with integrity. Built to protect your capital — and your peace.

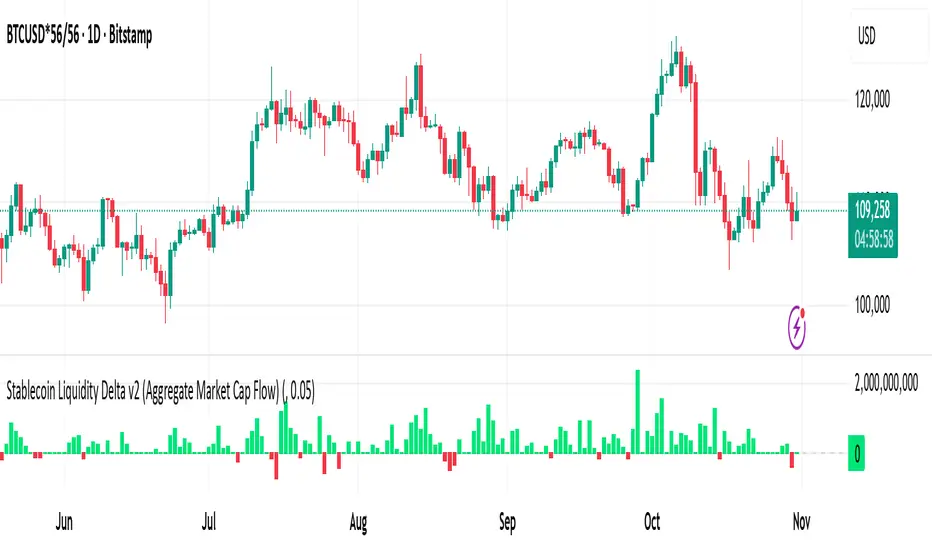
Stablecoin Liquidity Delta v2 (Aggregate Market Cap Flow)Updated version of Stablecoin Liquidity Delta (Aggregate Market Cap Flow).
Hi All,
This indicator visualizes the bar-to-bar change in the aggregate market capitalization of major stablecoins, including USDT, USDC, DAI, and others. It serves as a proxy for monitoring on-chain liquidity and measuring capital inflows or outflows across the crypto market.
Stablecoins are the primary liquidity layer of the crypto economy. Their combined market capitalization acts as a mirror of the available fiat-denominated liquidity in digital markets:
🟩 An increase in the total stablecoin market capitalization indicates new issuance (capital entering the market).
🟥 A decrease reflects redemption or burning (liquidity exiting the system).
Tracking these flows helps anticipate macro-level liquidity trends that often lead overall market direction, providing context for broader price movements.
All values are derived from TradingView’s public CRYPTOCAP tickers, which represent the market capitalization of each stablecoin. While minor deviations can occur due to small price fluctuations around the $1 peg, these figures serve as a proxy for circulating supply and net issuance across the stablecoin ecosystem.
Stablecoin Liquidity Delta (Aggregate Market Cap Flow)Hi All,
This indicator visualizes the bar-to-bar change in the aggregate market capitalization of major stablecoins, including USDT, USDC, DAI, and others. It serves as a proxy for monitoring on-chain liquidity and measuring capital inflows or outflows across the crypto market.
Stablecoins are the primary liquidity layer of the crypto economy. Their combined market capitalization acts as a mirror of the available fiat-denominated liquidity in digital markets:
🟩 An increase in the total stablecoin market capitalization indicates new issuance (capital entering the market).
🟥 A decrease reflects redemption or burning (liquidity exiting the system).
Tracking these flows helps anticipate macro-level liquidity trends that often lead overall market direction, providing context for broader price movements.
All values are derived from TradingView’s public CRYPTOCAP tickers, which represent the market capitalization of each stablecoin. While minor deviations can occur due to small price fluctuations around the $1 peg, these figures serve as a proxy for circulating supply and net issuance across the stablecoin ecosystem.

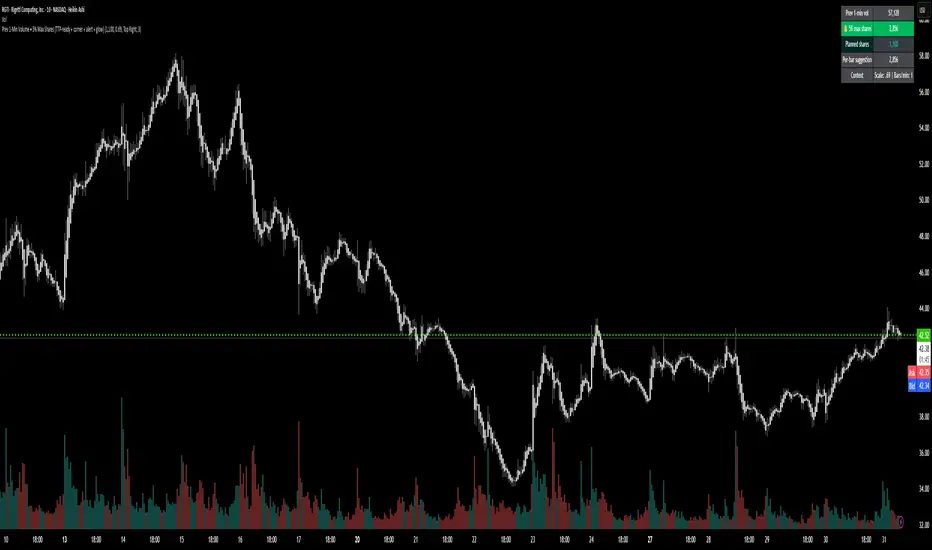
Prev 1-Min Volume • 5% Max Shares (TTP-ready)💡 Overview
This tool was built to help Trade The Pool (TTP) traders comply with the new “5% per minute volume” rule — without needing to calculate anything manually.
It automatically tracks the previous 1-minute volume, calculates 5% of it, and compares that to your planned order size.
If your planned size is within the limit, it shows green ✅.
If you’re above, it flashes red 🚫.
And when liquidity spikes allow for more size, you’ll see a green glow and 🔔 alert — so you can size up confidently without breaking the rule.
⚙️ Features
✅ Auto-calculates 5% volume cap from the previous 1-min candle
✅ Displays previous volume, max allowed shares, and your planned size
✅ TTP “different volume” scaling option (e.g. 0.69 for 45M vs 65M real volume)
✅ Per-bar slice suggestion for 10s scalpers
✅ Corner selector (top-left, top-right, bottom-left, bottom-right)
✅ Visual glow and 🔔 alert when liquidity window opens
✅ Compact and real-time responsive on 10s charts
Smart Dollar Cost Averaging DashboardThis closed-source TradingView indicator implements a comprehensive Dollar Cost Averaging (DCA) savings plan simulation designed to automate systematic investments. The script allows users to set a fixed investment amount and choose a customizable interval—weekly, monthly, or quarterly—at which purchases are simulated against historical or live price data. The core functionality calculates the average buy-in price dynamically by tracking cumulative invested capital and total acquired shares, providing a true average cost basis rather than simple price signals. This average price is visualized as a persistent, non-draggable horizontal line on the chart, enabling traders to intuitively compare the market price to their average entry point. A movable and toggleable dashboard accompanies the indicator, delivering real-time metrics including total investment, number of purchases, portfolio value, profit/loss both in absolute and percentage terms, and the price gap relative to the computed average buy-in. This transparency helps users understand their position’s health and supports disciplined long-term investment strategies. This script stands unique by combining flexible periodic investment scheduling with real capital calculations and detailed, easy-to-read visual feedback that is rarely bundled so intuitively in similar scripts. Unlike many open-source trend-following or scalping tools, this indicator focuses on systematic investment and passive portfolio growth, ideal for investors pursuing dollar cost averaging. Unlike standard buy/sell signal creators or simplistic moving average crossovers, this script models actual cash flow deployment and quantifies performance in real-time with a clean, professional UI. Its originality lies in marrying realistic capital flow simulation with intuitive visualization and multi-interval flexibility.
How It Works:
Tracks virtual investments of fixed cash amounts at user-defined intervals Converts invested amounts into shares based on closing prices, accumulating holding size Recalculates weighted average purchase price after each simulated buy Continuously displays the average buy-in as a stable graphic element on any price chart Offers detailed investment metrics through an interactive dashboard overlay Supports weekly, monthly, and quarterly investment cadences with user-selectable investment days Use Cases: Ideal for investors employing systematic savings plans to build long-term positions Fits cryptocurrency, stock, ETF, and index investments on TradingView Supports financial education by illustrating dollar cost averaging principles visually Facilitates performance tracking for passive investors who prioritize consistent buying over timing The script is an advanced tool meeting a distinct trading niche: systematic, cash-based, passive investment modeling with transparency and user control. This originality and usefulness justify the closed-source mode to protect intellectual property.
