Risk Context + Position SizingWhat This Indicator Does (And Doesn't Do)
This is NOT a buy/sell signal indicator. Instead, it's a risk management tool that helps you understand two critical things:
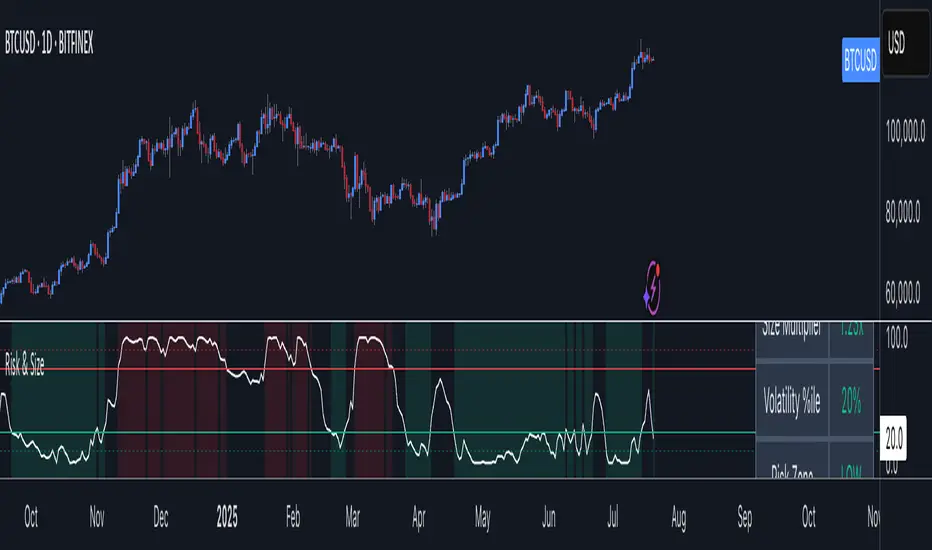
How volatile the market is right now (compared to recent history)
How much you should risk on your next trade based on that volatility
The Core Problem It Solves
Imagine you always risk the same amount on every trade - say $100. But sometimes the market is calm and predictable, other times it's wild and unpredictable. This indicator says: "Hey, the market is going crazy right now - maybe only risk $70 instead of your usual $100."
How It Works
Measures Market "Nervousness"
Uses ATR (Average True Range) to measure how much prices typically move each day
Compares today's volatility to the past 100 days
Shows you a percentile (0-100%) - higher = more volatile
Categorizes Risk Environment
LOW (green): Market is calm, you can size up slightly
NORMAL: Standard conditions, use your normal position size
HIGH (red): Market is jumpy, reduce your position size
EXTREME (dark red): Market is in chaos, significantly reduce size
Important Disclaimers
This doesn't predict price direction - it only measures current market stress
You still need a trading strategy - this just helps you size it properly
Past volatility doesn't guarantee future volatility
Always combine with proper stop losses and risk management