7M Multi-Factor Momentum ScoreboardThe 7M Scoreboard is more than just a collection of indicators; it is a Real-Time Scoring Engine designed for momentum traders and quant-focused analysts. While many scripts simply "mash up" indicators, the 7M Dashboard provides a weighted analytical framework that filters market noise into a single, actionable 7M Score.
It evaluates seven distinct dimensions of market health: Price Action, Relative Volume (Time-specific and Daily), Capital Structure (Float), and Multi-timeframe Trend alignment (VWAP, VWMA, MACD).
Make sure to enable Extended Trading Hours in the TradingView settings.
What makes it original?
The core innovation lies in the 7M Scoring & Alerting logic. Instead of a trader manually checking eight different parameters, the script performs a logical "Pass/Fail" assessment on every bar.
Dynamic Time-Anchored Change: Unlike standard change percentages, this script allows you to anchor the "Starting Price" to the Pre-market (4:00 AM), Regular Open (9:30 AM), or Post-market (4:00 PM).
Relative Volume (RVOL) at Time: It compares the current 5-minute volume not just to recent bars, but to the historical average for that specific time of day, filtering out the standard "lunchtime lull."
Capital Structure Integration: It incorporates a "Float" filter, essential for identifying low-float momentum vs. heavy-cap institutional moves.
How it works
The script calculates a total score out of 9 points based on the following criteria:
Momentum: Is price change > X percent from your chosen time anchor?
Liquidity: Is the 5-minute volume > X million?
Relative Strength: Is Daily RVOL and Time-specific RVOL > X?
Trend Alignment: Is price above VWAP and the 20-period VWMA?
Momentum Convergence: Is the MACD histogram positive?
Volatility Health: Is RSI between 30 and 70 (avoiding extreme over-extension)?
Step-by-Step Guide to Use
Set your Market Type: Open the settings and choose your Price Change Anchor.
Use Pre-Market if you trade the morning "Gap and Go."
Use Regular Open if you are a day-trader focused on the 9:30 AM bell.
Configure Thresholds: Set your Min % Move (e.g., 1.5%) and Min 5m Vol.
Monitor the 7M Score: Look at the bottom row.
Score < 5: High-risk, no clear momentum.
Score 7+: High-probability "7M Pass" setup.
Alerts (Great with TV's Watchlist Alerts)
Right-click the chart and "Add Alert." Select the 7M Dashboard and choose the "🚀 7M PASS" condition to be notified the moment a ticker hits your momentum criteria.
Recommended Settings for Different Assets
Small-Cap Momentum Pre-Market - 4.0% (Change) - 500k (5m Vol) - 50M (Float)
Mega-Cap / Tech Regular - 1.0% (Change) - 1.5M (5m Vol) - 30,000M (Float)
Crypto Intraday Regular - 2.5% (Change) - 1M (5m Vol) - 10,000M (Foat)
Technical Details
Pine Script Version: v6
Visuals: Features a high-contrast UI with adaptive text sizing for the final 7M Score.
Alerting: Includes an optimized alert() function for real-time momentum detection.
Disclaimer
The "7M Multi-Factor Momentum Scoreboard" is a technical analysis tool provided for educational and informational purposes only. Nothing contained in this script, its outputs, or the 7M Score constitutes financial, investment, or trading advice. Trading stocks, futures, and cryptocurrencies involves significant risk of loss and is not suitable for every investor.
No Guarantees: Past performance as displayed by historical indicators is not indicative of future results.
Model Limitations: The 7M Score is based on mathematical calculations of price and volume; it does not account for fundamental news, earnings surprises, or broader macroeconomic shifts.
Personal Responsibility: You are solely responsible for your own trading decisions. Always perform your own due diligence and consult with a licensed financial advisor before putting capital at risk.
POSTMARKET

Intraday Fibs RetracementFibonacci (Fibs) levels are often used by traders as a way to find support and resistance, based on the Fibonacci sequence. These levels are widely used in technical analysis to identify potential reversal points in the price of an asset.
Fibs retracement draws lines at these Fibs level between a significant high and low point on a price chart.
What it shows:
This indicator will automatically draw Fibs Retracement Levels on your chart without any manual work.
It is designed to be used for day trading, especially in scenarios where a ticker gaps up/down large compared to the prior day close. (i.e. scenario where the difference of day's open and prior day close is large)
The drawing will happen on each trading day the moment trading hours open, and will NOT draw during pre-market and post-market.
User can see the line of each Fibs level, labelled with the Fib percentage and price value for the corresponding levels.
User will specify a start and end point of Fibs and based on the choice the indicator will automatically compute the other user defined Fibs levels and display on the chart.
How to use it:
The Fib levels drawn can be a potential support and resistance zone. Therefore in scenario where you already have a position and are approaching one of these levels it could be a point to close out some or all the position as you are approaching a resistance. On the other hand when price do approach these levels you could enter a position for a reversal trade. These are few ways to use the indicator but there are other ways that can be used, which can be found out by researching "Fibonacci (Fibs) Retracement".
In the example on the chart you can see a price bounce from the 0.7886 Fibs level on this particular day, where the price gapped up and was coming down after market hours opened.
Key settings:
1. Fibs Retracement Start and end Point: User selects where the Fibs levels should be drawn.
Available Options are:
Start Points:
Market Open
Market Open High (Dependent on the time frame you are on)
Pre-market High
Day's High
End Points:
Previous Day Close
Previous Day Low
Previous Day High
Pre-market Low (Current Day)
Day's Low
2. Custom Fib Levels: User can manually enter the Fib levels they want to see. (Max 9)
Default values are: 0,0.236,0.382,0.5,0.618,0.786,1,1.618,2.618.
3. Display settings: User can specify the line colour, thickness and style.
4. Label Setting: User can choose to turn on/off the labels for the each Fibs Level. Label will show the fib percentage and the corresponding price. User can also choose the location of the labels, defined by an offset from the current candle.
----------------------------------------------------------------------
If anything is not clear please let me know!

Intraday LevelsWhat it shows:
This indicator is useful for day trading, where it will track and display you important price levels which includes:
Premarket Low (PML)
Premarket High (PMH)
Previous Day Low (PDL)
Previous Day High (PDH)
Previous Day Close (PDC)
After Hours Low (AHL)
After Hours High (AHH)
Day Low (DL)
Day High (DH)
The price level lines and labels will automatically adjust itself as the price moves, eliminating the need of manually having to adjusting these levels.
How to use it:
At these levels it can act as important support resistance points during the day and can often serve as a important pivot point for any ticker. You can expect price rejection or bounce when the price approaches these levels.
Key settings:
For each of the levels, user can adjust in the settings menu:
Line Colour
Line Thickness
Line Style
Label Text
Price Labelling on Label
Label Location (Offset from current bar)
Ability to turn on/off the price level and label
Display levels for either all days or on the day

Previous and Premarket High/Low IndicatorDescription:
The "Previous and Premarket High/Low" indicator is designed to help traders identify key levels during the premarket, postmarket, and regular trading sessions. It highlights the highest and lowest prices during the premarket session and the previous trading day, providing critical levels for intraday trading strategies.
Features:
Customizable Display Settings: Users can adjust the colors, line styles, and line widths for the premarket and previous day high/low levels.
Session Labels: Clear labels indicating premarket and postmarket sessions for easy identification.
Alerts: Set alerts for significant price movements, such as new highs or lows during premarket and previous trading sessions.

Scoopy StacksWaffle Around Multiple
(Open, High, Low, Close) Stacks On
Pre/Post Market & (Daily, Weekly,
Monthly, Yearly) Sessions With
Meticulous Columns, Rows, Tooltips,
Colors, Custom Ideas, and Alerts.
Sessions Use Two Step Incremental Values
Default Value: (1) Shows Two Previous
(O, H, L, C); Increasing Value Swaps
Sessions With Next Two Stacks.
⬛️ KEY WORDS:
🟢 Crossover | 🔴 Crossunder
📗 High | 📕 Low
📔 Open | 📓 Close
🥇 First Idea | 🥈 Second Idea
🥉 Third Idea | 🎖️ Fourth Idea
🟥 ALERTS:
Default Option: (Per Bar)
Alerts Once Conditions Are Met
(Bar Close) Alerts When Bar Closes
Default Option: (Reg)
Alerts During Regular Market
Trading Hours, (0930-1600)
(Ext) Alerts During Extended
Market Hours, (1600-0930)
(24/7) Alerts All Day
Optional Preferences:
Regular Alerts - Stocks
Extended Alerts - Futures
24/7 Alerts - Crypto
🟧 STACKS:
Default Value: (1)
Incremental Stack Value, Increasing Value
Swaps Sessions With the Next Two Stacks
(✓) Swap Stacks?
Pre/Post Market High/Lows,
1-2 Day High/Lows, 1-2 Week High/Lows,
1-2 Month High/Lows, 1-2 Year High/Lows
( ) Swap Stacks?
Pre/Post Market Open/Close,
1-2 Day Open/Close, 1-2 Week Open/Close,
1-2 Month Open/Close, 1-2 Year Open/Close
🟨 EXAMPLES:
Default Stack:
🟢 | 📗 Pre Market High (PRE) | 4600.00
🔴 | 📕 Post Market Low (POST) | 420.00
Optional: (Open)
🟢 | 📔 Post Market Open (POST) | 4400.00
Optional: (Close)
🔴 | 📓 Pre Market Close (PRE) | 430.00
Default Stack Value: (1)
🔴 | 📗 1 Day High (1DH) | 460.00
Next Stack Value: (3)
🟢 | 📕 4 Day Low (4DL) | 420.00
Optional: (Open)
🔴 | 📔 2 Day Open (2DO) | 440.00
Optional: (Close)
🟢 | 📓 3 Day Close (3DC) | 430.00
Default Stack Value: (5)
🟢 | 📗 5 Week High (5WH) | 460.00
Next Stack Value: (7)
🔴 | 📕 8 Week Low (8WL) | 420.00
Optional: (Open)
🔴 | 📔 7 Week Open (7WO) | 4400.00
Optional: (Close)
🟢 | 📓 6 Week Close (6WC) | 430.00
Default Stack Value: (9)
🔴 | 📗 9 Month High (9MH) | 460.00
Next Stack Value: (11)
🟢 | 📕 12 Month Low (12ML) | 420.00
Optional: (Open)
🟢 | 📔 11 Month Open (11MO) | 4400.00
Optional: (Close)
🔴 | 📓 10 Month Close (10MC) | 430.00
Default Stack Value: (13)
🟢 | 📗 13 Year High (13YH) | 460.00
Next Stack Value: (15)
🟢 | 📕 16 Year Low (16YL) | 420.00
Optional: (Open)
🔴 | 📔 15 Year Open (15YO) | 4400.00
Optional: (Close)
🔴 | 📓 14 Year Close (14YC) | 430.00
🟩 TABLES:
Default Value: (1)
Moves Table Up, Down, Left, or Right
Based on Second Default Value
First Default Value: (Top Right)
Sets Table Placement, Middle Center
Allows Table To Move In All Directions
Second Default Value: (Default)
Fixed Table Position, Switching Values
Moves Direction of the Table
🟦 IDEAS:
(✓) Show Ideas?
Shows Four Ideas With Custom Texts
and Values; Ideas Are Based Around
Post-It Note Reminders with Alerts
Suggestions For Text Ideas:
Take Profit, Stop Loss, Trim, Hold,
Long, Short, Bounce Spot, Retest,
Chop, Support, Resistance, Buy, Sell
🟪 EXAMPLES:
Default Value: (5)
Shows the Custom Table Value For
Sorted Table Positions and Alerts
Default Text: (🥇)
Shown On First Table Cell and
Message Appearing On Alerts
Alert Shows: 🟢 | 🥇 | 5.00
Default Value: (10)
Shows the Custom Table Value For
Sorted Table Positions and Alerts
Default Text: (🥈)
Shown On Second Table Cell and
Message Appearing On Alerts
Alert Shows: 🔴 | 🥈 | 10.00
Default Value: (50)
Shows the Custom Table Value For
Sorted Table Positions and Alerts
Default Text: (🥉)
Shown On Third Table Cell and
Message Appearing On Alerts
Alert Shows: 🟢 | 🥉 | 50.00
Default Value: (100)
Shows the Custom Table Value For
Sorted Table Positions and Alerts
Default Text: (🎖️)
Shown On Fourth Table Cell and
Message Appearing On Alerts
Alert Shows: 🔴 | 🎖️ | 100.00
⬛️ REFERENCES:
Pre-market Highs & Lows on regular
trading hours (RTH) chart
By Twingall
Previous Day Week Highs & Lows
By Sbtnc
Screener for 40+ instruments
By QuantNomad
Daily Weekly Monthly Yearly Opens
By Meliksah55

Ribbit RangesBounce Around Multiple
(Open, High, Low, Close) Ranges
On Pre/Post Market & (Daily, Weekly,
Monthly, Yearly) Sessions With
Meticulous Lines, Labels, Tooltips,
Colors, Custom Ideas, and Alerts.
Sessions Use Two Step Incremental Values
Default Value: (1) Shows Two Previous
(O, H, L, C); Increasing Value Swaps
Sessions With Next Two Ranges.
⬛️ KEY WORDS:
🟢 Crossover | 🔴 Crossunder
📗 High | 📕 Low
📔 Open | 📓 Close
🥇 First Idea | 🥈 Second Idea
🥉 Third Idea | 🎖️ Fourth Idea
🟥 ALERTS:
Default Option: (Per Bar)
Alerts Once Conditions Are Met
(Bar Close) Alerts When Bar Closes
Default Option: (Reg)
Alerts During Regular Market
Trading Hours, (0930-1600)
(Ext) Alerts During Extended
Market Hours, (1600-0930)
(24/7) Alerts All Day
Optional Preferences:
Regular Alerts - Stocks
Extended Alerts - Futures
24/7 Alerts - Crypto
🟧 RANGES:
Default Value: (1)
Incremental Range Value, Increasing Value
Swaps Sessions With the Next Two Ranges
(✓) Swap Ranges?
Pre/Post Market High/Lows,
1-2 Day High/Lows, 1-2 Week High/Lows,
1-2 Month High/Lows, 1-2 Year High/Lows
( ) Swap Ranges?
Pre/Post Market Open/Close,
1-2 Day Open/Close, 1-2 Week Open/Close,
1-2 Month Open/Close, 1-2 Year Open/Close
🟨 EXAMPLES:
Default Range:
🟢 | 📗 Pre Market High (PRE) | 4600.00
🔴 | 📕 Post Market Low (POST) | 420.00
Optional: (Open)
🟢 | 📔 Post Market Open (POST) | 4400.00
Optional: (Close)
🔴 | 📓 Pre Market Close (PRE) | 430.00
Default Range Value: (1)
🔴 | 📗 1 Day High (1DH) | 460.00
Next Range Value: (3)
🟢 | 📕 4 Day Low (4DL) | 420.00
Optional: (Open)
🔴 | 📔 2 Day Open (2DO) | 440.00
Optional: (Close)
🟢 | 📓 3 Day Close (3DC) | 430.00
Default Range Value: (5)
🟢 | 📗 5 Week High (5WH) | 460.00
Next Range Value: (7)
🔴 | 📕 8 Week Low (8WL) | 420.00
Optional: (Open)
🔴 | 📔 7 Week Open (7WO) | 4400.00
Optional: (Close)
🟢 | 📓 6 Week Close (6WC) | 430.00
Default Range Value: (9)
🔴 | 📗 9 Month High (9MH) | 460.00
Next Range Value: (11)
🟢 | 📕 12 Month Low (12ML) | 420.00
Optional: (Open)
🟢 | 📔 11 Month Open (11MO) | 4400.00
Optional: (Close)
🔴 | 📓 10 Month Close (10MC) | 430.00
Default Range Value: (13)
🟢 | 📗 13 Year High (13YH) | 460.00
Next Range Value: (15)
🟢 | 📕 16 Year Low (16YL) | 420.00
Optional: (Open)
🔴 | 📔 15 Year Open (15YO) | 4400.00
Optional: (Close)
🔴 | 📓 14 Year Close (14YC) | 430.00
🟩 COLORS:
(✓) Swap Colors?
Text Color Is Shown Using
Background Color
( ) Swap Colors?
Background Color Is Shown
Using Text Color
🟦 IDEAS:
(✓) Show Ideas?
Plots Four Ideas With Custom Lines
and Labels; Ideas Are Based Around
Post-It Note Reminders with Alerts
Suggestions For Text Ideas:
Take Profit, Stop Loss, Trim, Hold,
Long, Short, Bounce Spot, Retest,
Chop, Support, Resistance, Buy, Sell
🟪 EXAMPLES:
Default Value: (5)
Shows the Custom Value For
Lines, Labels, and Alerts
Default Text: (🥇)
Shown On First Label and
Message Appearing On Alerts
Alert Shows: 🟢 | 🥇 | 5.00
Default Value: (10)
Shows the Custom Value For
Lines, Labels, and Alerts
Default Text: (🥈)
Shown On Second Label and
Message Appearing On Alerts
Alert Shows: 🔴 | 🥈 | 10.00
Default Value: (50)
Shows the Custom Value For
Lines, Labels, and Alerts
Default Text: (🥉)
Shown On Third Label and
Message Appearing On Alerts
Alert Shows: 🟢 | 🥉 | 50.00
Default Value: (100)
Shows the Custom Value For
Lines, Labels, and Alerts
Default Text: (🎖️)
Shown On Fourth Label and
Message Appearing On Alerts
Alert Shows: 🔴 | 🎖️ | 100.00
⬛️ REFERENCES:
Pre-market Highs & Lows on regular
trading hours (RTH) chart
By Twingall
Previous Day Week Highs & Lows
By Sbtnc
Screener for 40+ instruments
By QuantNomad
Daily Weekly Monthly Yearly Opens
By Meliksah55

Show Extended Hours (Futures & Crypto)OVERVIEW
This indicator mimics TradingViews "Extended trading hours" background color settings. It is most useful on symbols that do not conventionally have extended hours, but are available to trade during those hours (ie. Futures and Crypto). Because market participation (ie. volatility) in a given symbol can change dramatically at or near these transitions, seeing conventional market open / closures expedites price action context around these transitions.
INPUTS
You can configure:
Background colors for both Premarket and After Hours
Which extended hours you would like to see
Market Hours and Time Zone

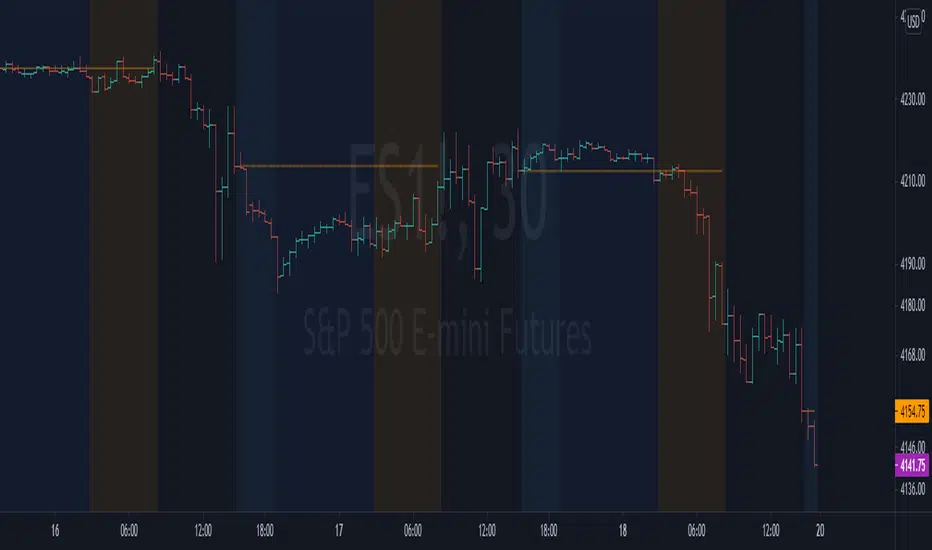
NYSE extended session backgroundThis script adds background to the chart to highlight different time areas in any chart.
The time areas are in relation to the open/close time of NYSE , both regular and extended session.
The background colors are the following by default:
NO COLOR : NYSE is open
DARK BLUE : NYSE is closed
LIGHT BLUE : NYSE post market session
ORANGE : NYSE pre market session
In addition, previous day close price line is shown during extended and closed sessions (orange line).
This script is useful to visualize any chart in relation to the NYSE timetable.