Recursive RsiIntroduction
I have already posted a classic indicator using recursion, it was the stochastic oscillator and recursion helped to get a more predictive and smooth result. Here i will do the same thing with the rsi oscillator but with a different approach. As reminder when using recursion you just use a fraction of the output of a function as input of the same function, i say a fraction because if you feedback the entire output you will just have a periodic function, this is why you average the output with the input.
The Indicator
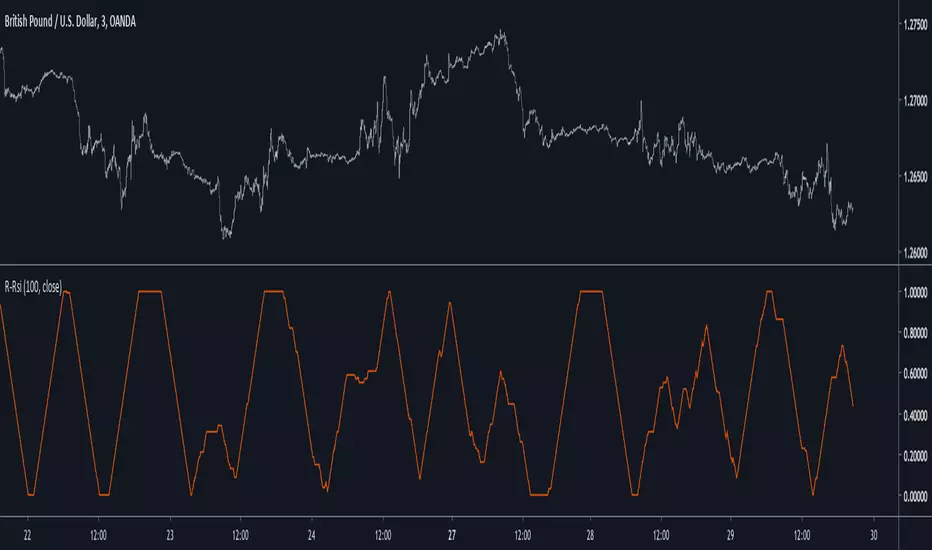
The indicator will use 50% of the output and 50% of the input, remember that when using feedback always rescale your input, else the effect might be different depending on the market you are in. You can interpret the indicator like a normal rsi except if you plan to use the 80/20 level, depending on length the scale might change, if you need a fixed scale you can always rescale b by using an rsi or stochastic oscillator.
Conclusion
I have presented an rsi oscillator using a different type of recursion structure than the recursive stochastic i posted in the past, the result might be more predictive than the original rsi. Hope you like it and thanks for reading !
Predictive
Linear Quadratic Convergence Divergence OscillatorIntroduction
I inspired myself from the MACD to present a different oscillator aiming to show more reactive/predictive information. The MACD originally show the relationship between two moving averages by subtracting one of fast period and another one of slow period. In my indicator i will use a similar concept, i will subtract a quadratic least squares moving average with a linear least squares moving average of same period, since the quadratic least squares moving average is faster than the linear one and both methods have low-lag this will result in a reactive oscillator.
LQCD In Details
A quadratic least squares moving average try to fit a quadratic function (parabola) to the price by using the method of least squares, the linear least squares moving average try to fit a line. Non-linear fit tend to minimize the sum of squares in non-linear data, this is why a quadratic method is more reactive. The difference of both filters give us an oscillator, then we apply a simple moving average to this oscillator to provide the signal line, subtracting the oscillator and its signal line give us the histogram, those two last steps are the same used in the MACD.
Length control the period of the quadratic/linear moving average. While the MACD use a signal line for plotting the histogram i also added the option to plot the momentum of the quadratic moving average instead, the result is smoother and reduce irregularities, in order to do so just check the differential option in the parameter box.
The period of the signal line and the momentum are both controlled by the signal parameter.
A predictive approach can be made by subtracting the histogram with the signal line, this process make the histogram way more predictive, in order to do so just check the predictive histogram option in the parameter box.
Predictive histogram with simple histogram option. The differential mode can also be used with the predictive parameter, this result in a smoother but less reactive prediction.
Information Interpretation
The amount of information the MACD can give us is high. We can use the histogram as signal generator, or the if the oscillator is over/under 0, combine the oscillator/signal line with histogram, combinations can provide various systems. Some traders use the histogram as signal generator and use the cross between the histogram and the signal line as a stop signal, this method can avoid some whipsaw trades. The study of divergences with the price is also another method.
Conclusion
This oscillator aim to show the same amount of information as the MACD with a similar calculation method but using different kind of filters as well as eliminating the need to use two separates periods for the moving averages calculation, its still possible to use different periods for the quadratic/linear moving average but the results can be less accurate. This indicator can be used like the MACD.

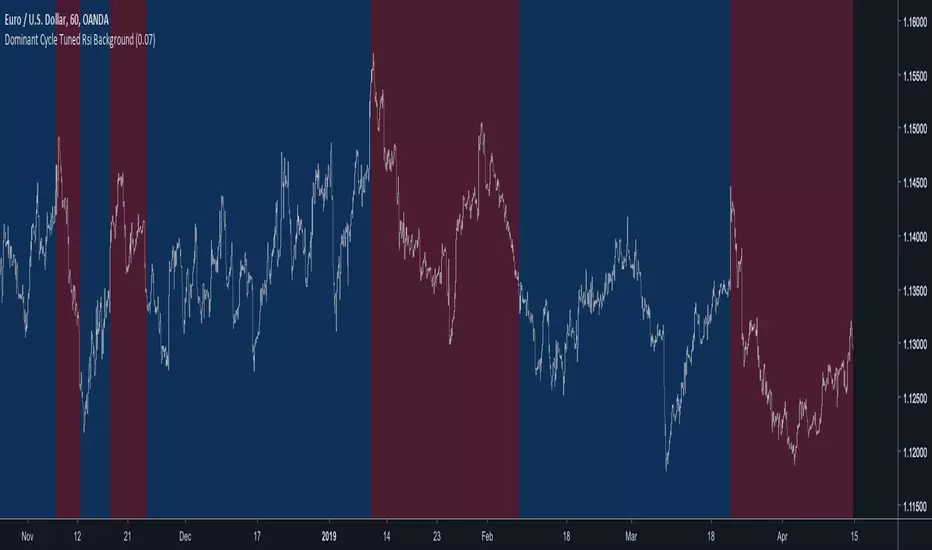
Dominant Cycle Tuned Rsi BackgroundBackground version of the Dominant Cycle Tuned Rsi Background published here
Dominant Cycle Tuned RsiIntroduction
Adaptive technical indicators are importants in a non stationary market, the ability to adapt to a situation can boost the efficiency of your strategy. A lot of methods have been proposed to make technical indicators "smarters" , from the use of variable smoothing constant for exponential smoothing to artificial intelligence.
The dominant cycle tuned rsi depend on the dominant cycle period of the market, such method allow the rsi to return accurate peaks and valleys levels. This indicator is an estimation of the cycle finder tuned rsi proposed by Lars von Thienen published in Decoding the Hidden Market Rhythm/Fine-tuning technical indicators using the dominant market vibration/2010 using the cycle measurement method described by John F.Ehlers in Cybernetic Analysis for Stocks and Futures .
The following section is for information purpose only, it can be technical so you can skip directly to the The Indicator section.
Frequency Estimation and Maximum Entropy Spectral Analysis
“Looks like rain,” said Tom precipitously.
Tom would have been a great weather forecaster, but market patterns are more complex than weather ones. The ability to measure dominant cycles in a complex signal is hard, also a method able to estimate it really fast add even more challenge to the task. First lets talk about the term dominant cycle , signals can be decomposed in a sum of various sine waves of different frequencies and amplitudes, the dominant cycle is considered to be the frequency of the sine wave with the highest amplitude. In general the highest frequencies are those who form the trend (often called fundamentals) , so detrending is used to eliminate those frequencies in order to keep only mid/mid - highs ones.
A lot of methods have been introduced but not that many target market price, Lars von Thienen proposed a method relying on the following processing chain :
Lars von Thienen Method = Input -> Filtering and Detrending -> Discrete Fourier Transform of the result -> Selection using Bartels statistical test -> Output
Thienen said that his method is better than the one proposed by Elhers. The method from Elhers called MESA was originally developed to interpret seismographic information. This method in short involve the estimation of the phase using low amount of information which divided by 360 return the frequency. At first sight there are no relations with the Maximum entropy spectral estimation proposed by Burg J.P. (1967). Maximum Entropy Spectral Analysis. Proceedings of 37th Meeting, Society of Exploration Geophysics, Oklahoma City.
You may also notice that these methods are plotted in the time domain where more classic method such as : power spectrum, spectrogram or FFT are not. The method from Elhers is the one used to tune our rsi.
The Indicator
Our indicator use the dominant cycle frequency to calculate the period of the rsi thus producing an adaptive rsi . When our adaptive rsi cross under 70, price might start a downtrend, else when our adaptive rsi crossover 30, price might start an uptrend. The alpha parameter is a parameter set to be always lower than 1 and greater than 0. Lower values of alpha minimize the number of detected peaks/valleys while higher ones increase the number of those. 0.07 for alpha seems like a great parameter but it can sometimes need to be changed.
The adaptive indicator can also detect small top/bottoms of small periods
Of course the indicator is subject to failures
At the end it is totally dependent of the dominant cycle estimation, which is still a rough method subject to uncertainty.
Conclusion
Tuning your indicator is a great way to make it adapt to the market, but its also a complex way to do so and i'm not that convinced about the complexity/result ratio. The version using chart background will be published separately.
Feel free to tune your indicators with the estimator from elhers and see if it provide a great enhancement :)
Thanks for reading !
References
for the calculation of the dominant cycle estimator originally from www.davenewberg.com
Decoding the Hidden Market Rhythm (2010) Lars von Thienen
Ehlers , J. F. 2004 . Cybernetic Analysis for Stocks and Futures: Cutting-Edge DSP Technology to Improve Your Trading . Wiley

Alpha-Sutte ModelThe Alpha-Sutte model is an ongoing project run by Ansari Saleh Ahmar, a lecturer and researcher at Universitas Negeri Makassar in Indonesia, that attempts to make forecasts for time series like how Arima and Holt-Winters models do. Currently Ahmar and his team have conducted research and published papers comparing the efficacy of the Alpha-Sutte and other models, such as Arima and Holt-Winters, on topics ranging from forecasting Turkey's CPI data, Bitcoin prices, Apple's stock prices, primary energy supply of Indonesia, to infant mortality rates in China.
The Alpha-Sutte model in comparison to the other two models listed above shows promise in providing a more accurate forecast, and the project has been able to receive some of its funding from organizations such as the US Agency for International Development, which is a part of the US Federal Government, so maybe the project has some actual merit.
How it works:
In this model there are four values presented at the top of the window.
1) The first value in blue is the value of the Alpha-Sutte model whose purpose is to forecast the price of the current bar.
2) The second value in yellow is an adaptive version of the Alpha-Sutte model that I made. The purpose of the adaptive Alpha-Sutte model is to expand upon the Alpha-Sutte by allowing new information to be introduced, causing the value to change during the current period, hence the adaptiveness of it.
3) The third value in aqua is the moving average of the low% Sutte line which is a predictive line that is based off of the close and low of the current and previous periods.
4) The fourth value in red is the moving average of the high% Sutte line which is a predictive line that is based off of the close and high of the current and previous periods.
Trend signals:
If low% Sutte (aqua value/line) is greater than high% Sutte (red value/line) then this is a buy signal.
If high% Sutte (red value/line) is greater than low% Sutte (aqua value/line) then this is a sell signal.
Caveat:
Even though this model's purpose is to forecast the future, will it be able to predict periods of large movements? No, of course not, but it will adjust quickly to try to make more accurate forecasts for the next period. This was also a reason why I made an adaptive version of this model to try to reduce some of the discrepancies between the Alpha Sutte and price when there is a large unexpected move.
*WARNING before using this I would highly recommend that you look up "Sutte Indicator" online and read some of the papers about this model before you use this , even though this model has shown merit when compared to Arima and Holt-Winter models this is still an ongoing project.*
Hopefully this project will actually come to something in the near future as the calculation for this time series predictive model is much easier to calculate and program in pine editor than something like an Arima model.
*Also, if you know how to use R language there is a package for the "Alpha-Sutte model".*

Awesome Oscillator and MACD HistogramThis is a quick script that combines two standard indicators, the Awesome Oscillator and MACD histogram, to highlight the beginnings of periods of fast price movement (divergence between the two). Since MACD's EMA responds more quickly than AO's SMA, look for periods of green over gold as a bullish signal, and red under blue as a bearish signal.
Of course both indicators are lagging in nature, but the presence of this divergence often leads larger, continued movement in the same direction.
Bullish Signals
Change from red to green below 0 with either blue or gold above 0 (strengthened on second green bar):
Rising green above 0 with gold below 0:
Bearish Signals
Change from green to red above 0 with either blue or gold below 0 (strengthened on second red bar):
Deepening red below 0 with blue above 0:

Godmode 3.1.4 - SNOW_CITY SCALPER EDITION - 7/2017 Updates to xSilas Godmode Oscillator published December 19th, 2014
Thanks to LEGION, LAZYBEAR, Ni6HTH4wK, xSilas
Updates:
Changed default sources to include BITSTAMP and REMOVED BTC-e
Changed default lengths for SCALPING SUPREMACY - See Instructions
Changed "Caution dots" to RED because YELLOW was hard to see.
I mostly Ignore the oscillators and only use the caution dots with this configuration:
MOST EFFECTIVE USE: BITSTAMP:BTCUSD BITSTAMP:BTCUSD
- Use on 1m charts of your BITMEX swap, yes 1m. I know, but it works better this way. 5m and 15m work best when using on an exchange index.
- IF overall 2H trend is DOWN, the 1m godmode on swap CAUTION DOTS appear on the UPPER BOUNDS means good SHORT entry points, and the lower dots suggest a possible reversal and good exit opportunity (not always)
- If overall 2H trend is UP, the 1m godmode on swap CAUTION DOTS appear on the LOWER BOUNDS means good LONG entry points, and upper dots suggest possible oversold if they start to round over, again not always.
This is ultra simple, and very effective.
Default settings for VERY sensitive CAUTION DOT blop: 17,6,4
Use these settings for a slightly less sensitive CAUTION DOT blop: 14,12,9

[RS][ALPHA]Predictive Range Analysis V0this code is untested use at your own risk...
applying timed price change over the square to predict price expansion or contraction of the range, it is not predicting the future price only the range that is possible for the price to be in within a margin of error of possibility, with that said i think its very unlikely for price to fall outside the range, due to virtual constraint applied by the auto corrective/cyclical nature of price action.
