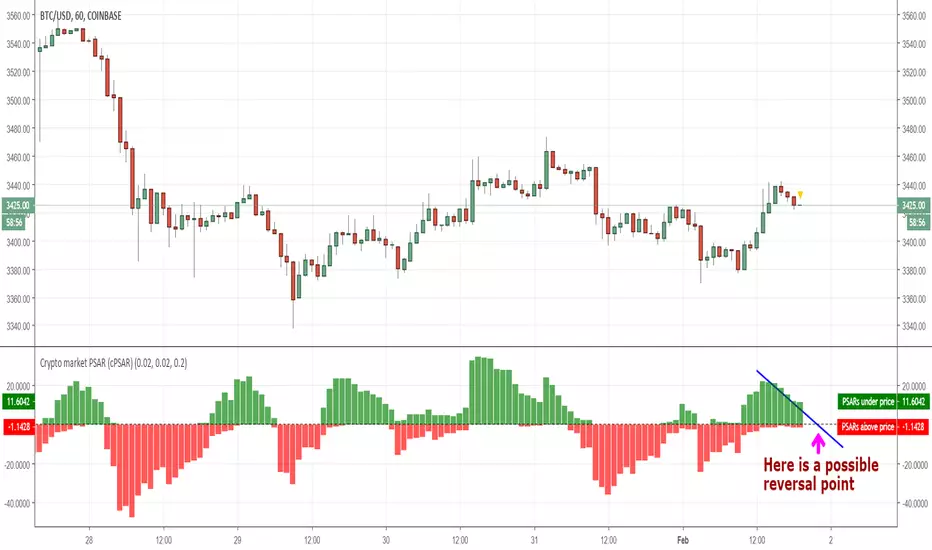
Crypto market PSAR (cPSAR)This indicator calculates the PSARs of the most liquid cryptocurrencies (as percent differences from the prices) and sums them together.
The PSARs under the closes, which act as support, are summed separately and shown in green. The PSARs over the closes (acting as resistance) are summed separately and shown in red.
The result is an indicator which can be interpreted somewhat like the RSI (but keep in mind that PSAR is a lagging indicator unlike the RSI which is a leading indicator). By interpreting this correctly you can - SOMETIMES - predict the short-term turns of the entire crypto market.
Many traders use the prices shown by PSAR (Parabolic Stop And Reverse) to set stop loss prices and/or to take profit and reverse their positions. This is why, on reversal of the PSARs (= when one of the red or green values becomes visibly larger than the other), a strong turning of the market can, sometimes, occur.
Psar
SARSI Reversal StrategySimple reversal strategy based on 'Parabolic Stop and Reverse' and 'Relative Stength Index' indicators.

LINEdicator - Trendanalysis toolThis indicator creates an trend channel based on an EMA/SMA combo and a Parabolc SAR indicator.
Watch for the peaks and the size of the red/green channel for possible trend change.
Can also be used as an Entry/Exit/Stop-Loss setting tool.

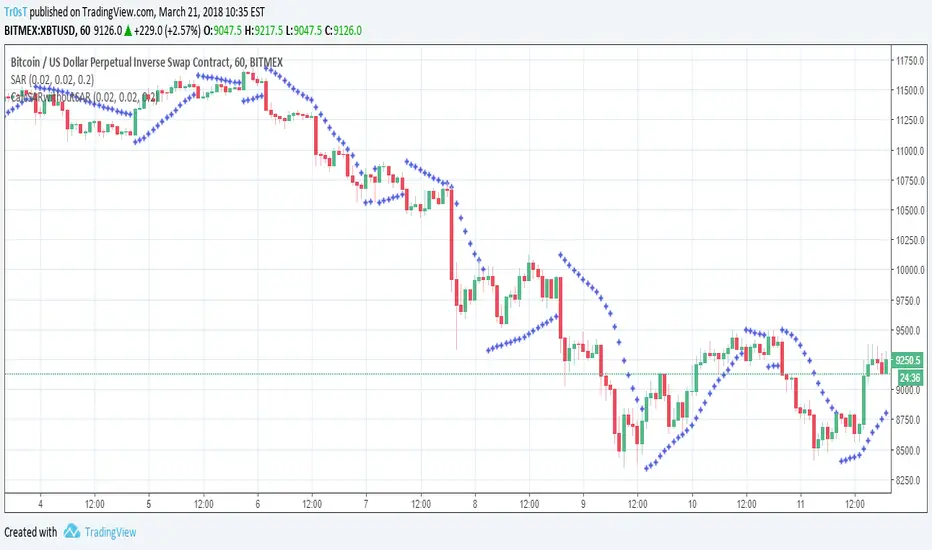
Kozlod - Parabolic SAR Strategy AlertsAlerts for standard Parabolic SAR Strategy.
It works best with "Once per bar" option.

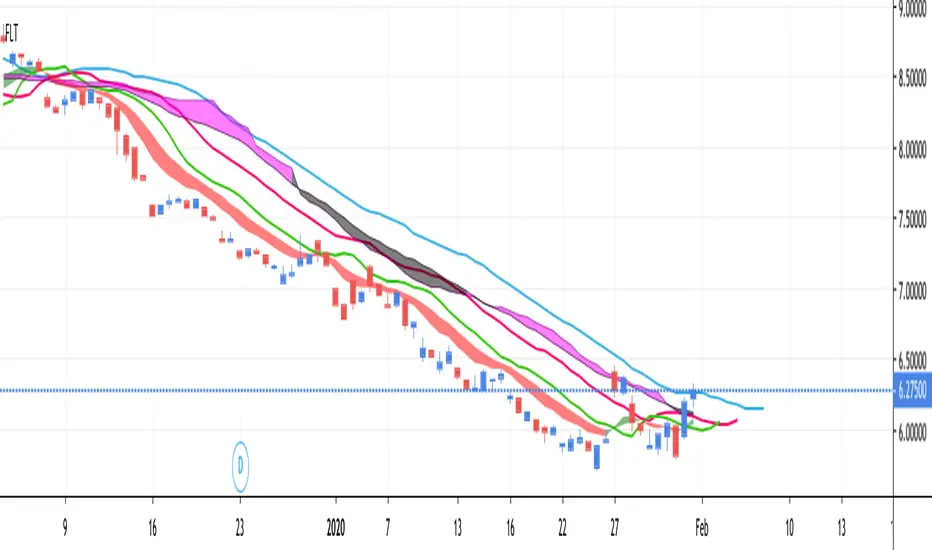
FLT - Fully Loaded TacoThis is a very full indicator.
NOTICE: By default, ALL indicators are turned off in the settings, except for the Bollinger Band, in order to facilitate faster load times.
Features can easily be turned on/off in the settings. You can have as many or as few as you want.
FEATURE LIST:
3 SMAs (Fast, Medium, Slow)
3 EMAs (Fast, Medium, Slow)
Support & Resistance Lines (Lime Color)
Parabolic Support & Resistance (Red dots above, Blue dots below)
Keltner Channel (purple channel lines)
Bollinger Band (Blue Cloud; Center & Borders hidden by default)
TTM Squeeze (Purple Background Color on Chart)
VWAP (Vibrant Blue Glowing Line, Intraday Only)
Fibonacci Retracement (Multicolor, Intraday Only)
Ichimoku Cloud (Standard Colors)
All indicators in one!All indicators in one!
Hull MA (2 colors) + Bollinger Bands + 6 EMA + 50 SMA + 200 SMA + Parabolic SAR + SUPER TREND (2 colors) + Doji signals (yellow)