EMA Cross Pullback For M5 timeframe chart.
Best combine with MACD.
Stop Loss slightly below/above ema50.
Pullbacktrade

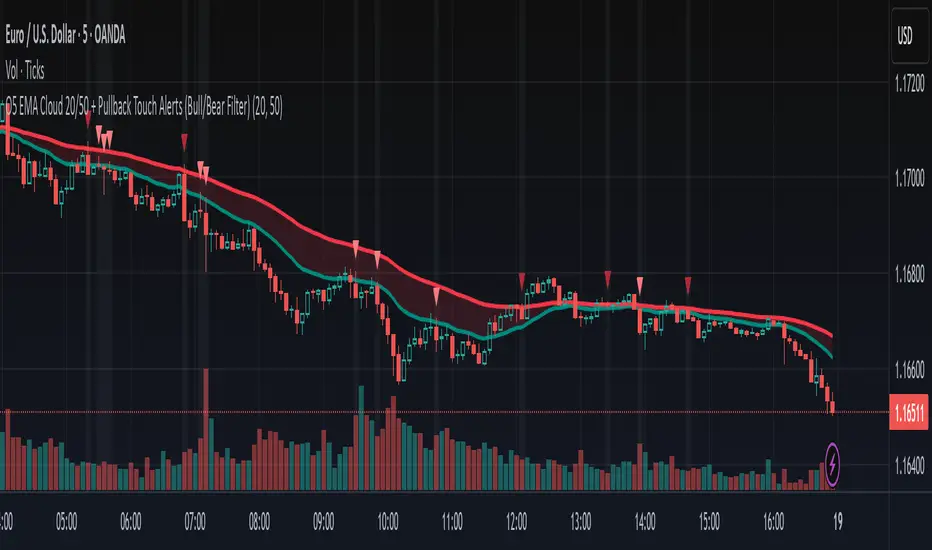
O5 EMA Cloud 20/50 + Pullback Touch Alerts (Bull/Bear Filter)This indicator shows an EMA cloud that is set to Fast=20 and Slow=50 by default, but can be changed.
It features suggested entry signals when price pulls back to either EMA level in both uptrends and downtrends.
Buy signals print only when price pulls back to one of the EMA levels and closes up.
Bearish signals only print when price pulls back to one of the EMA levels and closes down.
EMA+ATR Band MTF Trend EntryThis is a Multi-Timeframe Trend Trading indicator strategy adapted from Sahil Rohmehtra’s Mentorship programme. The trading decision is made by first accessing the trend in higher timeframe (say Monthly) by using TWO EMAs. If the faster EMA (say 20 period) is above Slower EMA (say 50 period) and the price is above slower EMA then the trend is suitable for buyers. Similarly if faster EMA is below slow EMA and the price is below that then trend is suitable for sellers.
Once we access the trend in the higher timeframe we move to the lower timeframe (say Weekly) and access the 5-period RSI value. If RSI is below 30 then we can prepare for possible buy entry in lower (Daily) timeframe if entry conditions are met in daily timeframe. Similarly sell bias can be initiated when the higher timeframe EMA trend is down, daily RSI is above 70 and sell entry condition is met in daily timeframe. The RSI thresholds can be changed by the user.
Once we identified the RSI bias then wait for the confirmation candle in the lower timeframe (say 1 hour). In the entry timeframe we plot a band of 20 EMA of LOWs ± 1 ATR lines. Here,we wait for a candle to close above the 20 EMA of LOWs + 1 ATR for a buy signal with an increase in On Balance Volume (OBV) value. Similarly for sell signal we should get a candle close below the 20 EMA of LOWs - 1 ATR with corresponding change in OBV. This candle is the signal candle.
Once we get a Buy or Sell signal the corresponding stop loss is the nearest LOW - 1 ATR or HIGH + 1 ATR. The ATR scaling may be changed by the user. Now if another candle closes above the high of the buy signal candle then enter on buy. If the low of the buy signal candle is broken then it is a potential short-term sell entry. Similarly if another candle closes below the sell signal candle then enter short and if there is a close above high of the signal candle then it is a potential buy entry.

Multi Fibonacci Supertrend with Signals【FIbonacciFlux】Multi Fibonacci Supertrend with Signals (MFSS)
Overview
The Multi Fibonacci Supertrend with Signals (MFSS) is an advanced technical analysis tool that combines multiple Supertrend indicators using Fibonacci ratios to identify trend directions and potential trading opportunities.
Key Features
1. Fibonacci-Based Supertrend Levels
* Factor 1 (Weak) : 0.618 - The golden ratio
* Factor 2 (Medium) : 1.618 - The Fibonacci ratio
* Factor 3 (Strong) : 2.618 - The extension ratio
2. Visual Components
* Multi-layered Trend Lines
* Different line weights for easy identification
* Progressive transparency from Factor 1 to Factor 3
* Color-coded trend directions (Green for bullish, Red for bearish)
* Dynamic Fill Areas
* Gradient fills between price and trend lines
* Visual representation of trend strength
* Automatic color adjustment based on trend direction
* Signal Indicators
* Clear BUY/SELL labels on chart
* Position-adaptive signal placement
* High-visibility color scheme
3. Signal Generation Logic
The system generates signals based on two key conditions:
* Primary Condition :
* BUY : Price crossunder Supertrend2 (Factor 1.618)
* SELL : Price crossover Supertrend2 (Factor 1.618)
* Confirmation Filter :
* Signals only trigger when Supertrend3 confirms the trend direction
* Reduces false signals in volatile markets
Technical Details
Input Parameters
* ATR Period : 10 (default)
* Customizable for different market conditions
* Affects sensitivity of all Supertrend levels
* Factor Settings :
* All factors are customizable
* Default values based on Fibonacci sequence
* Minimum value: 0.01
* Step size: 0.01
Alert System
* Built-in alert conditions
* Customizable alert messages
* Real-time notification support
Use Cases
* Trend Trading
* Identify strong trend directions
* Filter out weak signals
* Confirm trend continuations
* Risk Management
* Multiple trend levels for stop-loss placement
* Clear entry and exit signals
* Trend strength visualization
* Market Analysis
* Multi-timeframe analysis capability
* Trend strength assessment
* Market structure identification
Benefits
* Reliability
* Based on proven Supertrend algorithm
* Enhanced with Fibonacci mathematics
* Multiple confirmation levels
* Clarity
* Clear visual signals
* Easy-to-interpret interface
* Reduced noise in signal generation
* Flexibility
* Customizable parameters
* Adaptable to different markets
* Suitable for various trading styles
Performance Considerations
* Optimized code structure
* Efficient calculation methods
* Minimal resource usage
Installation and Usage
Setup
* Add indicator to chart
* Adjust parameters if needed
* Enable alerts as required
Best Practices
* Use with other confirmation tools
* Adjust factors based on market volatility
* Consider timeframe appropriateness
Backtesting Results and Strategy Performance
This indicator is specifically designed for pullback trading with optimized risk-reward ratios in trend-following strategies. Below are the detailed backtesting results from our proprietary strategy implementation:
BTCUSDT Performance (Binance)
* Test Period: Approximately 7 years
* Risk-Reward Ratio: 2:1
* Take Profit: 8%
* Stop Loss: 4%
Key Metrics (BTCUSDT):
* Net Profit: +2,579%
* Total Trades: 551
* Win Rate: 44.8%
* Profit Factor: 1.278
* Maximum Drawdown: 42.86%
ETHUSD Performance (Binance)
* Risk-Reward Ratio: 4.33:1
* Take Profit: 13%
* Stop Loss: 3%
Key Metrics (ETHUSD):
* Net Profit: +8,563%
* Total Trades: 581
* Win Rate: 32%
* Profit Factor: 1.32
* Maximum Drawdown: 55%
Strategy Highlights:
* Optimized for pullback trading in strong trends
* Focus on high risk-reward ratios
* Proven effectiveness in major cryptocurrency pairs
* Consistent performance across different market conditions
* Robust profit factor despite moderate win rates
Note: These results are from our proprietary strategy implementation and should be used as reference only. Individual results may vary based on market conditions and implementation.
Important Considerations:
* The strategy demonstrates strong profitability despite lower win rates, emphasizing the importance of proper risk-reward ratios
* Higher drawdowns are compensated by significant overall returns
* The system shows adaptability across different cryptocurrencies with consistent profit factors
* Results suggest optimal performance in volatile crypto markets
Real Trading Examples
BTCUSDT 4-Hour Chart Analysis
Example of pullback strategy implementation on Bitcoin, showing clear trend definition and entry points
ETHUSDT 4-Hour Chart Analysis
Ethereum chart demonstrating effective signal generation during strong trends
BTCUSDT Detailed Signal Example (15-Minute Scalping)
Close-up view of signal generation and trend confirmation process on 15-minute timeframe, demonstrating the indicator's effectiveness for scalping operations
Chart Analysis Notes:
* Green and red zones clearly indicate trend direction
* Multiple timeframe confirmation visible through different Supertrend levels
* Clear entry signals during pullbacks in established trends
* Precise stop-loss placement opportunities below support levels
Implementation Guidelines:
* Wait for main trend confirmation from Factor 3 (2.618)
* Enter trades on pullbacks to Factor 2 (1.618)
* Use Factor 1 (0.618) for fine-tuning entry points
* Place stops below the relevant Supertrend level
Footnotes:
* Charts provided are from Binance exchange, using both 4-hour and 15-minute timeframes
* Trading view screenshots captured during actual market conditions
* Indicators shown: Multi Fibonacci Supertrend with all three factors
* Time period: Recent market activity showing various market conditions
Important Notice:
These charts are for educational purposes only. Past performance does not guarantee future results. Always conduct your own analysis and risk management.
Disclaimer
This indicator is for informational purposes only. Past performance is not indicative of future results. Always conduct proper risk management and due diligence.
License
Open source under MIT License
Author's Note
Contributions and suggestions for improvement are welcome. Please feel free to fork and enhance.

Market Crashes/Chart Timeframes HighlightThis extremely helpful indicator allows you to highlight 7 custom date-based timeframes on your charts.
The default dates selected are what I consider to be the most significant 7 most recent market declines, including and since the 87 flash crash.
Note: The default dates are approximate but good enough to highlight the key timeframes of these pullbacks/crashes/corrections.
It's simple to use and does exactly what it should.
I created this indicator to make it easier when looking at the overall story of a chart. I found it helpful to highlight these areas to see how a market or equity has responded during these significant market pullbacks.
The highlight alone I’ve found helpful, and it becomes more powerful if you combine it with your own trusted trade system.
Also, to get the most out of using the default dates it’s important to understand the narrative behind each pullback/crash. Here’s the list of what I consider significant pullbacks:
Black Monday - Oct 87
1990s Recession - Jul 90 to Mar 91
Dot Com Bubble - 2000 to 2002 or so
Real Estate 2008 Crisis - I choose 2007-2009 to cover full insider knowledge and aftermath
2016 - 2018 - This isn't seen as a pullback, but I have it as significant because in many markets and equities, this was an almost equal percentage pullback as 2008. See Notes below
2020 Crash - Covid-19 and related shenanigans pullback
April 2021 to August 2022 - I believe we are in a current SHORT cycle so I've highlighted April 2021 as the start of what might be the start of a major decline testing Dot Com or lower levels.
A few notes on the above.
You'll find on most of the pullbacks listed above most equities and related markets behave similarly or have similar patterns.
The 2016-18 pullback is the most difficult to track. For instance, GE in this timeframe had a -80% decline, whereas BA depending on how you want to measure it had a 50-110% gain.

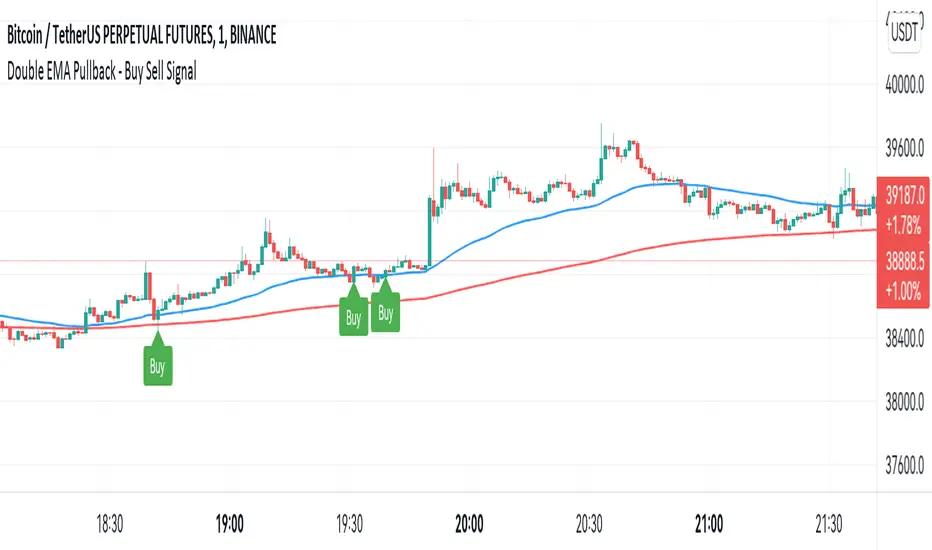
Double EMA WIth Pullback Buy Sell Signal - Smarter AlgoBuilt with love "Double EMA With Pullback Buy Sell Signal "
This indiator will help you to find a Double EMA Pullback Signal
You can combine with your own strategy, or use this purely
DISCLAIMER :
Measure the risk first before use it in real market
Backtest The Strategy was very important, so you know the probability
Fundamentally Logical :
Pullback (Some Previous candle is Red for Bull Pullback vice versa)
the Entry candle must be a Candlestick Pattern
Features :
1. Double EMA
2. Pullback Signal
How to use it :
1. Adjust the Pullback Backstep
2. Adjust the EMA Period
3. Adjust the Style to your preferences
Regards,
Hanabil
Smarter Pullback + Candlestick Pattern (Steven Hart)Built with love "Smarter Pullback + Candlestick Pattern"
This indiator will help you to find a Pullback + Candlestick Pattern, inspirated by Steven Hart
You can combine with your own strategy, or use this purely
DISCLAIMER :
Measure the risk first before use it in real market
Backtest The Strategy was very important, so you know the probability
Fundamentally Logical :
Pullback (Some Previous candle is Red for Bull Pullback vice versa)
the Entry candle must be a Candlestick Pattern
Features :
1. Engulfing
2. Hammer & Shooting Star
3. Doji
How to use it :
1. Adjust the Pullback Period
2. Check and Uncheck the Pattern you want to see
3. Adjust the style to your favourite
Regards,
Hanabil

Close to SupertrendMany a times, we have seen that the price closing in towards supertrend reverses.
This indicator gives signal that identifies high / low of any candle if near the down / up supertrend line by a defined margin using arrow signals.
I've simply re-used readily available supertrend indicator source code and just modified it to these signals. So, almost all of the source code is not mine.
Enter the short / long position when arrow signal appears.
SL / trend reversal will be mandatorily at close of a candle above or below the supertrend line, and the supertrend changes direction.
Hope this indicator comes handy for you.

Zigzag Trend/Divergence DetectorPullbacks are always hardest part of the trade and when it happen, we struggle to make decision on whether to continue the trade and wait for recovery or cut losses. Similarly, when an instrument is trending well, it is often difficult decision to make if we want to take some profit off the table. This indicator is aimed to make these decisions easier by providing a combined opinion of sentiment based on trend and possible divergence.
⬜ Process
▶ Use any indicator to find trend bias. Here we are using simple supertrend
▶ Use any oscillator. I have added few inbuilt oscillators as option. Default used is RSI.
▶ Find divergence by using zigzag to detect pivot high/low of price and observing indicator movement difference between subsequent pivots in the same direction.
▶ Combine divregence type, divergence bias and trend bias to derive overall sentiment.
Complete details of all the possible combinations are present here along with table legend
⬜Chart Legend
C - Continuation
D - Divergence
H - Hidden Divergence
I - Indeterminate
⬜ Settings
▶ Zigzag parameters : These let you chose zigzag properties. If you check "Use confirmed pivots", then unconfirmed pivot will be ignored in the table and in the chart
▶ Oscillator parameters : Lets you select different oscillators and settings. Available oscillators involve
CCI - Commodity Channel Index
CMO - Chande Momentum Oscillator
COG - Center Of Gravity
DMI - Directional Movement Index (Only ADX is used here)
MACD - Moving average convergence divergence (Can chose either histogram or MACD line)
MFI - Money Flow Index
MOM - Momentum oscillator
ROC - Rate Of Change
RSI - Relative Strength Index
TSI - Total Strength Index
WPR - William Percent R
BB - Bollinger Percent B
KC - Keltner Channel Percent K
DC - Donchian Channel Percent D
ADC - Adoptive Donchian Channel Percent D ( Adoptive-Donchian-Channel )
▶ Trend bias : Supertrend is used for trend bias. Coloring option color candles in the direction of supertrend. More option for trend bias can be added in future.
▶ Stats : Enables you to display history in tabular format.
Overview of settings present here:
⬜ Notes
Trend detection is done only with respect to previous pivot in the same direction. Hence, if chart has too many zigzags in short period, try increasing the zigzag length or chart timeframe. Similarly, if there is a steep trend, use lower timeframe charts to dig further.
Oscillators does not always make pivots at same bar as price. Due to this some the divergence calculation may not be correct. Hence visual inspection is always recommended.
⬜ Possible future enhancements
More options for trend bias
Enhance divergence calculation. Possible options include using oscillator based zigzag as primary or using close prices based zigzag instead of high/low.
Multi level zigzag option - Can be messy to include more than one zigzag. Option can be added to chose either Level1 or Level2 zigzags.
Alerts - Alerts can only be added for confirmed pivots - otherwise it will generate too many unwanted alerts. Will think about it :)
If I get time, I will try to make a video.


Sizing GuideThis indicator helps you defining your max sizing, depending on the max $$$ amount you're willing to risk against a specific exponential moving average (or VWAP, default is the 13ema).
You can define your max risk amount and your max allowed sizing. The indicator would suggest the best sizing in order to risk only up to the amount you are comfortable with on a potential trade.
Moreover, the column bar would turn yellow/red if the divergence is above a certain threshold (default are yellow > 1.50% and red > 2.75%, green otherwise).

Pullback Trading [Fhenry0331]The indicator is taken from Alexander Elders "Triple Screen System," minus using the Weekly MACD as a filter/trend. I believe waiting for the force index and the weekly MACD histogram to line-up is uber conservative and a trader will miss too many signals (In my opinion).
The indicator is for a pullback trader. A trader that waits for a trend to develop then enters on a pullback.
The indicator defines an uptrend start: as the 13 ema crossing above the 26 ema. It defines a downtrend start: as the 13 ema crossing below the 26 ema.
The pullback in an uptrend: 13 ema is above the 26 ema. Elders-Force-Index is below the zero line. Price low has crossed below the 13 ema (one can also say price closes below the 13 ema if they so wish).
The pullback in a downtrend: 13 ema is below the 26 ema. Elders-Force-Index is above the zero line. Price high has also crossed above the 13 ema.
Please note that the pullback signals do not necessitate an automatic buy or sell (the instrument can be still pulling back deeper and not ready to resume it's trend.) One should place orders above (long) or below (short) bars with the pullback signals. Do so on signals until orders are filled.
Although the indicator is meant for pullbacks one can make an aggressive entry at the onset of a crossover of ema's.
For clarity background colors has been added to the indicator.
works well on daily time frame. Also look at intraday (5) minute time frame on trending stocks (news, earnings, volume, etc.)
Keep It Simple.
Enjoy!

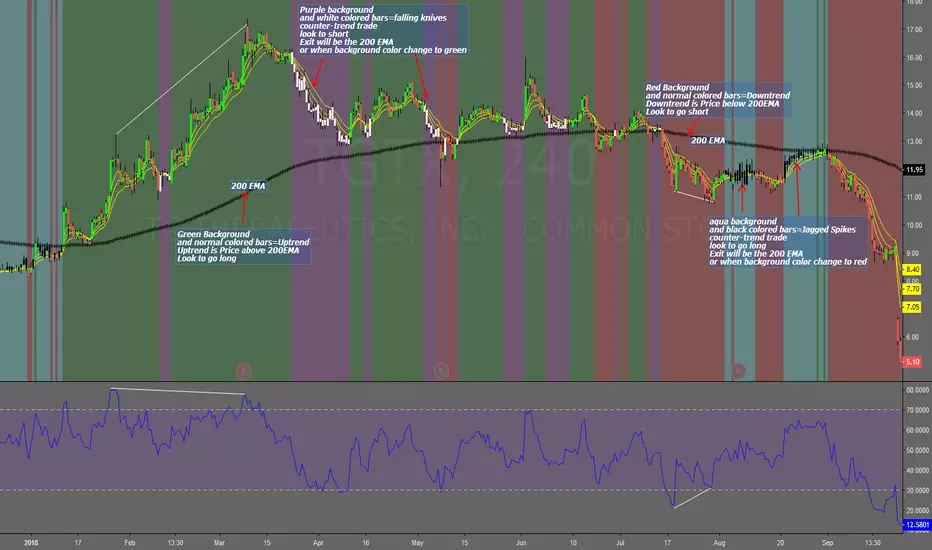
Falling Knives Jagged SpikesThe purpose of this script is to trade with the trend, trade trend continuation, and counter-trend trades.
Uptrend is price above 200 ema: Background is green and the bar colors are normal
Downtrend is price below 200 ema: Background is red and the bar colors are normal
Counter-trend to uptrend--Bar colors are white and the background is purple
counter-trend to downtrend--Bar colors are black and the background is aqua.
How to use:
Uptrend (green background): Only go long
Downtrend (red background): only go short
Counter-trend to uptrend/downtrend (white bars/black bars): Take counter-trend trade when price is a substantial distance from the 200 EMA. Best if there was a divergence with an oscillator. A lot of times these are just deep pullbacks or rallies.
trend continuation: In uptrend, after falling knives, and trend continues up (background turns to green) look to buy, you are getting a great price on the asset. Same for downtrend.
Keep in mind that nothing is perfect, and to of-course test everything.
Best of luck in all you do. Get money.
Complete Trend Trading System [Fhenry0331]This system was designed for the beginner trader to make money swing trading. Your losses will be small and your gains will be mostly large. You will show consistent profit. Period.
The system works on any security you like to trade. I used GBPUSD as an example because of the up swing and down swing it had recently. I tried to put as much information of how the system works in the chart. Hope it helps and is not to cluttered.
I will reiterate how the system works here: Everything is based off of closed price.
Legend
Uptrend: Buy
Green bar: initial start of an uptrend or uptrend continuing. Place order above that bar. If the initial bar does not stray too far from the MVWAP , I will place orders above subsequent bars if no filled occurred.
If initial start of the trend is missed, I will wait for the pullback. A pullback is a close below the MVWAP, and a close above the EMA (Low), RSI is above 50. Orders are placed above the pullback bars with plotted char "B" and also plotted green triangle up. Again orders are placed above those bars. the bars do not notate automatic buys. Don't chase anything. You will miss the initial bar on something because of news or earnings and it rocket up. Just wait, it will pullback. If it doesn't, to hell with it, on to the next.
Take profits: In the indicator you will see "T." That notates to take some profits. It is a suggestion. I was always told to take profits into spikes, as well as you can never lose money if you take profits. Up to you if you want to scale out and take the suggested profits or not.
Exit Completely: In an uptrend, close your entire position on bars colored yellow or red. (Again, closed bars)
In uptrend bars colored orange and black, do nothing, they are just pullback bars. Look for the buy pullback signal, then follow pullback buy rules for an uptrend.
Downtrend: Short
Red bar: initial start of a downtrend or downtrend continuing. Place order below the bar. If the initial bar does not stray too far fro the MVWAP, place orders below subsequent bars.
If initial start on the downtrend is missed, wait for the pullback. A pullback is a close above the MVWAP, and close below the EMA(Low). RSI is below 50. Orders are placed below the pullback bars with the plotted char "S" and also plotted red triangle. Again those bars are not automatic shorts, orders are placed below them. Don't chase anything. Wait for price to come into your plan. The idea FOMO is the stupidest thing ever, how can you miss out on something when it is always there. The market is always there and something will come into your zone. Chill.
"T": same as in uptrend, suggestion to take some profits.
Exit Completely: In a downtrend, close your entire position on bars colored orange or green.
In downtrend you will see bars colored yellow and black, do nothing, they are pullback bars. Look for the pullback short signal and follow pullback short rules.
If you have any questions get at me. Take a look at it on what you trade. Flip it through different securities.
Best of luck in all you do.
P.S. You should not take a trade right before earnings. You should also exit a trade right before earnings.
