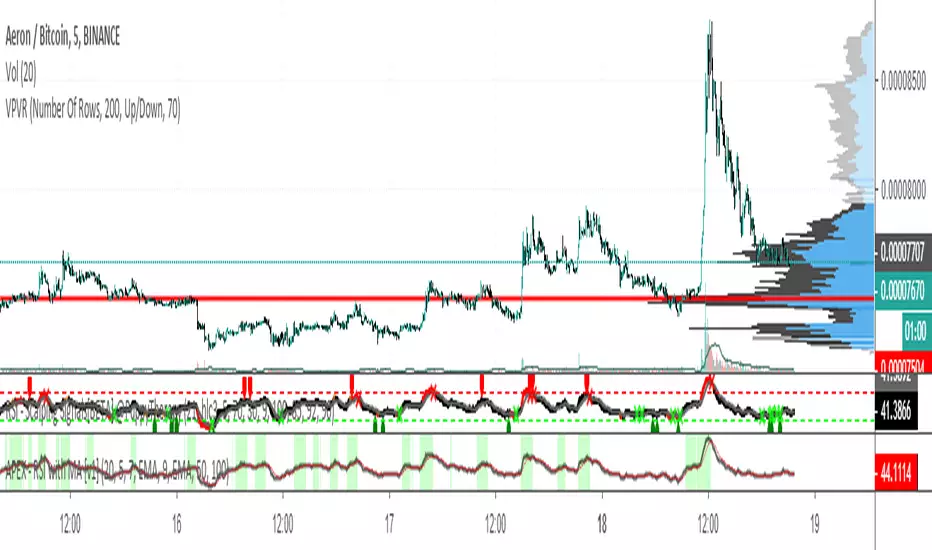
Volume @PuppyTherapyWell, you know what its Volume but I don't color it based on price but it just stays grey the moment it reaches a critical threshold level it is orange and spikes are very much red.
You can also set alerts on those spikes to make sure you are not missing the action.
Puppytherapy

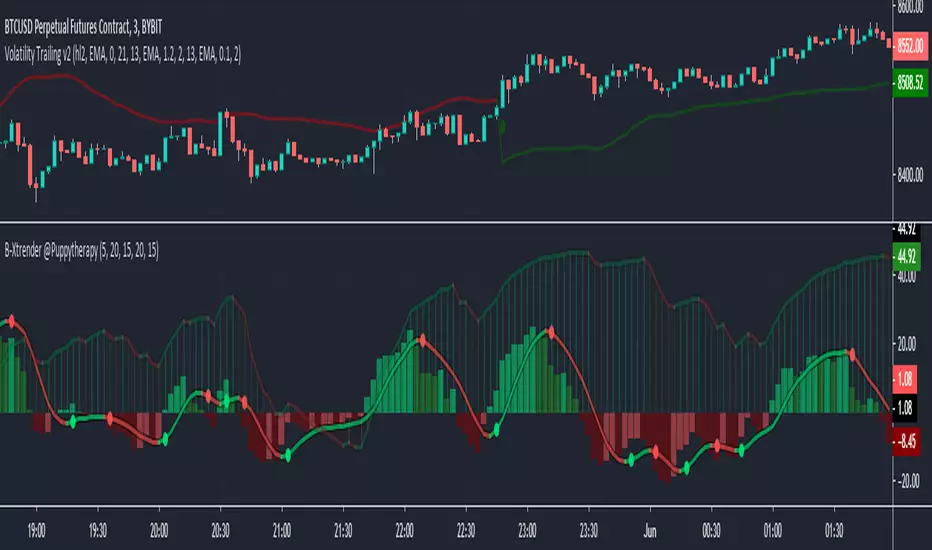
B-Xtrender @PuppytherapyI have recreated a trend following indicator published in IFTA Journal by Bharat Jhunjhunwala. It is mainly to be traded on big timeframes.
For anyone looking into the indicators please have in the source below where logic behing the indicator is nicely explained.
ifta.org
The only thing I added is a T3 moving average with momentum shift signals for earlier signals in some cases.
APEX - Parabolic SARSorry to all my fans I have been overwhelmed with work and I need a couple of weeks off ... but now I have vacation time and I should be fit in a bit.
This is a for meant for the Apex Trader I very much enjoy and is long overdue.
Looks like the normal implementation of PSAR in TA-Lib is using no start compared to the Standard that TV delivers thus to make the user more comfortable this tiny change :)
Wish you all good luck and a lot of love!

MFI Reloaded @ByPuppyTherapyThe goal was to create a nicer cleaner and yet a practical version of the
MFI indicator. MFI or Money Flow Index is a momentum-based oscillator. It is very similar to the RSI but enhanced with
volume in its calculation.
This version of MFI features :
- Cleaner visualization
- EMA Band Ribbon to see the trend without noise
- Long Term MFI smoothed via T3 that sets the actual trend
- basic TDI like functionality with two bands and Sharkfins / Hooks
- the Sharkfins / Hook signals are generated in the direction of the MFI Trend

Smooth Moving Average Zones @PuppyTherapyThis script is basically a showcase of what you can graphically do to a moving average.
You have access to
2 sets of 4 moving averages each of those can use HA Candles as a source ( calculated in the script will not repaint if you are concerned with that )
additional smoothing to each set
a multitude of moving average types I am too lazy to type out ( please give me a thumbs up for honesty )
each moving average has a shade + zone
If you happen to like it and use just a few of those I would suggest you remove smoothing as it eats a lot of performance of making your own script of what you actually use to really bost with the performance. I am fully okay with you copying and sharing this idea. Just remember to share the colors!
PS: I would like to thank pinescripters RicardoSantos / LucF / everget !

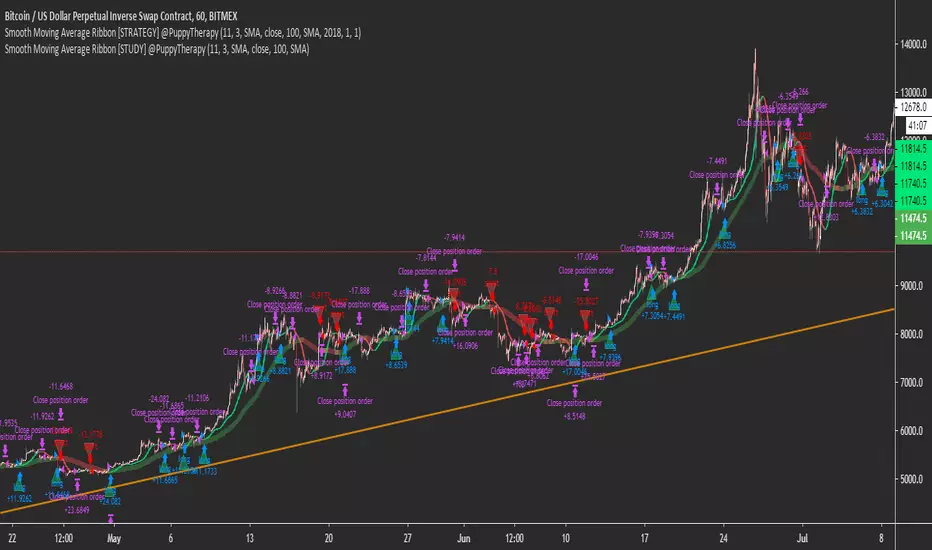
Smooth Moving Average Ribbon [STUDY] @PuppyTherapyThe Smooth moving average ribbon script is an enhancement of the script I posted yesterday. But will help you also create a very simple trend-following strategy or a simple trend-following filter.
You are able to select from a large variety of moving averages add Heikin Ashi Candles as a source and also add additional smoothing to every single of the moving averages.
The Study script is equipped with alerts.
It is a showcase that a simple strategy like buy when we going up and sell when we going down actually works especially on a bigger timeframe.
Thanks to all supporters and everget for some of the moving average scripts.
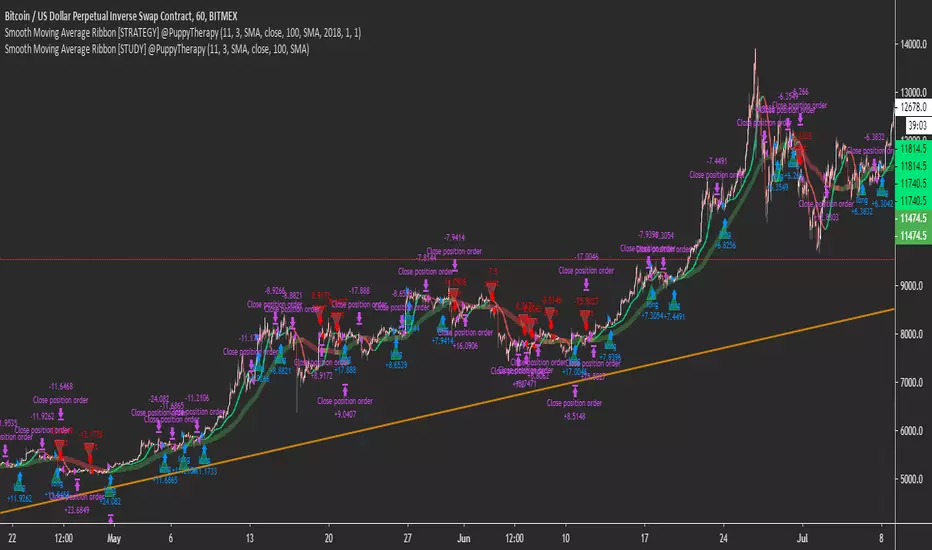
Smooth Moving Average Ribbon [STRATEGY] @PuppyTherapyThe Smooth moving average ribbon script is an enhancement of the script I posted yesterday. But will help you also create a very simple trend-following strategy or a simple trend-following filter.
You are able to select from a large variety of moving averages add Heikin Ashi Candles as a source and also add additional smoothing to every single of the moving averages.
The Strategy is using the basic backtesting engine.
It is a showcase that a simple strategy like buy when we going up and sell when we going down actually works especially on a bigger timeframe.
Thanks to all supporters and everget for some of the moving average scripts.
Smooth Moving Average [STUDY] @PuppyTherapyThe Smooth moving average script combo combines the ability to help you create a very simple trend-following strategy or a simple trend-following filter.
You are able to select from a large variety of moving averages add Heikin Ashi Candles as a source and also add additional smoothing to every single of the moving averages.
The Study is equipped with alerts.
It is a showcase that a simple strategy like buy when we going up and sell when we going down actually works especially on a bigger timeframe.
Thanks to all supporters and everget for some of the moving average scripts.

Smooth Moving Average [STRATEGY] @PuppyTherapyThe Smooth moving average script combo combines the ability to help you create a very simple trend-following strategy or a simple trend-following filter.
You are able to select from a large variety of moving averages add Heikin Ashi Candles as a source and also add additional smoothing to every single of the moving averages.
The Strategy is using the Tradingview backtesting framework.
It is a showcase that a simple strategy like buy when we going up and sell when we going down actually works especially on a bigger timeframe.
Thanks to all supporters and everget for some of the moving average scripts.

Haos Visual @PuppyTherapyToday I am bringing to you my interpretation of the Haos Visual Oscillator with a trend which is derived from two Williams R% indicators smoothed by T3. I have been inspired by this idea in the following post.
www.prorealcode.com
Is a pretty unique indicator indeed that due to its smoothing provide nice entries. Your Entry signal is when the histogram, which is the longer term willy is green that signalizes strong bullish momentum. If you then receive a momentum change which is the dot on the short willy or you breach the -30 to -40 area it is a strong buy signal.
Also, this is my first V4 Script thanks to Tradingview to adding to the platform :)

Cumulative Volume Delta Estimate @PuppyTherapyCumulate Volume Delta is the net difference between the buying and selling at each bar. This is then cumulated over the number of periods you define. In Orderflow trading cumulated volume delta is usually calculated with the help of market buys and market sells. Since we do have access to that kind of information as of now a different approach. I call this script an estimate due to the approach I have chosen to get the information and that is a continuous loop over smaller timeframe calls via a security function.
This approach has been publicly released here:
How to use the indicator?
- on HTF when Moving average changes color from an extreme value.
- Volume divergence - seller volume is decreasing and the price is increasing a strong buying opportunity
This indicator is just an estimate due to the approach chosen. Also, avoid using this on low Satoshi coins due to the nature of the calculation.

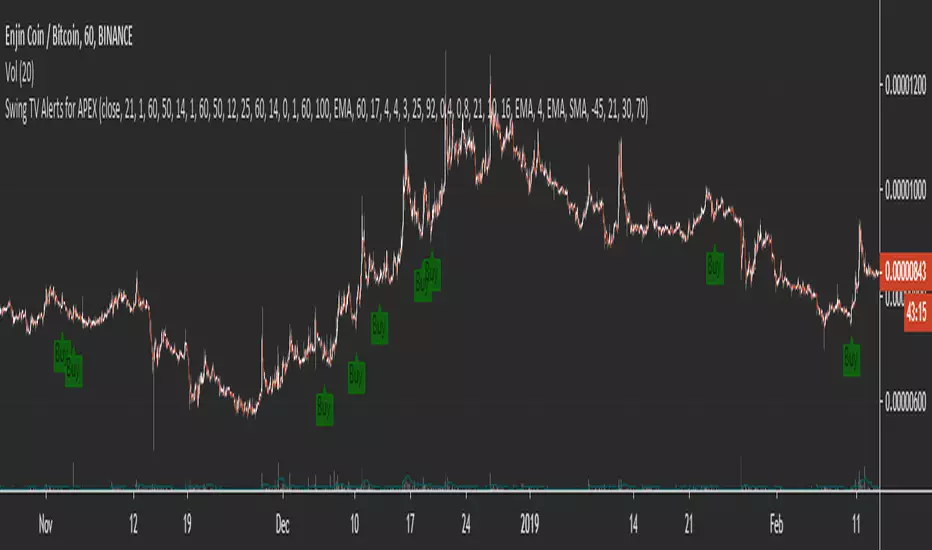
Swing TV Alerts for APEXI have put a collection of my favorite scripts together so that everyone can make a simple entry trading system with it.
You first have to think about using a trend filter there are several of them you can pick I would advise using at least one. After that, you select a combo of the most popular indicators on Tradingview for an exact entry. SO far my personal favorite is Godmode / Wavetrend.
Then you add alerts and either trade manually or use one of the services that allow you to put buy orders vie alerts such as Autoview / Profitview /Profit trailer or my personal favorite APEX.
I have hidden the code cause it's messy but you don't need to worry there is zero repainting.
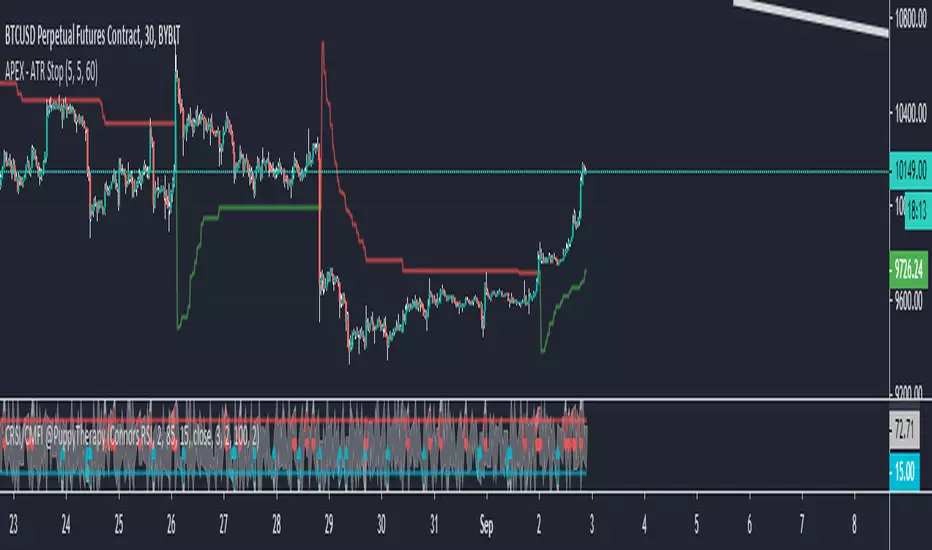
APEX - ATR StopThe ATR Stops are mainly used as an advanced trailing technique, but they can also be used as a trend filter.
When you add the ATR Stop in APEX you will get access to 2 signals. The Stop loss shows the value where the trailing is occurring. The sentiment on the other side shows you what bias does this indicator give 1 = long and -1 = short. To play with different values please use the following indicator on TV. Will help you to finetuned the length of ATR and the multiplier value.
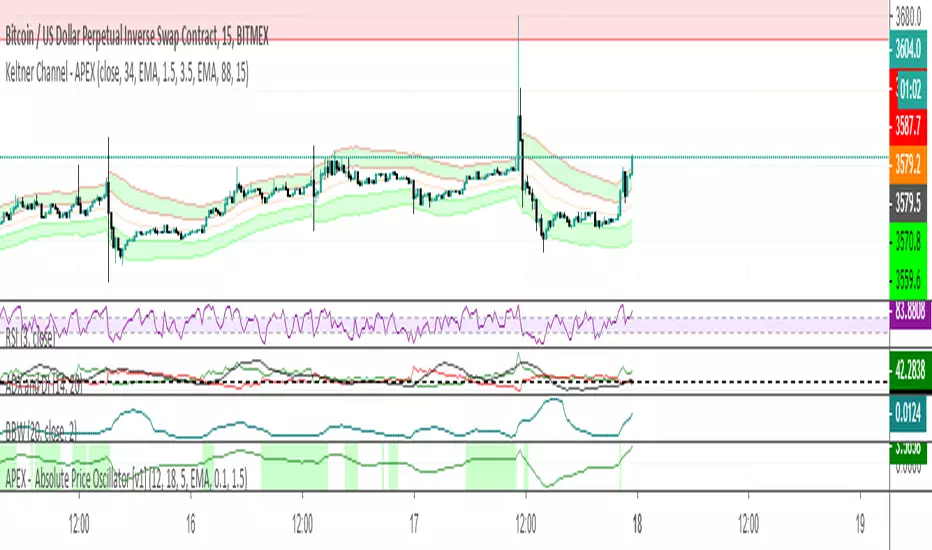
APEX - ADX/ADXR/DI+/DI- [v1]Average Directional Movement Index – ADX can be used to help measure the overall strength of a trend. The ADX indicator is an average of expanding price range values. The ADX is a component of the Directional Movement System developed by Welles Wilder. This indicator on its own does not give you a direction but instead measure the strength of the trend. In general values above 20 are considered a trending environment above 30 is then a strong trend and above 50 is a very strong trend.
Average Directional Movement Rating is based on the momentum change of the ADX itself. It is calculated by adding two ADX values (the current value and a value n periods back), then dividing by two. This additional smoothing makes than the ADXR slightly less responsive than ADX but helps to avoid noise.
Minus Directional Indicator (-DI) measures the presence of a downtrend and is part of the Average Directional Index (ADX). If -DI is sloping upward, it's a sign that the price downtrend is getting stronger. The Positive Directional Indicator (+DI) is a component of the Average Directional Index (ADX) and is used to measure the presence of an uptrend. When the +DI is sloping upward, it is a signal that the uptrend is getting stronger. In general values above 20 are considered a trending environment above 30 is then a strong trend and above 50 is a very strong trend.
APEX - ROC MA [v1]The rate of change also know as ROC is a momentum indicator that describes changes over a specific period of time. In general positive values describe for the asset to have a positive momentum change whereas negative values will give a negative momentum change.
You will be able to add moving averages or additionally smooth the ROC to create a more stable indicator for filtering or entries.
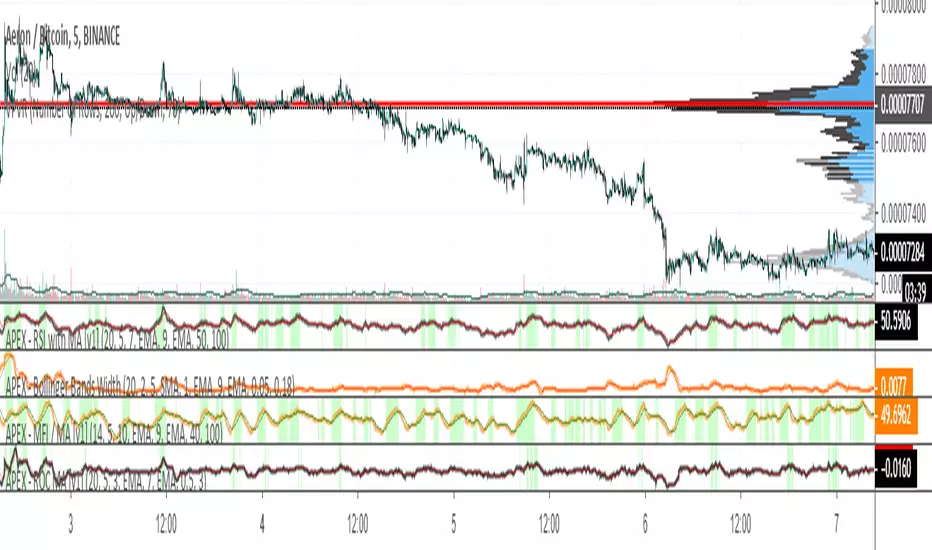
APEX - MFI / MA [v1]The Money Flow Index is a volume indicator used for measuring buying and selling pressure. This is done by analyzing both price and volume. The MFI's calculation generates a value that is then plotted as a line that moves within a range of 0-100, making it an oscillator. When the MFI rises, this indicates an increase in buying pressure. When it falls, this indicates an increase in selling pressure. The Money Flow Index can generate several signals, most notably; overbought and oversold conditions and divergences.
You are also able to add addition smoothing and or a moving average on top of the MFI. This can help you trade only areas with increasing buying pressure.
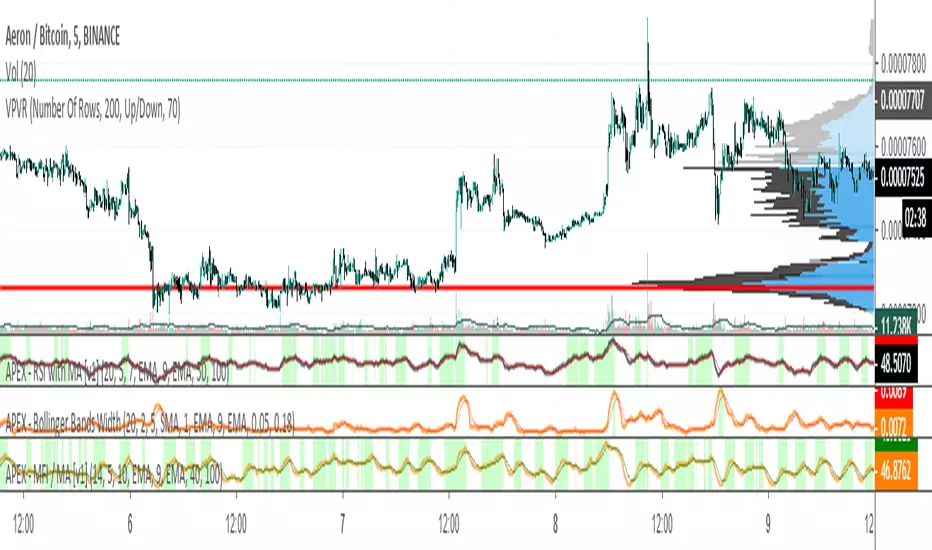
APEX - RSI with MA [v1]The Relative Strength Index (RSI) is as a momentum oscillator originally developed by J. Welles Wilder. The indicator is calculated as a Ratio of higher closes to lower closes on a scale of 0 to 100.
If the indicator reaches values above 80 (some use 70 or 75) it means the instrument is overbought and if the values are below 20 (25 or 30) it is oversold. But be aware those are just terms oversold/overbought main oversold /overbought for a long time. In general values over 50 mean your instrument is in a bullish state and below 50 it is in a bearish state.
The indicator is most commonly used with the length of 14. Some use RSI in a much more aggressive manner with the length of 2 (also known as Connors RSI). Whereas others have used length up to 20.
Use greater length values on the lower the timeframe to help with the noise. On larger time frames, you should be looking at lower length values.
APEX - Aroon / Aroon Oscillator [v1]Simple Script that combines Aroon and Aroon Oscillator with MTF functionality for APEX.
Aroon
The Aroon also know as Aroon Up/Down will help you determine the trend of the asset of if the asset is ranging. The indicator consists of two lines the AroonDown and the Aroon Up.When Aroon Up reaches 100, a new uptrend may have begun. If it remains persistently between 70 and 100, and the Aroon-Down remains between 0 and 30, then a new uptrend is underway.If the Aroon-Up crosses above the Aroon-Down, then a new uptrend may start soon. Conversely, if Aroon-Down crosses above the Aroon-Up, then a new downtrend may start soon. When Aroon-Up reaches 100, a new uptrend may have begun. If it remains persistently between 70 and 100, and the Aroon-Down remains between 0 and 30, then a new uptrend is underway.
Aroon Oscillator
The Aroon Oscillator is the difference between Aroon-Up and Aroon-Down. These two indicators are usually plotted together for easy comparison, but chartists can also view the difference between these two indicators with the Aroon Oscillator. This indicator fluctuates between -100 and +100 with zero as the middle line. An upward trend bias is present when the oscillator is positive, while a downward trend bias exists when the oscillator is negative.

APEX - Absolute Price Oscillator [v1]The Absolute Price Oscillator is calculated as a difference of two moving averages of an asset and is expressed as an absolute value. It rates the strength of the trend. This Oscillator can be used primarily as a filter for stronger trends or for coin specific strategies.
Values are a coin and Moving average base specific.
APEX - WaveTrend [v1]WaveTrend is a smoothed oscillator which enables it to detect true reversals in an extremely accurate manner. The beauty of this indicator is that does not generate signals during choppy sideways markets.
The basic settings are 10 / 3 / 4 these are very aggressive settings, that will generate a lot of signals in all even not so volatile markets. If you need high-quality signals you settings close to 10 / 3 /21. The strongest buy/sell signals are given when the cross occurs above or below the threshold. In the 10 / 3 / 4 you threshold for buy should be around -90 values. If you use the very smoothed variant the threshold will be around -45 to -50 values.
This indicator will be first available in APEX v1 currently being beta tested.

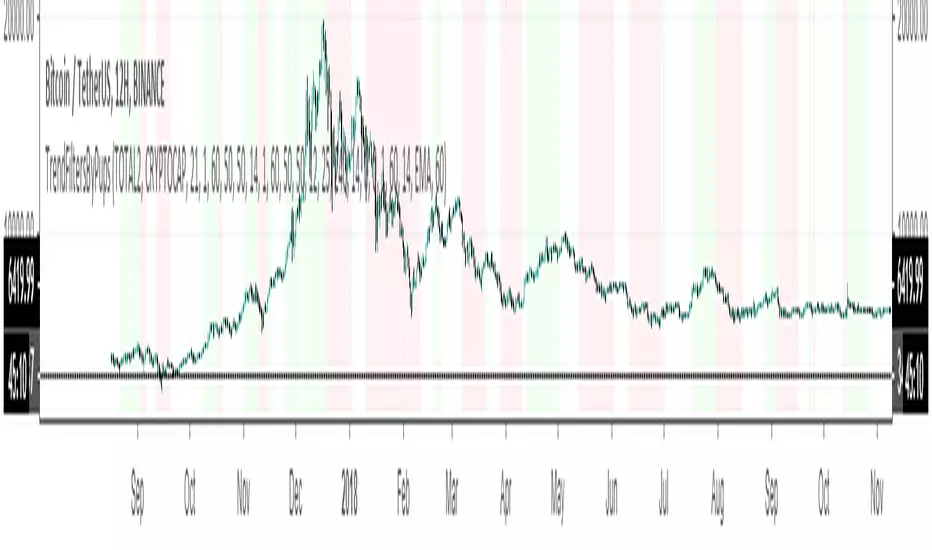
Trend Filters 101 @PuppyTherapyThis script is a summary of the most common filters to color bullish (lime) / bearish(red) and neutral scenarios (grey). The conditions between the individual filters is AND.
- Moving average Direction / Price above
- ADX
- RSI
- ROC
- MFI
Swing Trader @PuppyTherapy Instead of pushing a lot of scripts I have turned my focus on the actual trading. From this moment on forward, I will publish very little scripts but I will focus solely on quality and actually usability as a trading strategy.
This script combines the following script:
- Wavetrend from Lazybear is probably one of the best single scripts up there the only issue it had is a lot of times the signal comes too soon
- Percentage Rank Spread between Two Moving Averages to focus only on important areas
- RSI and Stochastic to pinpoint entry points
I will not give nor show you the code. Otherwise, the indicator is FREE to use just add it to the chart.
Best timeframes to use on: ( Finetuned for BTCUSD and ETHUSD )
- 1h
- 30m
- 15m
- It works in most markets but avoids going again strong trending markets !
- I recommend you to have an SL use a 2x - 3x multiple ATR
- use Conservative settings Aggressive is only for Advanced users

[RESEARCH] TDI with MAThis script is for research purposes. I have used the older RSI calculation (not the TV function) and added the possibility to not use only classic RMA for the RSI calculation but up to 17 different MAs. Added BBS basically TDI and Divergences from Libertus. Happy hunting and if you find something useful dons hesitate to share it :)
