Quarterly Earnings FQ & FYQuarterly Earnings FQ & FY — Financial Metrics Tables On Chart
This indicator visually presents key quarterly and annual financial metrics directly on your TradingView chart via customizable tables. It brings fundamental analysis data into your technical charts for seamless decision-making.
Core Features:
Displays two dynamic tables for Quarterly (FQ) and Annual (FY) financial data.
Metrics include EPS, Sales, P/E ratio, Operating Margin, Return on Assets (ROA), and Return on Equity (ROE).
User-selectable visibility for each metric and their Year-over-Year (YoY) and Quarter-over-Quarter (QoQ) change percentages.
Customizable table position with dropdown settings for flexible placement anywhere on the chart.
Color customization options for headers, positive and negative changes, backgrounds, and a dark mode toggle.
Indian-style comma formatting for sales values with clear display (sales figures omit plus/minus signs for readability).
Live financial data sourced from TradingView’s financial request functions, ensuring accuracy and timeliness.
Designed for traders and investors who want quick, near real-time access to fundamental performance without leaving the chart interface.
How It Works:
The indicator fetches financial data like earnings per share, revenue, and margins each quarter and year, then displays it in neatly formatted tables. Positive and negative changes in metrics are color-coded for intuitive analysis. Sales figures are formatted specifically to show clean, localized numbers without distracting signs. Users can tweak which columns to show and where the tables appear on the screen.
QE

Smart Investor - Quarterly Earnings by tarunlalwani007OVERVIEW
Smart Investor - Quarterly Earnings displays comprehensive financial data and moving averages directly on your charts. It shows quarterly/yearly earnings alongside customizable moving averages across multiple timeframes, providing both fundamental and technical analysis in one tool.
This tool is designed purely for analysis purposes. No buy or sell recommendations should be made based solely on the information it provides. Always perform your own due diligence and combine multiple sources of information for trading decisions.
FEATURES
Financial Data Analysis
Displays quarterly (FQ) and yearly (FY) financial metrics
Works with both stocks and futures contracts
Customizable metrics with comparison capabilities
Flexible table positioning options
Multi-Timeframe Moving Averages
Daily, Weekly, and Monthly moving averages adapt to chart timeframe
Support for both EMA and SMA with customizable parameters
Color-coded for easy identification of different timeframes
Company Information Display
Information tags for quick company insights
Display key financial metrics and market performance indicators
SME status identification for small/medium enterprises (only for NSE and BSE India)
FNO and lot size information for derivatives
CALCULATION METHODS
Data Sources
Financial metrics (EPS, Sales, Total Shares) are sourced directly from TradingView's financial API
Price data is obtained using appropriate request functions for the current symbol
Header and Tag Calculations
Current Values: All header and tag metrics use the latest available close price
Market Cap: Latest Close Price × Total Outstanding Shares
Free Float Market Cap: Latest Close Price × Free Float Shares
Free Float Percentage: Obtained directly from TradingView financial data
P/E Ratio: Market Cap / TTM Net Income
52-Week Performance:
Down from 52W High: ((Current Close - 52W High) / 52W High) × 100
Up from 52W Low: ((Current Close - 52W Low) / 52W Low) × 100
Table Calculations
Historical Values: Table metrics use price data from the corresponding quarter/year
Quarter-over-Quarter (QoQ) Change: ((Current Value - Previous Quarter Value) / Previous Quarter Value) × 100
Year-over-Year (YoY) Change: ((Current Value - Value from Same Quarter Last Year) / Value from Same Quarter Last Year) × 100
Quarter names are determined based on the current month: Jan/Feb → Dec, Mar/Apr/May → Mar, Jun/Jul/Aug → Jun, Sep/Oct/Nov → Sep. Each quarter is labeled with its end month and year (e.g., "Mar-2024", "Jun-2024").
Moving Average Implementation
Moving Averages: Calculated based on chart timeframe (daily, weekly, monthly)
EMA/SMA: Uses standard formulas with configurable periods
Included with financial data to provide a complete analysis tool in a single indicator
CUSTOMIZATION OPTIONS
Financial Metrics
The following metrics can be selected for both quarterly and yearly tables:
Sales (Revenue)
EPS (Earnings Per Share)
OPM (Operating Profit Margin)
P/E Ratio
PEG Ratio
Free Float (percentage and value)
Market Cap
PAT (Profit After Tax)
Display Options
Comparison Visualization: Percentage mode, dots mode, or combined
Layout: Multiple table positions, adjustable text size
Themes: Light and dark theme support
History: Display up to 8 periods of historical data
Header Information
Company description
Market capitalization
Free float information
Listing year
Return on Equity (ROE)
Industry/Sector classification
Performance relative to 52-week high/low
FNO status and lot size
HOW TO USE
Add the indicator to your chart
Configure the metrics you want to display in the settings
Position the tables where you prefer on your chart
Customize colors and display options
Adjust moving averages to match your trading style
LIMITATIONS
Financial data availability depends on what TradingView provides for each instrument
Some calculations may show NA when underlying data is unavailable
Small market cap stocks or recently listed companies may have limited historical data
Futures contracts are detected automatically but may require manual verification
TECHNICAL NOTES
Automatic futures contract detection with calculation adjustments
SME status determined using an internal database of symbols that is manually maintained and updated
Date handling adjustments near quarter boundaries ensure consistency
All financial data is sourced directly from TradingView's financial API
Company description and sector information comes directly from TradingView symbol data

Quantitative Easing DatesThis indicator shows the beginning and the end of quantitative easing policy.
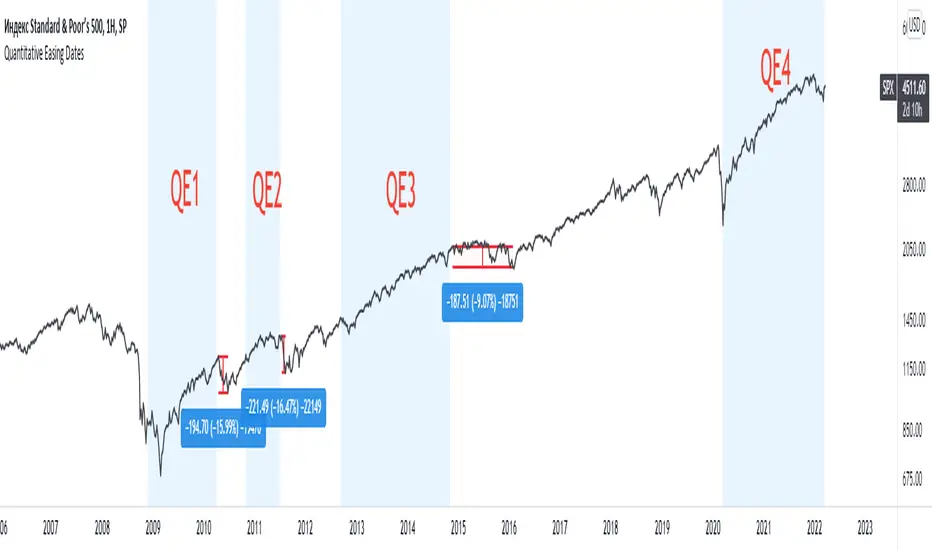
[STRATEGY] Follow the Janet YellenIn the era of central bank's helicopter money, the market will always be skyrocketing up and up given enough time.
What's the strategy to profit from indices?
Only short the market when its in a state of euphoria /irrational exuberance bubble, or sell when it is confirmed (20% drawdown). Otherwise, you really have no reason not to long at every chance.
Conclusion:
Follow the printing press like a sheep.
