ADR% / ATR / LoD dist. Table - V2ADR% / ATR / LoD Distance Table (V2) + ATR Range Lines is a simple “daily volatility dashboard” that helps you quickly judge how extended a stock is during the day and where “normal” daily movement zones sit relative to price.
It’s designed to help you answer:
“Has this stock already made most of its usual daily move?”
“Am I chasing too late?”
“Where are typical +ATR / −ATR stretch and pullback zones?”
What you’ll see
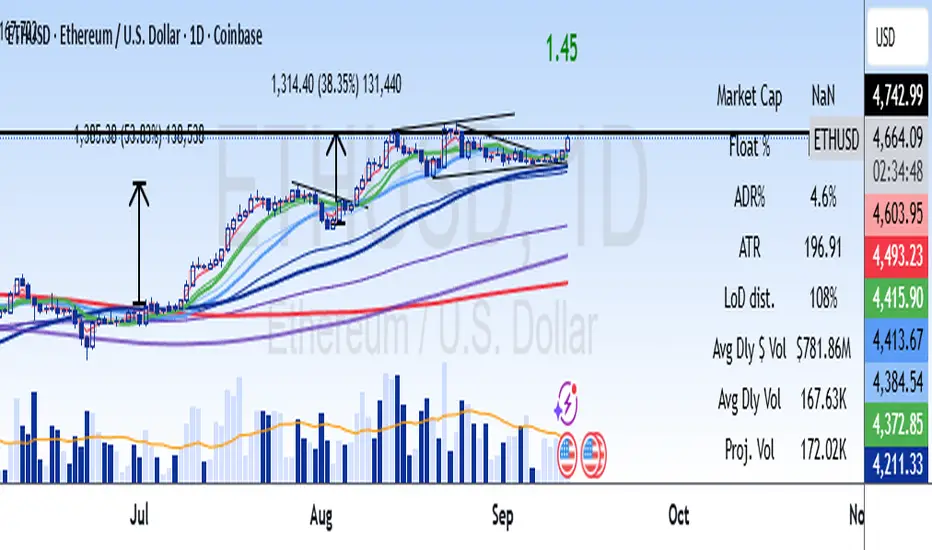
ADR% (Average Daily Range %)
Shows the stock’s typical daily travel (low → high) as a percentage.
Example: ADR% = 4% means the stock often swings ~4% in a normal day.
ATR (Average True Range)
Shows the stock’s typical daily movement in price units ($ / points).
Example: ATR = 2.50 means it often moves about $2.50 per day.
LoD dist. (Low of Day distance)
Shows how far price is from today’s Low of Day, measured relative to ATR (as a %).
Higher % = more extended away from the day’s low.
Optional: ATR Range Lines (added in this version)
You can enable two guide lines that extend to the right:
ATR Up Line = Price + ATR
ATR Down Line = Price − ATR
These act like volatility guardrails to visualize “typical daily stretch” and “typical pullback” zones.
ATR “Live vs Locked” option (important)
Lock ATR to last completed day (no intraday updates):
ON (Locked): Uses the last completed daily ATR (yesterday’s finished value).
✅ ATR stays constant all day while the market is live.
OFF (Live): ATR can update intraday as today’s daily candle expands.
✅ ATR may change during the session.
Either way, ATR is still based on your chosen ATR Length (lookback period). Locking simply prevents the ATR from drifting intraday.
How to use it (Kullamägi-style principle)
Kristjan Kullamägi’s momentum style emphasizes pressing strength when conditions are right, but also respecting extension and risk/reward. This tool helps you quantify that:
If ADR%/ATR suggests the stock already moved near its usual daily range, chasing can be lower reward.
The ATR lines help you visualize when price is in a “normal stretch zone” vs a better risk area.
Locking ATR gives you stable intraday reference levels for cleaner execution.
Tips
Use ADR% to understand whether there’s likely “room” left in today’s move.
Use LoD dist. to quickly gauge if price is already far from the day’s low (extended).
Use ATR Up/Down Lines as a simple volatility framework for entries, add-ons, and risk planning.
Keep Lock ATR ON if you prefer stable levels throughout the session.
Credits
Original indicator concept & script: ArmerSchlucker
ADR% formula credit: MikeC / TheScrutiniser and GlinckEastwoot
Modifications (V2): TradersPod
Added optional ATR Up/Down lines extending to the right
Added “Lock ATR to last completed day” option for stable intraday ATR reference
Kept the original logic and purpose intact
Qullamaggie

Distance from 50 SMA in ADR TermsIndicator produces a multiple of ADR% from the 50-day simple moving average to determine is a stock or etf is extended.
ADR Checker - Breakouts📈 ADR Checker – Breakouts
Gain the edge by knowing when a stock has already made its move.
🚀 What It Does:
The ADR Checker - Breakouts is a powerful yet simple visual tool that helps traders instantly assess whether a stock has already exceeded its Average Daily Range (ADR) for the day — a critical piece of information for momentum traders, swing traders, and especially those following breakout, VCP, or CANSLIM strategies.
Using a customizable on-screen table that always stays in view (regardless of zoom or chart scaling), this script shows:
✅ Average ADR% – 20-day average range, calculated in %.
📊 Today’s Move – how much the stock has moved today.
🔥 % of Avg ADR – today's move relative to its historical average, with live color feedback:
🟥 Over 100% (Overextended – danger!)
🟧 70-100% (Caution zone)
🟩 Below 70% (Room to move)
💡 Why It Matters:
One of the most overlooked mistakes by breakout traders is entering a trade after the move has already happened. If a stock has already moved more than its typical daily range, the odds of further continuation sharply decrease, while the risk of pullback or chop increases.
With this tool, you can:
🚫 Avoid chasing extended breakouts
🎯 Time entries before the real move
⚠️ Quickly assess risk/reward potential intraday
🧠 Example Use Case:
Imagine you're watching a classic VCP setup or flat base breakout. The stock breaks out on volume—but when you check this indicator, you see:
Today’s Move: 7.2%
Avg ADR: 5.3%
% of ADR: 135% 🟥
This tells you the stock is already well beyond its average daily range. While it may continue higher, odds now favor a consolidation, shakeout, or pullback. This is your cue to wait for a better entry or pass entirely.
On the flip side, if the breakout just started and the % of ADR is still under 50%, you have confirmation that there’s room to run — giving you more confidence to enter early.
⚙️ Fully Customizable:
Choose position on screen (top/bottom left/right)
Customize text color, background, and size
🔧 Install This Tool and:
✅ Stop chasing extended moves
✅ Add discipline to your entries
✅ Improve your breakout win rate
Perfect for VCP, CANSLIM, and BREAKOUT traders who want a clean, edge-enhancing visual guide.

Chilllax Moving Averages with Qullamaggie colors// Display 2 Moving Averages. Default is 10d sma and 20d sma. You can choose any length. Choose sma, or ema. Choose ma of Open, High, Low, or Close
// Color code is based on Qullamaggie's idea:
// Dark green = 10d ma > 20d ma, and both trending up
// Light green = 10d ma > 20d ma, but only 10d ma trending up
// Yellow = 10d ma > 20d ma, but neither trending up
// You can change the color
// You can hide the colors, then it will simply show 2 moving averages of your choice
// Trend is comparing the ma from X trendlen days ago. Default to 5 days ago. So, if today's ma is > 5 days ago, it is trending up
