Quantum RCI FusionDescription:
Overview: The Quantum Momentum Engine Quantum RCI Fusion is a sophisticated momentum oscillator designed to solve the #1 problem of classic indicators: false signals in sideways markets. At the core of this script is the Rank Correlation Index (RCI), a powerful statistical tool based on Spearman’s correlation. Unlike RSI or Stochastic which only look at price levels, the RCI evaluates the "quality" of a trend by measuring the temporal correlation of price ranks.
This script is not just a line drawing: it is a complete trading ecosystem that fuses three RCI timeframes, volatility filters, and a real-time Risk Management simulation.
🛠 How It Works: The "Fusion" Logic
The strength of this indicator lies in the synergy between its components. It is not a simple mashup, but a filtered logical system:
Triple RCI Engine (Fast, Mid, Slow):
Fast (13) & Mid (18): These generate the Crossover signal for precise entry timing.
Slow (30) - The "Trend Shield": The true innovation. It acts as a directional shield; if the baseline is bullish, the script protects Long positions by ignoring premature exit signals, allowing you to ride the full trend.
HMA Smoothing: Raw price data passes through a Hull Moving Average before the RCI calculation. This drastically reduces market "noise" without sacrificing the responsiveness typical of the RCI.
Intelligent Filters (Anti-Whipsaw):
ADX Integration: Signals are blocked if the ADX is below the threshold (default 20), preventing trading in flat/ranging markets.
Momentum Impulse: Requires a minimum variation (Delta) in the RCI to confirm that the move has real drive and is not just random fluctuation.
🛡 Risk Management & Simulation
Since timing is useless without risk management, Quantum RCI Fusion includes a Dashboard and sophisticated exit logic:
Multiple Exits:
Take Profit / Stop Loss: Based on dynamic ATR multipliers.
Shield Break: Safety exit if the underlying trend (Slow RCI) changes direction.
Emergency: Immediate close if momentum sharply reverses across the zero line.
Live Dashboard: Monitors Win Rate, virtual PnL, and Trade Status (Long/Short/Scanning) in real-time directly on the chart, removing the need for external backtesters.
🚀 How to Use It
Setup: Add the script to a separate pane below your price chart.
Entry Signals:
LONG (Green Triangle): RCI Fast crosses Mid upwards + Oversold Zone (< -80) + ADX > 20 + Bullish Shield.
SHORT (Red Triangle): RCI Fast crosses Mid downwards + Overbought Zone (> 80) + ADX > 20 + Bearish Shield.
Customization:
Scalping: Reduce RCI lengths (e.g., 8/12/20) and disable the "Trend Shield" for quick entries and exits.
Swing Trading: Keep defaults and use the ATR Trailing logic to manage positions on H4 or Daily timeframes.
⚖️ Notes & Credits
Originality: This script enhances the standard RCI by implementing Array-based calculations (optimized for Pine v6), proprietary HMA smoothing, and unique "Trend Shield" logic.
Open Source: The code is released under the MPL 2.0 license. Credits to the Pine community for the foundational mathematical formulas of Spearman's correlation.
Disclaimer: The statistics shown in the dashboard are simulations based on live data and do not guarantee future profits. You are responsible for your own trading decisions.
🖼 Instructions for the Publication Chart (Preview)
To ensure your script gets approved and attracts users, follow these steps for the cover image:
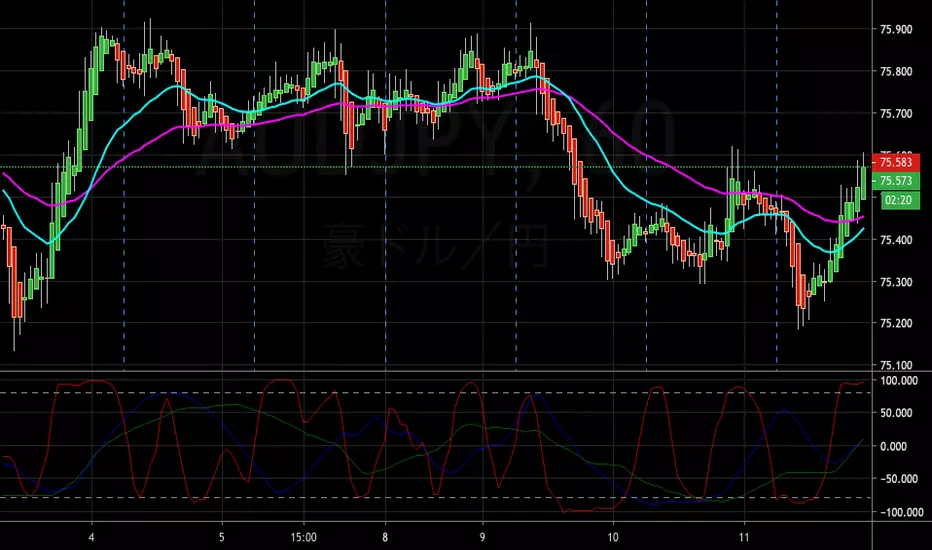
Symbol: Use a volatile and liquid asset, e.g., BTCUSD or XAUUSD (Gold), on a 1H or 4H timeframe.
Clean Layout: Remove all other indicators from the chart (no Moving Averages on price, no Bollinger Bands). The focus must be solely on your script in the bottom pane.
Visualization:
Ensure the Dashboard (stats table) is clearly visible and does not obscure the most recent candle.
The chart should show at least one clear BUY and one clear SELL signal, ideally with the exit icons (the "X" or flags) visible to demonstrate the exit logic.
RCI

RCI4linesRCI4lines plots four Rank Correlation Index (RCI) lines in a single panel to help you read momentum and trend conditions at a glance.
It shows two short-term RCIs (default: 7 and 9), a middle-term RCI (26), and a long-term RCI (52).
The script also draws shaded threshold zones between +80 to +95 and -80 to -95, making it easier to spot potential overbought / oversold areas and compare short-term moves with the bigger trend.
Useful for scalping to day trading, and for checking whether short-term momentum is aligned with mid/long-term direction.

RCI Strategy [PineIndicators]RCI Strategy
This strategy leverages the Rank Correlation Index (RCI) — a statistical oscillator that measures the relationship between time and price rank — combined with a configurable moving average filter. It offers clean, rule-based entries and exits, and visually enhanced trade tracking via labeled markers and boxes on the chart.
The RCI Strategy is well-suited for momentum traders looking to capture directional shifts with confirmation through RCI smoothing.
Core Logic
1. Rank Correlation Index (RCI)
Measures how closely price changes correlate with time rankings.
Values range between -100 and +100.
Thresholds at ±80 help identify potential reversals or extremes.
2. RCI Smoothing via Moving Average
A moving average (MA) is applied to the RCI to smooth out fluctuations.
Supported MA types:
SMA
EMA
SMMA (RMA)
WMA
VWMA
Users can disable the smoothing by selecting "None".
Trade Entry Logic
Long Entry: RCI crosses above the selected moving average.
Short Entry: RCI crosses below the moving average.
Entries are restricted by trade direction settings:
Long Only
Short Only
Long & Short
Visual Features
RCI Panel Display
Plots RCI line and its moving average in a separate pane.
Horizontal guide lines at 0, +80, and -80 help visualize signal zones.
Trade Labels on Chart
Buy Label: Plotted when a long entry is executed.
Close Label: Plotted when any position is closed.
Triangle markers for visual emphasis on direction change.
Trade Visualization Boxes
A colored box is drawn between entry and exit prices.
Green = profitable trade; Red = losing trade.
Two horizontal lines connect entry and exit prices for reference.
Customization Parameters
RCI Source: Select input price for the RCI (default: close).
RCI Length: Set sensitivity of the oscillator.
MA Type and Length: Choose and configure the smoothing filter.
Trade Direction Mode: Define whether to allow Long, Short, or both.
Use Cases
Swing traders who want to trade directional reversals with statistical backing.
Traders seeking a clean and visual strategy based on rank momentum.
Environments where both trend and range dynamics occur.
Conclusion
The RCI Strategy is a non-repainting, rule-based trading model that combines rank correlation momentum with smoothed trend logic. Its clean visual markers, labeled trades, and flexible MA filters make it a valuable tool for discretionary and systematic traders alike.

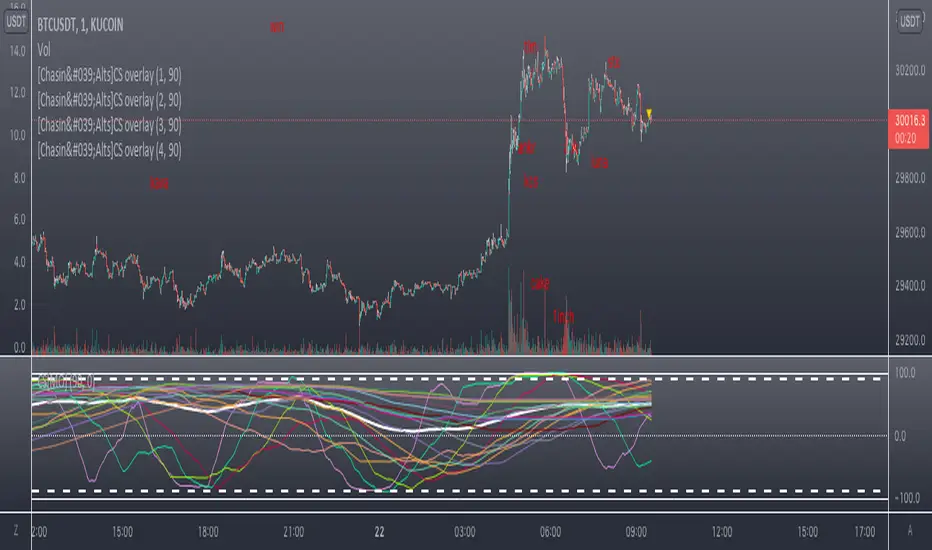
Counting Stars Overlay [Market Overview Series]Hi fellow tradeurs,
So it's always been my goal to provide one of my best scripts. This is from what I call my "Market Overview" series. It is a scanner for my second best script to date. Market Overview bc of its origins as a scanner of the Kucoin Margin Coins. I realize that there are more coins that there are more margin coins that Kucoin has but I wanted to have a solid 40 coins on each coin "set". If you are unfamiliar with what I mean by 'sets' then you can view my other scanner scripts on this account for futher elaboration but to sum it up....there are 4 sets of coins I have to choose from in the settings. Each set has 40 coins in them (as there is a cap of 40 security calls that can be made per each iteration of the script on the chart). That being said...if you have the capabilities then add this script 4 times to your chart and select a diff set for each copy of the script. This has the scanner in a way that I've yet to present in my others scripts. When the alert for a coin goes off then the coins name will be printed as a label over the main chart. BTW, this was built for the 1 min timeframe and have used it EXTENSIVELY and this is the best TF for how the settings are set. I will also publish another script that will be a visual aid for this one but will rather show all the plots associated with the code that is in this scanner. Know that for the scanner it'll be best to choose a coin that has at least 1 trade/update/printed candle per minute (to be safe use BTC or ETH chart or else some of the signals will be printed if the signal arrives at a point in time where the coin on the screen does not print a candle bc no new trade or update to trades occur in TradingView. For the visual aid script that I will add right after this, there will be 20 different plots that appear. When the AVG of all of these plots is beyond the OverBought line and then the AVG line is falling for 2 bars...THEN the long signal for that coin is generated (and vise versa for short signals) Lastly regarding the visual aid script, THAT ONE will ONLY show the 20 plots that are associated with the coin that the chart is selected for. So that one is not a scanner and is just a stand alone script (again) to show whats going on in the background of this scanner. Now, once you add it however many time you want to see however many sets of coins you want, I recommend merging the scales so that they are all on one scale. I prefer mine being on the left side but all you have to do is select the 3 dots in the scripts settings in the chart window and select the scale location line and it'll open another set of lines at which point you can select "merge to scale Z" (that will be the left scale) and will put all the scales together on the left. I forgot ****If you want to see a whole diff exchange's coins you much make changes to this original script and it is further described how to do so in one of my first publications**** I REALLY hope it becomes of some benefit to you in your trading as it abundantly has in my own. It is after all one of the best of my best. Ohh, I forgot to add alerts to this but will do so immediately following this. To finish, this script DOES NOT REPAINT as far as I have EVER seen (and I have extensively searched for it bc of how good the signals were, I figured I MUST HAVE made a mistake and it did so...but alas...it does not. If you notice something on the contrary do notify me immediately with the coin, exchange, TF, and time of the occurrence and we can go from there. If anyone has any great ideas for the script then please do also let me know and if I find anyone with some abilities that mingle well with my own then lets talk as I'm always looking for good ol chaps to help me out with other scripts bc if you think this is good....well....you must imagine that I've got better that I have not/am not publishing. Aaaaaanywho, goodluck to you all. I wish you the best. ***I've got good info on how to look out for false signals but I want to see what yall come up with first before I give away all my alpha.
AND if anyone asks questions that Ive already touched on in this description or already in the comments sections then maybe someone there would be willing to waste their time answering them bc I've done quite a bit of work here that I am HAPPY to hand over to the general public but if you are not willing to do the work in reading to possibly answer your inquiries that have already been answered then I am not willing to do that work for you again. Peace and love people...peace and love. Im out.


RCI3lines optimized and fixedRank Correlation Index.
Applied jadbrother's fix
Quite faster calculation(almost 30x than RCI3lines)

RCI3Short MTFFor RCI lover.
We are facing a timeout problem on smart phone apps of TV.
It looks like a staircase, but It frees us from timeout problems.
default MTF: 60 / 120 / 240
MTF line as middle/long lines
RCI3lines3 lines RCI
Original author is Jadbrother and modified for 3 lines, 9,35,52, by gero on Jun.29 2016.