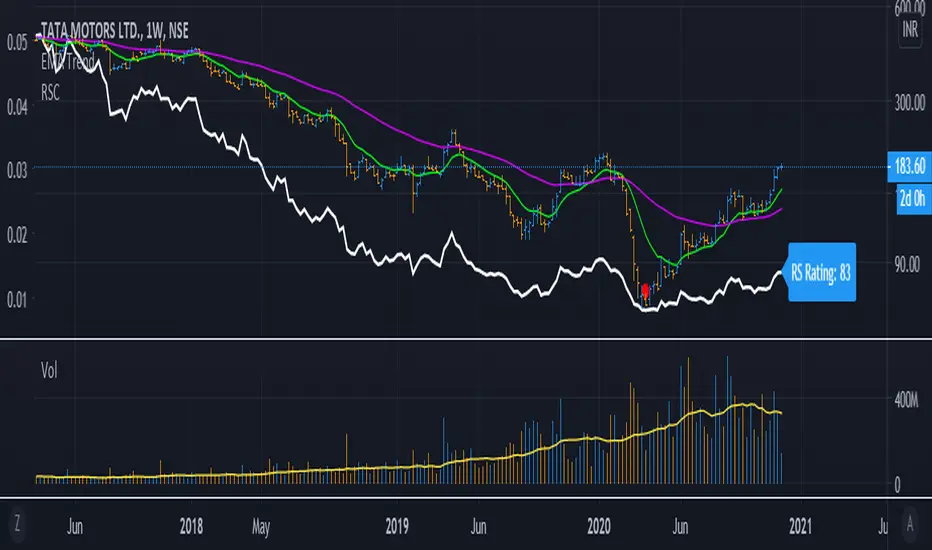
RelativeStrengthComparative_IBD_YRKI am publising Relative Strength Comparative.
It is be used to compare a Stock's Performance against another stock/index (Default NIFTY50)
I also devised a Plot RS Rating which is inspired from IBD's RS Rating and matches to some extent. You can turn off/on the RS Rating as per need.
Example: ITC vs NIFTY 50 it will be ITC / NIFTY
The Indicator can be used in Multiple ways:
1) Check Relative Strength
2) Check RS Rating (This is not Accurate as of now since IBD compares the ratings of all the stocks in an Exchange)
3) Can be used as a Spread Chart for the Division (We need to not divide every time we change Stocks)
4) Design a Template exactly as MarketSmith by using the TradingView feature of "Move to --> Existing Pane Above"
The Formula i used for RS Rating is below with more weightage on the 3 month performance and lesser on 12 month Performance. I am open to Modification of this Formula if a better suggestion
// relative strength IBD style
ThreeMthRS = 0.4*(close/close)
SixMthRS = 0.2*(close/(close*2))
NineMthRS = 0.2*(close/(close*3))
TwelveMthRS = 0.2*(close/(close*4))
Comparazione Forza Relativa
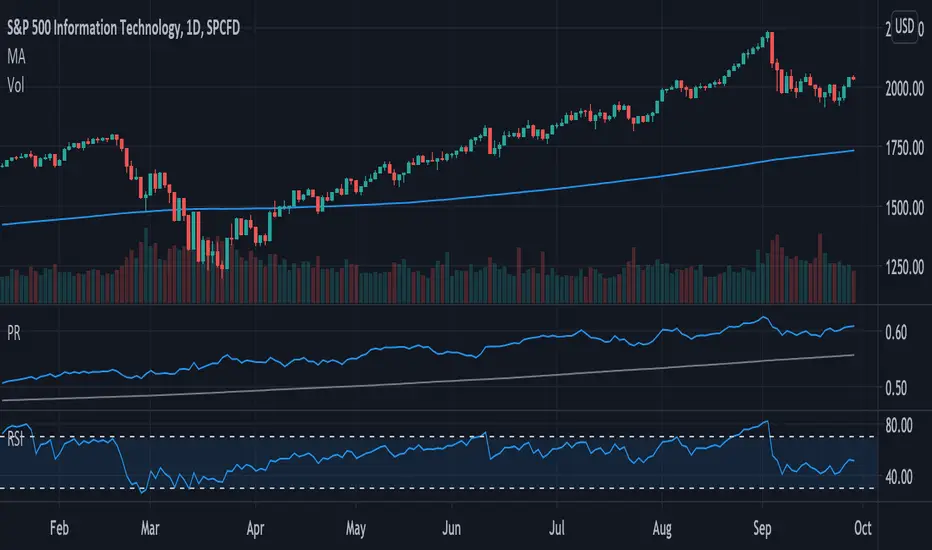
Price Relative / Relative StrengthThe Price Relative indicator compares the performance of one security to another. This indicator can be used to compare the performance of a stock against a benchmark index, such as the S&P 500, or its sector/industry group. This makes it possible to determine if a stock is leading or lagging its peers.
The Price Relative is used to gauge relative strength, which is important when it comes to stock selection. Many portfolio managers compare their performance to a benchmark, such as the S&P 500. Their goal is to outperform that benchmark. In order to achieve this goal, managers often look for stocks that are showing relative strength. Enter the Price Relative. The Price Relative rises when a stock shows relative strength and is outperforming its benchmark. Conversely, the Price Relative falls when a stock shows relative weakness and is underperforming its benchmark.
Source: school.stockcharts.com
This script allows the user to
Add a new indicator pane for Price Relative (PR)
Edit the benchmark symbol (Comparative Symbol)
Edit or hide the moving average
Quickly determine if the symbol is outperforming or underperforming its benchmark
Quickly determine if the symbols is trending higher or lower based on a simple moving average
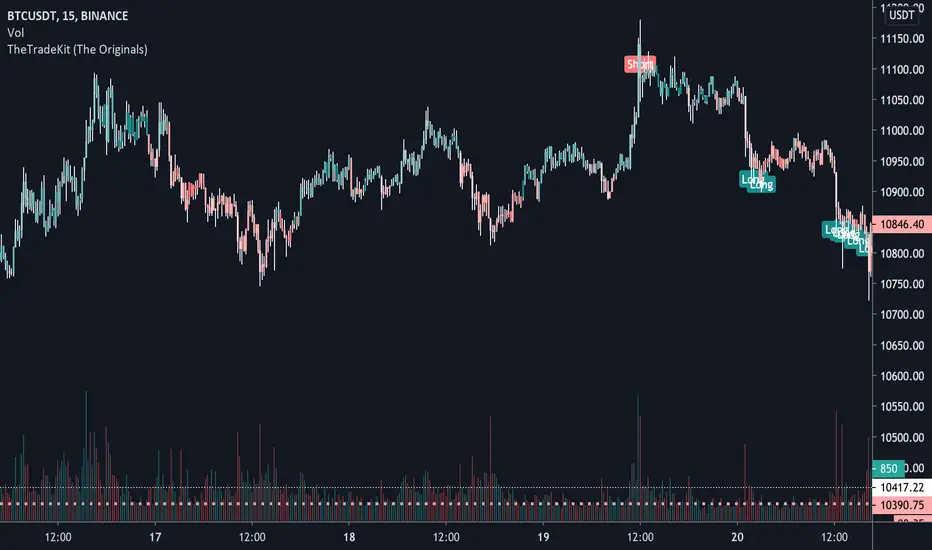
TheTradeKit (The Originals)TheTradeKit (lifetime) Indicator Suite
A data first approach. Community Second. Transparent always.
Designed for traders of any market including:
- Crypto
- Forex
- Stocks
- Commodities
With a little configuration and insight into your trading style. TheTradeKit has been designed to be as simple as selecting a pair and let the market present opportunities for you. Built with all intent of taking the emotion out of trading.
Messages me for “The Originals” access - this will be the area for beta releases whilst we build success here at TheTradeKit and for our community.
Strategy Returns optimal Buy/Sell, S/L and Target Zones with the help of confirming indicators such as:
#MovingAverages
#RelativeStregthIndex
#PivotPoints
Indicator Suite (Tuesday, 22nd September 2020)
We are constantly including beta releases; it is suggested by legal friends to take this opportunity to mention this indicator dictates research based on history only and will not forecast the future. What you perceive to be the result of the plot function may not in fact be that of what I nor, any other perceives.
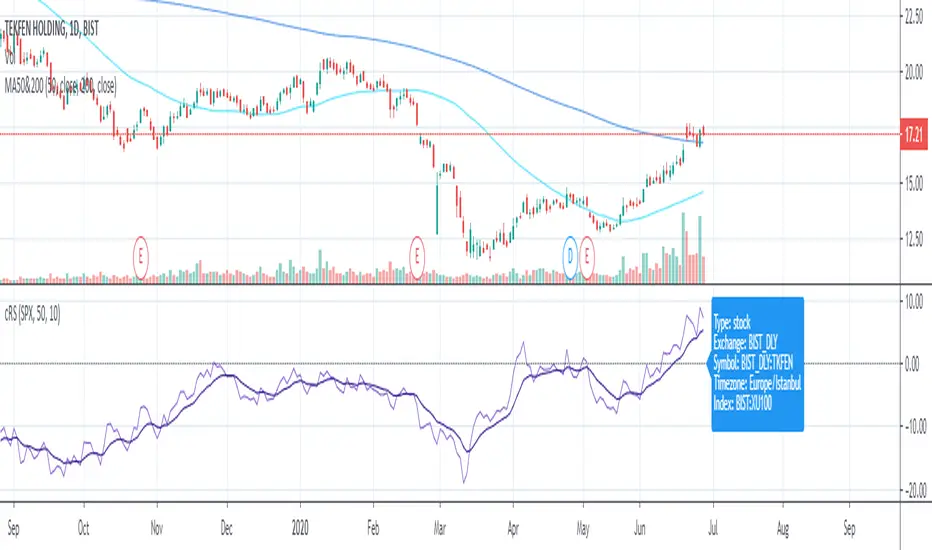
Relative Strength ComparisonRelative Strength Comparison compares a security's price change with that of a "base" security or index.
You can change the "base" security from the indicator settings.
You can compare:
- Stock to other stock
- Stock to the benchmark index
- One index to another index

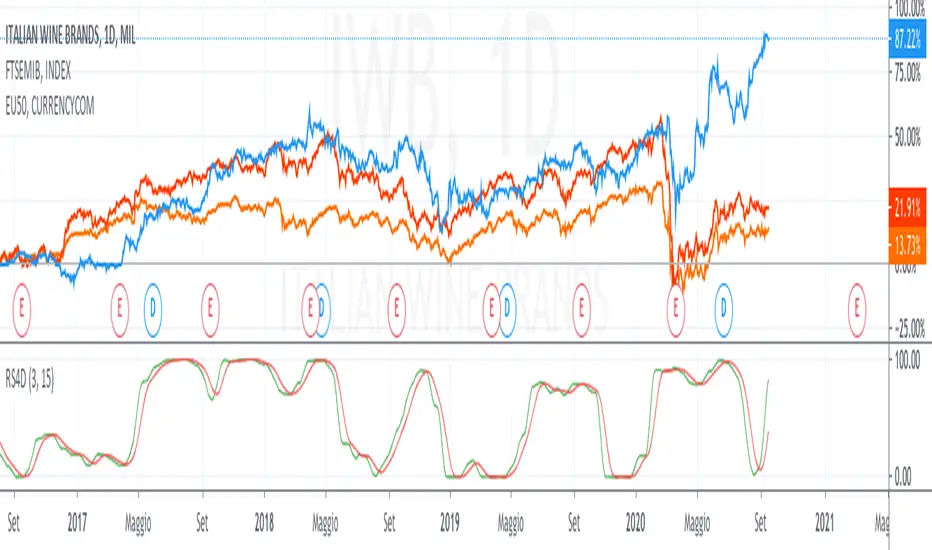
Relative Strength 4DimensionIn the S&C September 2020 article “Tracking Relative Strength In Four Dimensions”, James Garofallou presents a metric for evaluating a security’s strength relative to 11 major market sectors and over several time periods. All this information is squeezed into a single value. Maybe at cost of losing other important information? In this article we’ll look into how to program such a beast, and how it fares when we use it for rebalancing a stock portfolio.
This is a redesigned version for an european point of view.
I used 10 index for the comparison.
feel free to tip me ;-)
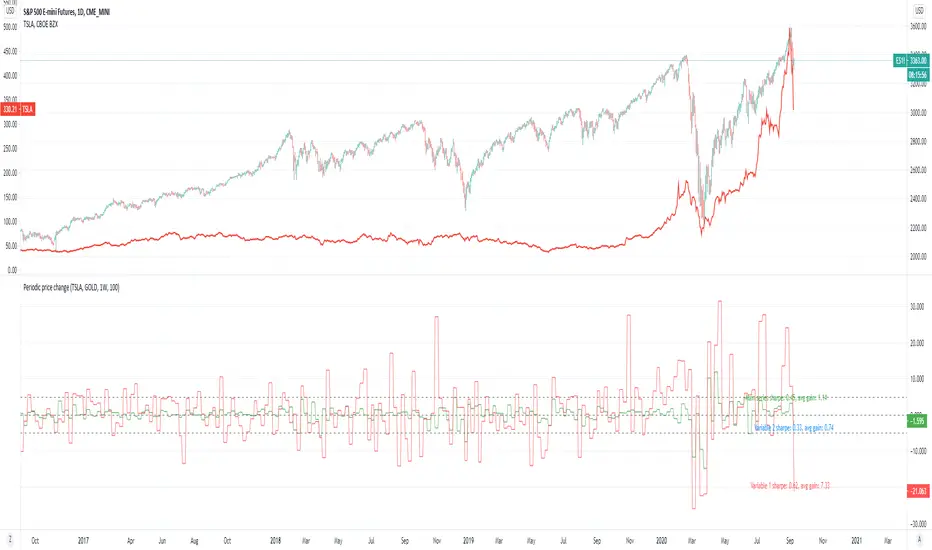
Periodic price change comparisonPeriodic price change.
Application:
Sector rotation analysis by comparing different tickers.
Simple statistical analysis (with lookback period) for knowing how good they were.
If you are a believer in sector rotation, you can add different sector stocks to see which of them are lagged behind and buy them.
In this example, you could see tesla periodically fall behind the market. You can buy it when it is on that zone.
And you can also refer to the sharpe ratio and the average gain rate on the chart to see how good the stocks were.
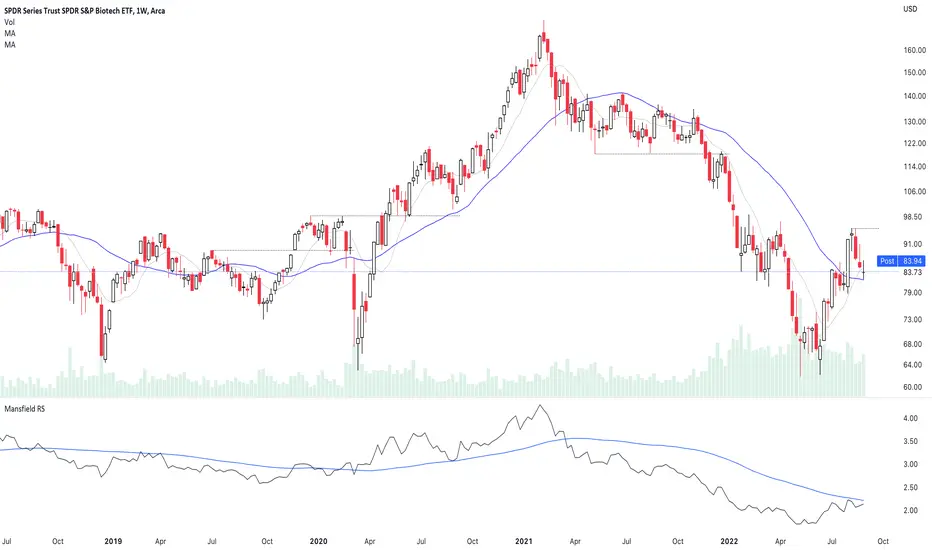
Relative Strength (Mansfield RS)This version of the Mansfield Relative Strength Indicator uses the unflattened version of the indicator recommended on the Stage Analysis website, as the slope angle of "Zero Line" (52 week MA of the stock / S&P 500) gives additional useful information that can't be seen on the traditional flattened version of the Mansfield Relative Strength Indicator.
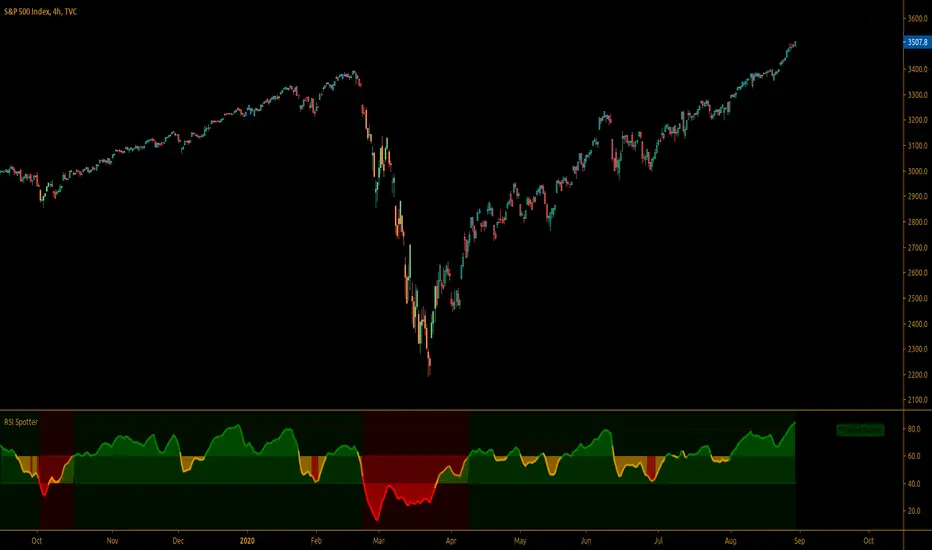
Simple RSI Spotter™TradeChartist Simple RSI Spotter is an elegant version of the classic RSI indicator and helps spot price trends using visually engaging and appealing RSI plot and background. The Bull and the Bear background fills are highly useful for traders who like to visually understand areas of entry and exit based on RSI .
===================================================================================================================
What does Simple RSI Spotter do?
Plots RSI with visually engaging colours for Bull and Bear zones (Green and Red) with optional background fill.
Plots RSI coloured bars on main chart based on user preferred Upper and Lower RSI band.
Plots RSI based on Zero-Lag EMA smoothing (1 for Regular RSI without smoothing).
Plots Heikin Ashi RSI if enabled from indicator settings.
Plots RSI highs of Bull Zone and RSI lows of Bear Zone. Helps visually spot divergences.
===================================================================================================================
Note:
Default Settings:
5 period EMA Smoothed Heikin Ashi RSI.
For normal RSI, uncheck, Heikin Ashi RSI and change EMA RSI Smoothing to 1.
===================================================================================================================
This is a free to use indicator.
===================================================================================================================
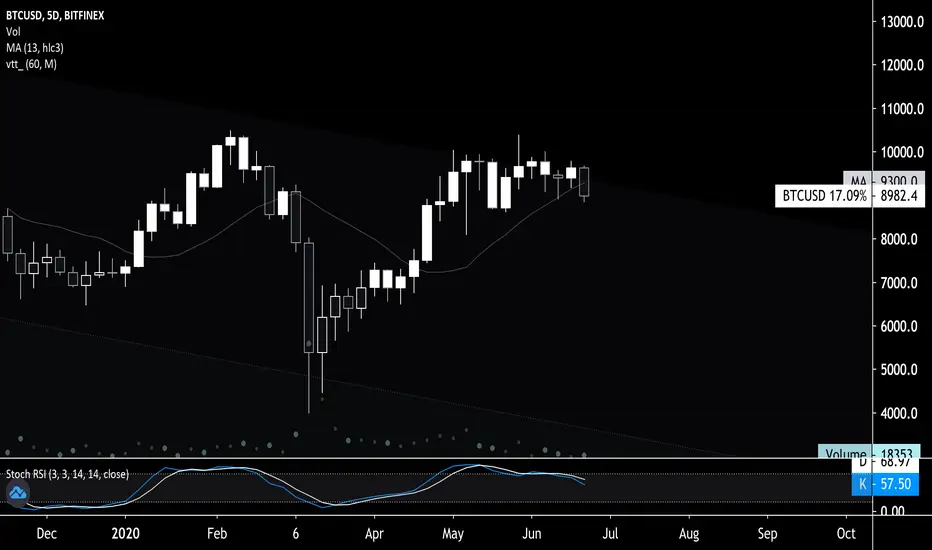
Price Volume Strength ComparatorBollinger bands says whether price or any source is relatively high or low at any particular point of time. We can apply Bollinger bands on RSI and volume indicator Price Volume Trend to identify if RSI movement or PVT movement is relatively high or low.
By calculating Bollinger %B, we can define the variation in a range between 0 to 1. By applying Bollinger %B on price, volume and strength, we are trying to compare how much they differ relative to each other.
For example, if Bollinger %B of volume is higher than Bollinger %B of price, which may mean, we can still expect continuation of upward movement. If volume %B is lesser, we can interpret this as price has moved more than the volume and may retrace back.
Note: I tried adding multiple volume/strength indicators as input choice. But, if condition did not work with simple string. Have no idea why. I will try adding that later if more people show interest.

easyRS v1.0This easyRS indicator shows the strength of a stock with color bar
*black bar is very weak
*gray bar is weak
*green bar turn strong
*orange bar very strong
*red bar is bubble strength
send me a private message to gain access on the indicator.


Smart Forex Buy Sell Signal by LukasHi again!
So, this is BUY and SELL signal base on Price action, RSI, and Correlation between Forex Major Pairs.
It's only work for Forex Major Pairs because I only took their data.
Included alert : Spec, Buy, Strong
Recommended to wait for double signal :
Spec Buy > Buy or Spec Sell > Sell
Buy > Strong Buy or Sell > Strong Sell
So execute after the second signal triggered.
It's indicate the trend.
Looking forward for your feedback to improve the script.
Thank you.
It's better combine it with Moving average indicator to indicate direction, I use Moving Average Adaptive Q from cheatcountry to help me make decision.

Currency Strength Indicator by LukasA better way to trade major pairs.
Similar to RSI CSI, with less noise and real price action movement.
Some explanation. Set thickness of "Color 0" from each currency to know the strength.
Use on 30m timeframe and above to see the power of each currency.
Suggestion : Set timeframe 30m for 1h play (your timeframe : 2), so you can get early signal.
Always looking for upward movement from currency above 20 or 0
Vs. currency bellow 0 or -20.
--
Stay Profit.
Any feedback are welcome.

Viral Trend TraderSimple indicator.
Chose ADX Length and Timeframe and it will show translucent black candles for downtrends and white candles for uptrends.
Relative Strength Auto ComparisonRelative Strength Comparison with automatic selection of relevant index
Added support for most european and north american exchanges.
SPY RelativeShows an instrument's sentiment in a day (or week) compared to the market (SPY default). The Red line shows bearish sentiment compared to the market and the green is bullish. Technically this works like a proxy for Alpha/Beta factor.

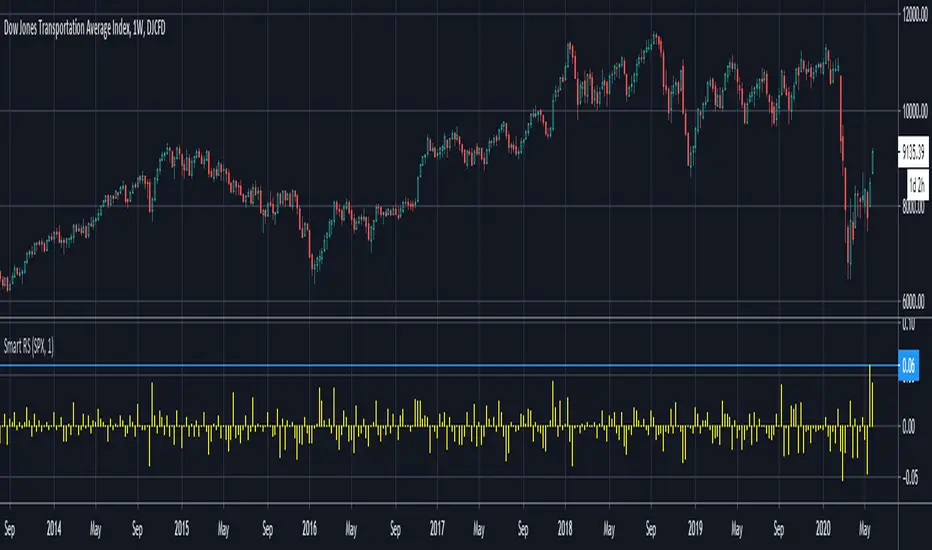
Smart Relative Strength Can Remove False SignalsRelative strength is one of the most useful indicators in the market, highlighting when stocks and sectors are outperforming or underperforming a broader index.
Traditional RS compares the percentage change of one symbol over a given time frame and subtracts the percentage change of the S&P 500 over the same period.
This is handy, but it can produce false signals at times of volatility. For example, when the broader market is crashing, certain sectors may “outperform” simply by falling less than the S&P 500.
Smart Relative Strength addresses this shortcoming by requiring that the symbol’s absolute AND relative returns both be positive. Otherwise a zero is returned.
This was useful last week on the Dow Jones Transportation Average . Using simple relative strength, it had its best one-week performance against the S&P 500 since October 2008. This was obviously a false signal because October 2008 was a time that everything else was crashing.
Smart Relative Strength showed that, excluding periods of overall decline, DJT had its best week since January 2008.
Note: This chart uses a 1-period interval, while the code defaults to 21 periods.
JSE Top 40 Comparative Relative Strength RSI OscillatorThis code is the result of an idea by @MarcoOlivano. The question was that if putting the comparative relative strength as an RSI oscillator would help in understanding the relative strength of the stock to the overall market? As we both trade the JSE I have made the JSE:J200 or Top 40 the basis for comparison. This can be changed in the settings dropdown if you want to compare with the All Share Index (JSE:J201) or other markets such as the S&P.
On the chart above I have included the Comparative Relative Strength as a reference together with the Comparative Relative Strength RSI.
If you use the indicator or adapt it please let me know if it works for you, how you use it and if it has any value.

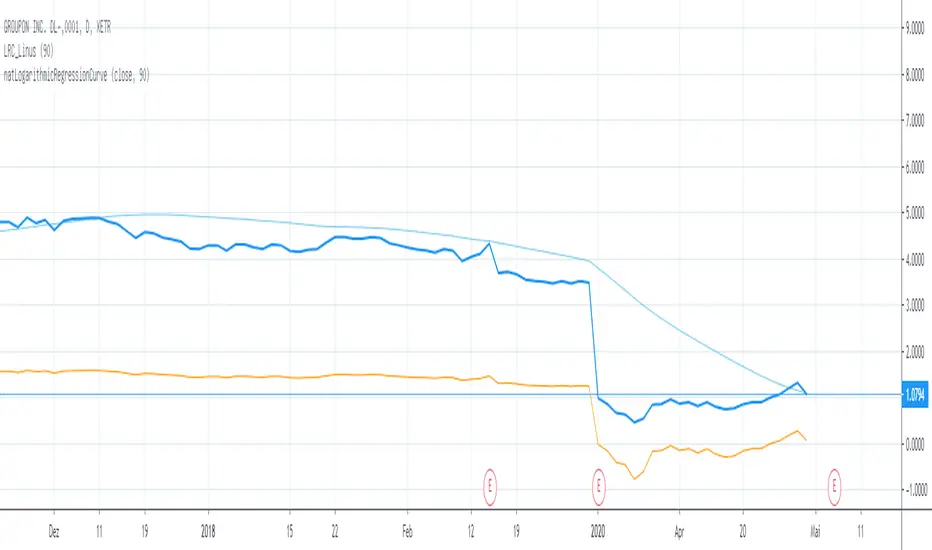
natLogarithmicRegressionCurveThis is my attempt to rebuild the Momentum Strategy as read in the book "Stocks on the move".
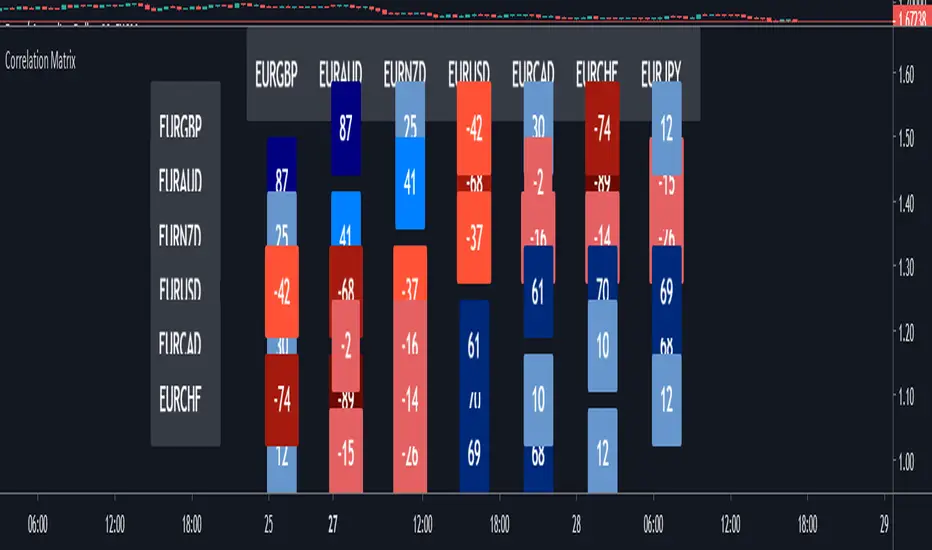
Correlation MatrixIn financial terms, 'correlation' is the numerical measure of the relationship between two variables (in this case, the variables are Forex pairs).
The range of the correlation coefficient is between -1 and +1. A correlation of +1 indicates that two currency pairs will flow in the same direction.
A correlation of -1 indicates that two currency pairs will move in the opposite direction.
Here, I multiplied correlation coefficient by 100 so that it is easier to read. Range between 100 and -100.
Color Coding:-
The darker the color, the higher the correlation positively or negatively.
Extra Light Blue (up to +29) : Weak correlation. Positions on these symbols will tend to move independently.
Light Blue (up to +49) : There may be similarity between positions on these symbols.
Medium Blue (up to +75) : Medium positive correlation.
Navy Blue (up to +100) : Strong positive correlation.
Extra Light Red (up to -30) : Weak correlation. Positions on these symbols will tend to move independently
Light Red (up to -49) : There may be similarity between positions on these symbols.
Dark Red: (up to -75) : Medium negative correlation.
Maroon: (up to -100) : Strong negative correlation.
FX Currency Strength IndicatorFX Currency strength indicator is a visual guide that demonstrates which currencies are currently strong, and which ones are weak.
FX Currency strength indicators include multiple calculation to choose from
1. Relative Strength Index (RSI)
2. True Strength Index (TSI)
3. Absolute Strength Index (ASI)
4. Linear Regression Slope (LRS)
5. Rate of Change (ROC)
6. Z-Score
Three display modes
1. Lines
2. Columns
3. Areas

Chop & Trend===========
Chop & Trend
===========
A handy little indicator illustrating not only areas of Chop or "flat" market conditions, but also to indicate the start of a new trend and the new trend's direction.
-----------
Using just a few algorithms to indicate the aforementioned (RSI, Jurik Moving Average and Angle of MA) we've tried to keep it simple as we believe adding too many variables can only degrade a good indicator, and not enhance it, as many would lead you to believe.
There's a few settings to play with regarding Relative Strength, Jurik MA and the ability to set an angle to determine when chop/trend starts or ends.
Good Luck and Happy Trading!
-theCrypster
Relative Strength with NIFTYThis script checks the relative strength of a security with respect to NIFTY
