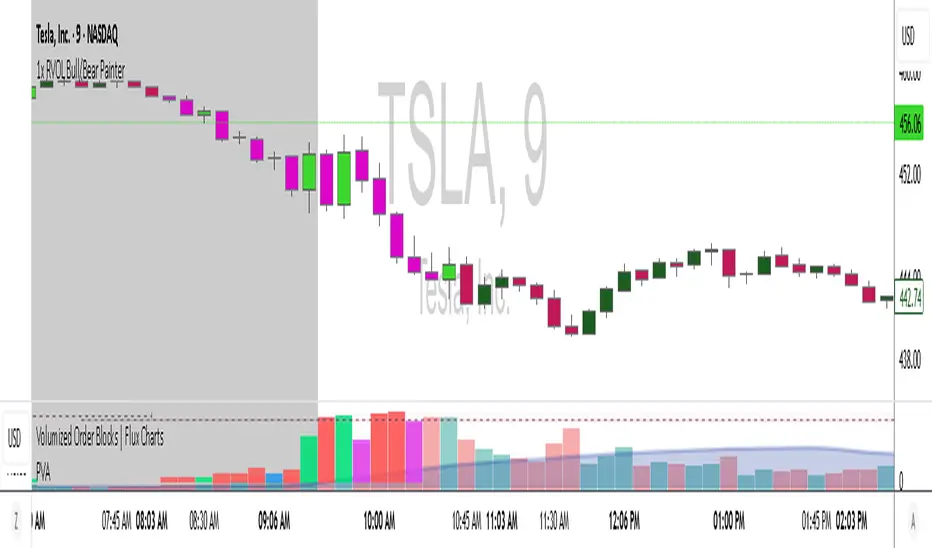
Volume with number spikesThis Volume Indicator shows unusual volume on the candle on any time frame.
Relativevolume

Swing a jeanmiche-au dessus de ça smma 100
-stochastique qui croise sous 25
-volume au dessus de la moyenne.


Volume Pulse Dots Relative Volume at a Glance
Volume Pulse Dots is a lightweight, price-overlay indicator designed to highlight unusual volume activity directly on the chart, without adding clutter or a separate volume pane.
Instead of raw volume bars, this script uses relative volume (rVol) — current volume compared to a moving average of recent volume — to visually flag moments when participation meaningfully deviates from normal.
How It Works
Relative volume is calculated as:
Current volume ÷ Volume moving average (user-defined length)
Based on this ratio, small dots are plotted on the chart:
• High relative volume (green dot below bar)
Signals increased participation compared to recent activity. Often appears during momentum moves, breakouts, or strong continuation candles.
• Very high relative volume (larger cyan dot below bar)
Indicates extreme participation. Common near major breakouts, capitulation candles, or key inflection points.
• Low relative volume (gray dot above bar)
Highlights weak participation. These candles often represent fake moves, fading momentum, or price drifting without conviction.
Dots are intentionally subtle and plotted directly on price to keep context clear while staying out of the way.
How to Use It
This indicator is not a standalone signal generator. It works best when combined with:
• VWAP and EMA structure
• Key support and resistance levels
• Candlestick context (range, wicks, follow-through)
• Price location relative to the open, highs, or prior day levels
Examples:
• High rVol dots near VWAP can confirm real participation
• Very high rVol dots at extended levels may signal exhaustion
• Low rVol dots during breakouts often warn of weak follow-through
Customization
You can adjust:
• Volume moving average length
• Thresholds for high, very high, and low relative volume
• Optional display of the rVol value in the status line (no extra pane)
Design Philosophy
• No separate volume pane
• No alerts or signals
• No repainting
• Minimal visual footprint
This tool is meant to quietly surface information that experienced traders already look for, without distracting from price.

Daily Volume Event This tool is ideal for traders who want to monitor hundreds of symbols simultaneously for volume shocks. This indicator was developed exclusively by the AI Gemini to precisely identify extraordinary trading volumes. The focus lies on detecting "news events" by comparing the current daily volume with the average of the past five days. Thanks to percentage-based normalization, a single alert value can be used universally across an entire watchlist. he script utilizes multi-timeframe analysis to display the daily volume ratio directly on intraday charts such as the 15-minute timeframe. It eliminates the noise of ordinary market movements and isolates significant institutional activity through customizable thresholds. Users can set alerts to be notified immediately when a stock exceeds its typical volume by 30% or more. The clean visual representation as a histogram allows for quick identification of outliers without manual calculation.

Confluence Execution Engine (2of3)The Confluence Execution Engine is a high-performance logic gate designed to filter out market noise and identify high-probability "Golden" entries. It moves beyond simple indicator signals by acting as a mathematical validator for price action. This engine is designed for the Systematic Trader. It removes the "guesswork" of whether a move is real or an exhaustion pump by requiring a mathematical confluence of volume, multi-timeframe momentum, and volatility-adjusted space.
Why This Tool is Unique:
Multi-Dimensional Scoring, Momentum-Adjusted Stretch, Institutional Fingerprint (RVOL + Spike)
Unlike a standard MACD or RSI, this engine uses a weighted scoring matrix. It pulls a "Bundle" of data (WaveTrend, RSI, ROC) from four different timeframes simultaneously. It doesn't give a signal unless the mathematical weight of all four timeframes crosses your "Hurdle" (Base Threshold).
Standard "overbought" indicators are often wrong during strong trends. This engine uses Dynamic Z-Score logic. The Logic: If the price moves away from the mean, it checks the Rate of Change (ROC). The Result: If momentum is massive, the "Stretch" limit expands. It understands that a "stretched" price is actually a sign of strength in a breakout, not a reason to exit. It only warns of a TRAP RISK when the price is far from the mean but momentum is starting to stall.
The engine is gated by Relative Volume. If the market is "sleepy," the engine stays in "PATIENCE" mode. It specifically hunts for Volume Spikes (default 2.5x average). A signal is only upgraded to "HIGH CONVICTION" when an institutional volume spike occurs, confirming that "Big Money" is participating.
How to Operate the Engine
Define Your Hurdle: Set your Confluence Hurdle. A higher number (e.g., 14+) requires more agreement across timeframes, leading to fewer but higher-quality trades.
Monitor the Z/Dynamic Ratio: In the HUD, watch the Z: X.XX / Y.YY. When X approaches Y, you are reaching the edge of the momentum-adjusted move.
The Entry Trigger: Wait for a "LOOK FOR..." advice to turn into a "HIGH CONVICTION" signal (marked by a triangle shape). This confirms that the MTF scoring, Volume, and HTF Trend are all aligned.
Execute the Lines: Use the red and green "Ghost Lines" to set your orders. These are ATR-based, meaning they widen during high volatility to give your trade room to breathe.
For holistic trading system, pair with Volatility Shield Pro and Session Levels

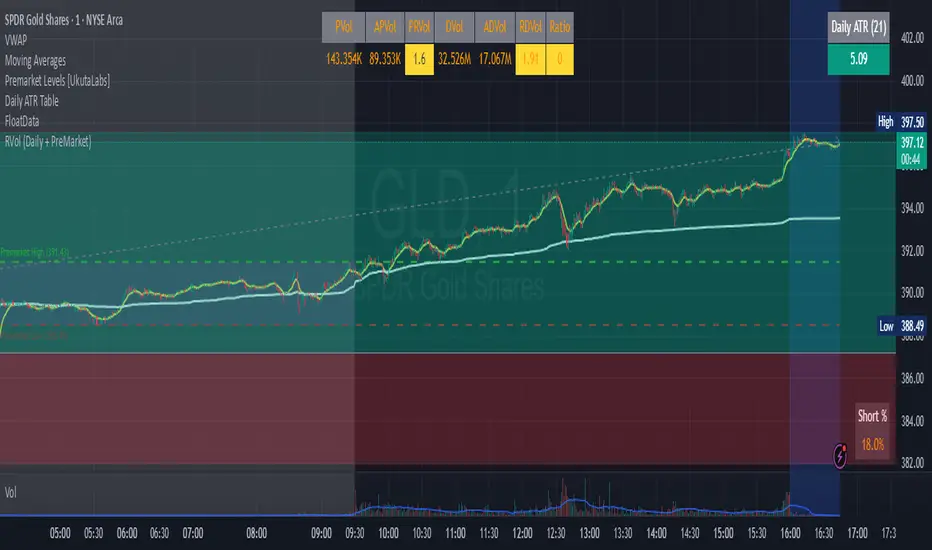
SCOTTGO - Float, Change %, Vol & RVol DataFloat, Vol & Short Data Dashboard
Overview
The Float, Vol & Short Data Dashboard is a professional-grade monitoring tool designed for equity traders who need to track supply, demand, and momentum in real-time. By aggregating float size, relative volume, and short-selling activity into a clean, customizable table, this script helps you identify high-conviction trade setups without cluttering your price chart.
Key Metrics Included
Float: (Shares) – Instantly see the available supply of shares to gauge potential volatility.
Change %: (From close) – Tracks the percentage gain/loss since the previous day's closing price.
Change %: (From open) – Monitors intraday strength by calculating the move from the 9:30 AM EST market open.
Volume: – Displays current daily volume with automated formatting (K, M, B).
RVOL: (Daily) – Relative Volume compared to a 10-day SMA; essential for spotting "volume-fueled" breakouts.
Short %: (Approx.) – Calculates the daily Short Volume Ratio (Short Volume / Total Volume), providing a real-time proxy for short-seller sentiment.
Professional Customization
This script was built with a focus on UI/UX:
Three-Row Header System: Features high-contrast main titles with muted-grey sub-titles for maximum readability.
Smart Color Logic: Price changes automatically toggle between green and red, while RVol highlights in orange when activity exceeds 1.5x average.
Adjustable Layout: Change the table position, text size, and background opacity.
Column Spacing: Includes a custom slider to adjust the horizontal gap between data columns, ensuring the dashboard fits any screen resolution.
How To Use
Add the script to your chart and use the Settings menu to toggle metrics or adjust the Column Spacing to your preference. Ideal for day traders and swing traders monitoring US Equities where float and short volume data are most impactful.

Session Relative VolumeSession Relative Volume is an advanced intraday futures volume indicator that analyzes volume separately for Asia, London, and New York sessions - something standard relative volume tools can’t do.
Instead of aggregating the entire day’s volume, the indicator compares current volume to historical averages for the same session and time of day, allowing you to spot true volume strength and meaningful spikes, especially around session opens.
Background
Relative volume helps traders spot unusual activity: high volume often signals institutional participation and trending days, while low volume suggests weak commitment and possible mean reversion. In futures markets, sessions ( Asia, London, New York ) must be analyzed separately, but TradingView’s Relative Volume in Time aggregates the entire day, masking session-specific behavior - especially during the New York open. Since volume can vary by more than 20× between sessions, standard averages struggle to identify meaningful volume spikes when trader conviction matters most.
Indicator Description
The “Session Relative Volume” indicator solves these problems by calculating historical average volume specific to each session and time of day, and comparing current volume against those benchmarks. It offers four display modes and fully customizable session times
Altogether, it provides traders with a powerful tool for analyzing intraday futures volume, helping to better assess market participation, trader conviction, and overall market conditions - ultimately supporting improved trading decisions.
Parameters
Mode – display mode:
R-VOL: Relative cumulative session-specific volume at time
VOL CUM: Cumulative session volume at time compared to historical average cumulative session-specific volume
VOL AVG: Average session intrabar volume at time compared to historical average session-specific intrabar volume
VOL: Individual bars volume, highlighting (solid color) unusual spikes
Lookback period – number of days used for calculating historical average session volume at time
MA Len – length of the moving average, representing average bar volume within a session based on previous periods (different from historical cumulative volume!). Used only in VOL and VOL AVG modes
MA Thresh – deviation from moving average, used to detect bar volume spikes (bar volume > K × moving average)
Start Time – End Time and Time Zone parameters for each session. The time zone must be set using TradingView’s format (e.g., GMT+1).

Clean Volume (SUV)The Problem with Raw Volume
Traditional volume bars tell you how much traded, but not whether that amount is unusual. This creates noise that misleads traders:
Stock A averages 1M shares with wild daily swings (500K-2M is normal). Today's 2M volume looks like a spike—but it's just a routine high day.
Stock B averages 1M shares with rock-steady volume (950K-1.05M typical). Today's 2M volume is genuinely extraordinary—institutions are clearly active.
Both show identical 200% relative volume. But Stock B's reading is far more significant. Raw volume and simple relative volume (RVol) can't distinguish between these situations, leading to:
- False signals on naturally volatile stocks
- Missed signals on stable stocks where smaller deviations matter
- Inconsistent comparisons across different securities
---
A Solution: Standardized Unexpected Volume (SUV)
SUV applies statistical normalization to volume, measuring how many standard deviations today's volume is from the mean. This z-score approach accounts for each stock's individual volume stability, not just its average.
SUV = (Today's Volume - Average Volume) / Standard Deviation of Volume
Using the examples above:
- Stock A (high volatility): SUV = 2.0 — elevated but not unusual for this stock
- Stock B (low volatility): SUV = 10.0 — extremely unusual, demands attention
SUV automatically calibrates to each security's behaviour, making volume readings comparable across any stock, ETF, or timeframe.
---
What SUV Is Good For
✅ Identifying genuine volume anomalies — separates signal from noise
✅ Comparing volume across different securities — apples-to-apples z-scores
✅ Spotting institutional activity — large players create statistically significant footprints
✅ Confirming breakouts — high SUV validates price moves
✅ Detecting exhaustion — extreme SUV after extended moves may signal climax
✅ Finding "dry" setups — negative SUV reveals quiet accumulation periods
---
Where SUV Has Limitations
⚠️ Earnings/news events — SUV will spike dramatically (by design), but the statistical reading may be less meaningful when fundamentals change
⚠️ Low-float stocks — extreme volume volatility can produce erratic SUV readings
⚠️ First 20 bars — needs lookback period to establish baseline; early readings are less reliable
⚠️ Doesn't predict direction — SUV measures volume intensity, not whether price will rise or fall
---
How to Read This Indicator
Bar Height
Displays actual volume (like a traditional volume chart) so you can still see absolute levels.
Bar Color (SUV Intensity)
Color intensity reflects the SUV z-score. Brighter = more unusual.
Up Days (Green Gradient):
| Color | SUV Range | Meaning |
|--------------|-----------|------------------------------------------|
| Bright Green | ≥ 3.0 | EXTREME — Highly unusual buying activity |
| Green | ≥ 2.0 | VERY HIGH — Significant accumulation |
| Light Green | ≥ 1.5 | HIGH — Above-average interest |
| Pale Green | ≥ 1.0 | ELEVATED — Moderately active |
| Muted Green | 0 to 1.0 | NORMAL — Typical volume |
| Dark Grey | < 0 | DRY — Below-average, quiet |
Down Days (Red Gradient):
| Color | SUV Range | Meaning |
|------------|-----------|-----------------------------------------|
| Bright Red | ≥ 3.0 | EXTREME — Panic selling or capitulation |
| Red | ≥ 2.0 | VERY HIGH — Heavy distribution |
| Light Red | ≥ 1.5 | HIGH — Active selling |
| Pale Red | ≥ 1.0 | ELEVATED — Moderate selling |
| Muted Red | 0 to 1.0 | NORMAL — Routine down day |
| Dark Grey | < 0 | DRY — Light profit-taking |
Coiled State (Tan/Beige):
When detected, bars turn muted tan regardless of direction. This indicates:
- Volume compression (SUV below threshold for consecutive days)
- Volatility contraction (ATR below average)
- Price tightness (small recent moves)
Coiled states may precede significant breakouts.
Special Markers
"P" Label (Blue) — Pocket Pivot detected. Morales & Kacher's signal fires when:
- Price closes higher than previous close
- Price closes above the open (green candle)
- Volume exceeds the highest down-day volume of the last 10 bars
Pocket Pivots may indicate institutional buying before a traditional breakout.
"C" Label (Orange) — Coiled state confirmed. The stock is consolidating with compressed volume and tight price action. Watch for expansion.
Dashboard
The configurable dashboard displays real-time metrics. Default items:
- Vol — Current bar volume
- SUV — Z-score value
- Class — Classification (EXTREME/VERY HIGH/HIGH/ELEVATED/NORMAL/DRY/COILED)
- Proj RVol — Projected end-of-day relative volume (intraday only)
Additional optional items: Direction, Coil Status, Relative ATR, Pocket Pivot, Average Volume.
---
Practical Usage Tips
1. SUV ≥ 2 on breakouts — Validates the move has institutional participation
2. Watch for SUV < 0 bases — Quiet accumulation zones where smart money builds positions
3. Coil → Expansion — After consecutive coiled days, the first SUV ≥ 1.5 bar often signals direction
4. Pocket Pivots in bases — Early accumulation signals before price breaks out
5. Extreme SUV (≥3) after extended moves — May indicate climax/exhaustion rather than continuation
---
Settings Overview
| Group | Key Settings |
|-----------------|-----------------------------------------------------|
| SUV Settings | Lookback period (default 20) |
| Coil Detection | Enable/disable, sensitivity thresholds |
| Pocket Pivot | Enable/disable, lookback period |
| Display | Dashboard style (Ribbon/Table), position, text size |
| Dashboard Items | Toggle which metrics appear |
| Colors | Fully customizable gradient colors |
---
Credits
SUV concept adapted from academic literature on standardized unexpected volume in market microstructure research. Pocket Pivot methodology based on Gil Morales and Chris Kacher's work. Coil detection inspired by volatility contraction patterns.
---
This indicator does not provide financial advice. Always combine volume analysis with price action, market context, and proper risk management. No animals were harmed during the coding and testing of this indicator.

Algo & Dark Pool Activity - Find Hidden LiquidityThe script is designed to highlight potential algorithmic buying pressure and dark pool accumulation proxies on a TradingView chart. It overlays signals directly on price bars so you can visually spot when unusual activity may be occurring.

Combined: Net Volume, RSI & ATR# Combined: Net Volume, RSI & ATR Indicator
## Overview
This custom TradingView indicator overlays **Net Volume** and **RSI (Relative Strength Index)** on the same chart panel, with RSI scaled to match the visual range of volume spikes. It also displays **ATR (Average True Range)** values in a table.
## Key Features
### Net Volume
- Calculates buying vs selling pressure by analyzing lower timeframe data
- Displays as a **yellow line** centered around zero
- Automatically selects optimal timeframe or allows manual override
- Shows net buying pressure (positive values) and selling pressure (negative values)
### RSI (Relative Strength Index)
- Traditional 14-period RSI displayed as a **blue line**
- **Overlays directly on the volume chart** - scaled to match volume spike heights
- Includes **70/30 overbought/oversold levels** (shown as dotted red/green lines)
- Adjustable scale factor to fine-tune visual sizing relative to volume
- Optional **smoothing** with multiple moving average types (SMA, EMA, RMA, WMA, VWMA)
- Optional **Bollinger Bands** around RSI smoothing line
- **Divergence detection** - identifies regular bullish/bearish divergences with labels
### ATR (Average True Range)
- Displays current ATR value in a **table at top-right corner**
- Configurable period length (default: 50)
- Multiple smoothing methods: RMA, SMA, EMA, or WMA
- Helps assess current market volatility
## Use Cases
- **Momentum & Volume Confirmation**: See if RSI trends align with net volume flows
- **Divergence Trading**: Automatically spots when price makes new highs/lows but RSI doesn't
- **Volatility Assessment**: Monitor ATR for position sizing and stop-loss placement
- **Overbought/Oversold + Volume**: Identify exhaustion when RSI hits extremes with volume spikes
## Customization
All components can be toggled on/off independently. RSI scale factor allows you to adjust how prominent the RSI line appears relative to volume bars.

RVOL + Volume Z-Score (Textbook)This indicator is a relative-volume and “volume anomaly” dashboard designed to help you quickly spot when a ticker is actually in-play versus simply drifting on normal activity. It plots standard volume bars (colored by up/down candles) and overlays multiple optional smoothers of volume (SMA, LSMA/linear-regression MA, HMA, ALMA) so you can see whether participation is expanding or fading across different smoothing styles. It also calculates RVOL (current bar volume divided by the average volume over a user-defined lookback) and displays RVOL (and Z) in a small table for quick reference.
The core feature is a textbook volume z-score: Z=(V−SMA(V,N))/StDev(V,N)
This measures how far the current bar’s volume is from its recent average in standard-deviation units, making it easy to filter for genuinely unusual volume. The script plots mean + 1σ and mean + 2σ threshold bands and can highlight “anomaly” volume bars when Z exceeds your chosen σ thresholds (default 1σ for broader detection, with alerts available for 1σ/2σ). Use it as a participation filter: combine high RVOL / high Z with your price structure (key levels, VWAP, trend) to validate breakouts or identify high-conviction reversal/flush events.

Hull VWMA Crossover StrategyA simple variation on the Hull Moving Average which reacts faster to high volume events, making it more responsive in those cases than even the standard Hull average -- CREDIT GOES TO Saolof - -- Edited into a strategy with some more options that im going to continue to refine. LMK if theres any features or confluence you want me to add -- cheers!

Vector CPR Bands## Overview
The Vector CPR Bands indicator enhances the classic Central Pivot Range (CPR) by incorporating "vector" detection—identifying periods with above-average or climactic volume. It projects CPR ranges from these high-volume periods forward as visual bands, which act as persistent support/resistance zones until invalidated by price action. Ideal for spotting key levels in trending or ranging markets, especially on higher timeframes like weekly or monthly.
## Key Features
- **CPR Calculation**: Plots previous, developing (non-repainting), and repainting CPR with mid-pivot, TC (top central), and BC (bottom central) lines, plus fills.
- **Vector Detection**: Scans for high-volume bars in the anchor timeframe (default weekly). Flags "above-average" (≥1.5x avg) or "large" (≥2x avg or max climax).
- **Band Projection**: Creates bands from vector-qualified CPR periods. Extends them rightward until touched/revisited (configurable: invalidate on wick/close, delete or freeze/gray out).
- **Customization**:
- Timeframe: Set CPR anchor (e.g., 'W' for weekly, 'M' for monthly).
- Display: Toggle CPR types, pivot guides.
- Volume Thresholds: Adjust lookback and ratios.
- De-clutter: Limit max bands, pin to period start, always extend.
- **Alerts & Signals**: Built-in alerts for developing pivot crossing previous pivot (bullish/bearish).
## How to Use
1. Add to chart and set anchor timeframe (e.g., 'M' for monthly vCPR on BTC, as shown in example charts).
2. Watch bands as S/R: Virgin (untested) bands often provide strong bounces; mitigated ones fade.
3. Combine with volume/price action: Bullish bands suggest upside bias, especially if price holds above.
4. Example: On BTC weekly, vector bands from high-volume weeks highlight multi-month zones—breaks signal shifts.

Large Order DetectionHow It Works:
Green diamonds appear below bullish candles (close > open) when large volume is detected
Red diamonds appear above bearish candles (close < open) when large volume is detected
Diamond size scales based on how much larger the volume is compared to the average:
Smallest: 2-2.5x average volume
Medium: 2.5-4x average volume
Larger: 4-6x average volume
Largest: 6x+ average volume
Features:
Customizable threshold - Default is 2x average volume, but you can adjust this
Adjustable lookback - Default 50 bars for calculating average volume
Size range control - Set minimum and maximum diamond sizes
Subtle background highlight - Shows when large orders occur
Built-in alerts - Can notify you when large orders are detected
Usage Tips:
Lower timeframes (1-5min) will show more frequent large orders
Increase threshold multiplier (2.5-3.0x) on high-volume assets to reduce noise
Watch for clusters of same-colored diamonds = strong directional pressure
Red diamonds at resistance + bearish EMAs = strong sell signal
Green diamonds at support + bullish EMAs = strong buy signal

RVOL CandlesRvol indicator shows relative volume on each candle and can be adjusted and color change.
5x Relative Volume vs 30-Day AverageRelative Volume.
If today's volume is more than average of last 30 days volume by 5x.

Relative Volume (Multi-TF, D, W, M)Relative Volume (Multi-TF, Candle-Matched Colors)
This indicator measures Relative Volume (RVOL) — the ratio of current volume to average historical volume — across any higher timeframe (Daily, Weekly, or Monthly) and displays it as color-coded columns that match the candle colors of the chart you’re viewing.
RVOL reveals how active today’s market participation is compared to its typical rhythm.
RVOL = 1.0 → normal volume
>1.5 → rising interest
>2.0–3.0 → strong institutional participation
>5.0 → climax or exhaustion levels
Features
Works on any chart timeframe while computing RVOL from your chosen higher timeframe (e.g., show Daily RVOL while trading on a 5-minute chart).
Column colors automatically match your chart’s candle colors (green/red/neutral).
Adjustable lookback period (len) and selectable source timeframe (D, W, or M).
Pre-drawn horizontal guide levels at 1.0, 1.2, 1.5, 2, 3, and 5 for quick interpretation.
Compatible with all chart types, including Heikin Ashi or custom color schemes.
Typical Use
Swing trading:
Look for quiet bases where RVOL stays 0.4–0.9, then expansion ≥2 on breakout days.
Confirm follow-through when green days keep RVOL ≥1.2–1.5 and red pullbacks stay below 1.0.
Day trading:
Watch intraday RVOL (on 1–5m charts) for bursts ≥2 that sustain for several bars — this signals crowd engagement and valid momentum.
Interpretation Summary
RVOL Value Meaning Typical Action
0.4–0.9 Quiet base / low interest Watch for setup
1.0 Normal activity Neutral
1.2–1.5 Valid participation Early confirmation
2–3 Strong expansion Momentum / breakout
≥5 Climax / exhaustion Take profits or avoid new entries
Author’s note:
RVOL isn’t directional; it tells how many players are active, not who’s winning. Combine it with structure (levels, VWAP, or trend) to see when the market crowd truly commits.

RVol (Daily and PreMarket)RVol with distinction between Pre-Market and Active Trading
Also ration of pre-market to Ave Daily Vol
Realtime rVOL w/ Candle Highlight [Blk0ut]About This Script
Realtime rVOL Table + Candle Highlight (Presets, No Smoothing)
By Blk0ut
This tool visualizes real-time relative volume (rVOL) directly on your chart and in a compact table, helping traders identify where intraday participation deviates from the session’s baseline.
Unlike standard volume overlays, this script recalculates rVOL dynamically through the session and highlights candles when participation exceeds configurable thresholds — providing a clear picture of ignition zones, volume surges, and potential breakout conditions.
Core Features
-Realtime rVOL tracking: Displays the current bar’s relative volume ratio compared to a moving baseline of recent bars.
-Preset Profiles: Choose from four purpose-built profiles to quickly adjust the rVOL sensitivity to your trading horizon.
----------------------------------------------------------------------
*Opening Rush: 100-bar lookback, threshold 2.5*
*RTH 5m: 30-bar lookback, threshold 1.2*
*RTH 1hr: 50-bar lookback, threshold 1.5*
*RTH 1d+: 100-bar lookback, threshold 1.5*
----------------------------------------------------------------------
RTH-only filter: Option to limit the moving average baseline to regular market hours (09:30–16:00).
Candle highlighting: Optionally outlines candles when rVOL exceeds the active threshold to emphasize spikes visually in real time.
Table display: Compact dashboard showing current rVOL, raw volume, average baseline, and preset parameters.
How To Use
Select a preset that matches your timeframe or trading style.
Scalpers and open traders can use RTH 5m or Opening Rush.
Position or swing traders may prefer RTH 1hr or RTH 1d+.
Watch for rVOL readings above the threshold (and colored candle outlines). These often correspond to momentum ignition, news impact, or institutional activity.
Combine with VWAP, ORB, or intraday key levels for best confirmation.
Notes
The table automatically adapts to your chart corner choice.
Highlight thresholds can follow the preset or be set manually.
Color intensity tiers (High/Medium/Low) can be tuned in settings.
Designed for intraday and session-based traders who rely on live volume context rather than end-of-day stats.

Overnight Z/VolRatio SignalThis indicator highlights overnight setups where both volatility expansion and prior-day range deviation suggest directional opportunity at the RTH open.
It calculates:
• Overnight Z-Score (Z_long): how far the overnight session’s range tilts from the 20-day overnight mean, standardized by its standard deviation.
• VolRatio: ratio of the current RTH session volume to the 20-day average, a proxy for participation and conviction.
Signal Logic (LONG bias)
A long-bias condition triggers when:
• Z_long ≥ 0.40 (overnight tilt strongly positive)
• VolRatio ≥ 1.30 (above-average RTH volume)
• Optional filters: R1/R4 region alignment, YDH/YDL proximity, and other context flags.
Visuals mark qualifying days with colored labels and session highlights.
It is intended as a context signal — not an auto-trading system — for SPY/SPX/ES or correlated large-cap indices.
Usage Notes
• Works best when applied to daily or intraday 5m chart with extended hours enabled.
• Typical exit: ~150 minutes after 09:30 ET.
• Fridays are optionally excluded to avoid expiration-related distortions.

RVol+ Enhanced Relative Volume Indicator📊 RVol+ Enhanced Relative Volume Indicator
Overview
RVol+ (Relative Volume Plus) is an advanced time-based relative volume indicator designed specifically for swing traders and breakout detection. Unlike simple volume comparisons, RVol+ analyzes volume at the same time of day across multiple sessions, providing statistically significant insights into institutional activity and breakout potential.
🎯 Key Features
Core Volume Analysis
Time-Based RVol Calculation - Compares current cumulative volume to the average volume at this exact time over the past N days
Statistical Z-Score - Measures volume in standard deviations from the mean for true anomaly detection
Volume Percentile - Shows where current volume ranks historically (0-100%)
Sustained Volume Filter - 3-bar moving average prevents false signals from single-bar spikes
Breakout Detection
🚀 Confirmed Breakouts - Identifies price breakouts validated by high volume (RVol > 1.5x)
⚠️ False Breakout Warnings - Alerts when price breaks key levels on low volume (high failure risk)
Multi-Timeframe Context - Weekly volume overlay prevents chasing daily noise
Advanced Metrics
OBV Divergence Detection - Spots bullish/bearish accumulation/distribution patterns
Volume Profile Integration - Identifies institutional positioning
Money Flow Analysis - Tracks smart money vs retail activity
Extreme Volume Alerts - 🔥 Labels mark unusual spikes beyond the display cap
Visual Intelligence
Smart Color Coding:
🟢 Bright Teal = High activity (RVol ≥ 1.5x)
🟡 Medium Teal = Caution zone (RVol ≥ 1.2x)
⚪ Light Teal = Normal activity
🟠 Orange = Breakout confirmed
🔴 Red = False breakout risk
Comprehensive Stats Table:
Current Volume (formatted as M/K/B)
RVol ratio
Z-Score with significance
Volume percentile
Historical average and standard deviation
Sustained volume confirmation
📈 How to Use
For Swing Trading (1D - 3W Holds)
Perfect Setup:
✓ RVol > 1.5x (bright teal)
✓ Z-Score > 2.0 (⚡ alert)
✓ Percentile > 90%
✓ Sustained = ✓
✓ 🚀 Breakout label appears
Avoid:
✗ Red "Low Vol" warning during breakouts
✗ RVol < 1.0 at key levels
✗ Sustained volume not confirmed
Signal Interpretation
⚡ Z>2 Labels - Statistically significant volume (95th+ percentile) - highest probability moves
↗️ OBV+ Labels - Bullish accumulation (OBV rising while price consolidates)
↘️ OBV- Labels - Bearish distribution (OBV falling while price rises)
🔵 Blue Background - Weekly volume elevated (confirms daily strength)
⚙️ Customization
Basic Settings
N Day Average - Number of historical days for comparison (default: 5)
RVol Thresholds - Customize highlight levels (default: 1.2x, 1.5x)
Visual Display Cap - Prevent extreme spikes from compressing view (default: 4.0x)
Advanced Metrics (Toggle On/Off)
Z-Score analysis
Weekly RVol context
OBV divergence detection
Volume percentile ranking
Breakout signal generation
Table Customization
Position - 9 placement options to avoid chart overlap
Size - Tiny to Huge
Colors - Full customization of positive/negative/neutral values
Transparency - Adjustable background
Debug Mode
Enable Pine Logs for calculation transparency
Adjustable log frequency
Real-time calculation breakdown
🔬 Technical Details
Algorithm:
Binary search for historical lookups (O(log n) performance)
Time-zone aware session detection
DST-safe timestamp calculations
Exponentially weighted standard deviation
Anti-repainting architecture
Performance:
Optimized for max_bars_back = 5000
Efficient array management
Built-in function optimization
Memory-conscious data structures
📊 What Makes RVol+ Different?
vs. Standard Volume:
Context-aware (time-of-day matters)
Statistical significance testing
False breakout filtering
vs. Basic RVol:
Z-Score normalization (2-3 sigma detection)
Multi-timeframe confirmation
OBV divergence integration
Sustained volume filtering
Smart visual scaling
vs. Professional Tools:
Free and open-source
Fully customizable
No black-box algorithms
Educational debug logs
💡 Best Practices
Wait for Confirmation - Don't enter on first bar; wait for sustained volume ✓
Combine with Price Action - RVol validates, price structure determines entry
Weekly Context Matters - Blue background = institutional interest
Z-Score is King - Focus on ⚡ alerts for highest probability
Avoid Low Volume Breakouts - Red ⚠️ labels = high failure risk
🎓 Trading Psychology
Volume precedes price. When RVol+ shows:
High RVol + Rising OBV = Accumulation before breakout
High RVol at Resistance = Test of conviction
Low RVol on Breakout = Retail-driven (fade candidate)
Z-Score > 3 = Potential "whale" positioning
📝 Credits
Based on the time-based RVol concept from /u/HurlTeaInTheSea, enhanced with:
Statistical analysis (z-scores, percentiles)
Multi-timeframe integration
OBV divergence detection
Professional-grade visualization
Swing trading optimization
🔧 Version History
v2.0 - Enhanced Edition
Added Z-Score analysis
Multi-timeframe volume context
OBV divergence detection
Breakout confirmation system
Smart color coding
Customizable stats table
Debug logging mode
Performance optimizations
📚 Learn More
For optimal use with swing trading:
Combine with support/resistance levels
Watch for volume clusters in consolidation
Use weekly timeframe for trend confirmation
Monitor OBV divergence for early warnings
⚠️ Disclaimer
This indicator is for educational purposes. Volume analysis is one component of trading decisions. Always use proper risk management, consider multiple timeframes, and validate signals with price structure. Past performance does not guarantee future results.
🚀 Getting Started
Add indicator to chart
Adjust "N Day Average" to your preference (5-10 days typical)
Position stats table to avoid overlap
Enable features you want to monitor
Watch for 🚀 breakout confirmations!
Happy Trading! 📈

Relative Performance Indicator - TrendSpider StyleRelative Performance Indicator - TrendSpider Style
📈 Overview
This Relative Performance (RP) indicator measures how your stock is performing compared to a benchmark index, displayed as a percentile ranking from 0-100. Based on TrendSpider's methodology, it answers the critical question: "Is this stock a leader or a laggard?"
Unlike simple ratio charts, this indicator uses percentile ranking to normalize relative performance, making it easy to identify when a stock is showing exceptional strength (>80) or concerning weakness (<20) compared to its historical relationship with the benchmark.
✨ Key Features
Three Calculation Modes:
Quarterly: 3-month relative performance for swing trading
Yearly: Weighted 4-quarter performance for position trading
TechRank: Composite of 6 technical indicators for multi-factor analysis
Clean Visual Design:
Green fills above 80 (strong outperformance)
Red fills below 20 (significant underperformance)
Dotted median line at 50 for quick reference
Current value label for instant reading
Flexible Benchmarks:
Compare against major indices (SPY, QQQ, IWM)
Sector ETFs for within-sector analysis
Custom symbols for specialized comparisons
Built-in Alerts:
Strong performance zone entry (>80)
Weak performance zone entry (<20)
Median crossovers (50 level)
📊 How To Use
Buy Signals:
RP crosses above 80: Stock entering leadership status
RP holding above 60: Maintaining relative strength
RP rising while price consolidating: Accumulation phase
Sell/Avoid Signals:
RP drops below 50: Losing relative strength
RP below 20: Significant underperformance
RP falling while price rising: Bearish divergence
Sector Rotation:
Compare multiple assets to find strongest sectors
Rotate into high RP assets (>70)
Exit low RP positions (<30)
🎯 Reading The Values
80-100: Exceptional outperformance - Strong buy/hold
60-80: Moderate outperformance - Hold positions
40-60: Market perform - No edge
20-40: Underperformance - Caution/reduce
0-20: Severe underperformance - Avoid/exit
⚙️ Calculation Method
Calculates percentage performance of both your stock and the benchmark
Finds the performance differential
Ranks this differential against historical values using percentile analysis
Normalizes to 0-100 scale for easy interpretation
This percentile approach adapts to different market conditions and volatility regimes, providing consistent signals whether in trending or choppy markets.
💡 Pro Tips
For Growth Stocks: Use quarterly mode with QQQ as benchmark
For Value Stocks: Use yearly mode with SPY as benchmark
For Small Caps: Compare against IWM, not SPY
For Sector Analysis: Use sector ETFs (XLK, XLF, XLE, etc.)
Combine with Price Action: High RP + price breakout = powerful signal
⚠️ Important Notes
RP is relative, not absolute - stocks can fall with high RP if the market falls harder
Choose appropriate benchmarks for meaningful comparisons
Best used in conjunction with price action and volume analysis
Historical lookback period affects sensitivity (adjustable in settings)
🔧 Customization
Fully customizable visual settings, thresholds, calculation periods, and smoothing options. Adjust the normalization lookback period (default 252 days) to fine-tune sensitivity to your trading timeframe.
📌 Credit
Inspired by TrendSpider's Relative Performance implementation, adapted for TradingView with enhanced customization options and Pine Script v6 optimization.
Tags to include: relativeperformance, relativestrength, percentile, ranking, sectorrotation, benchmark, outperformance, trendspider, marketbreadth, strengthindicator
Category: Momentum Indicators / Trend Analysis
Feel free to modify this description to match your style or add any specific points you want to emphasize!
