Non-Repainting Renko Emulation Strategy [PineIndicators]Introduction: The Repainting Problem in Renko Strategies
Renko charts are widely used in technical analysis for their ability to filter out market noise and emphasize price trends. Unlike traditional candlestick charts, which are based on fixed time intervals, Renko charts construct bricks only when price moves by a predefined amount. This makes them useful for trend identification while reducing small fluctuations.
However, Renko-based trading strategies often fail in live trading due to a fundamental issue: repainting .
Why Do Renko Strategies Repaint?
Most trading platforms, including TradingView, generate Renko charts retrospectively based on historical price data. This leads to the following issues:
Renko bricks can change or disappear when new data arrives.
Backtesting results do not reflect real market conditions. Strategies may appear highly profitable in backtests because historical data is recalculated with hindsight.
Live trading produces different results than backtesting. Traders cannot know in advance whether a new Renko brick will form until price moves far enough.
Objective of the Renko Emulator
This script simulates Renko behavior on a standard time-based chart without repainting. Instead of using TradingView’s built-in Renko charting, which recalculates past bricks, this approach ensures that once a Renko brick is formed, it remains unchanged .
Key benefits:
No past bricks are recalculated or removed.
Trading strategies can execute reliably without false signals.
Renko-based logic can be applied on a time-based chart.
How the Renko Emulator Works
1. Parameter Configuration & Initialization
The script defines key user inputs and variables:
brickSize : Defines the Renko brick size in price points, adjustable by the user.
renkoPrice : Stores the closing price of the last completed Renko brick.
prevRenkoPrice : Stores the price level of the previous Renko brick.
brickDir : Tracks the direction of Renko bricks (1 = up, -1 = down).
newBrick : A boolean flag that indicates whether a new Renko brick has been formed.
brickStart : Stores the bar index at which the current Renko brick started.
2. Identifying Renko Brick Formation Without Repainting
To ensure that the strategy does not repaint, Renko calculations are performed only on confirmed bars.
The script calculates the difference between the current price and the last Renko brick level.
If the absolute price difference meets or exceeds the brick size, a new Renko brick is formed.
The new Renko price level is updated based on the number of bricks that would fit within the price movement.
The direction (brickDir) is updated , and a flag ( newBrick ) is set to indicate that a new brick has been formed.
3. Visualizing Renko Bricks on a Time-Based Chart
Since TradingView does not support live Renko charts without repainting, the script uses graphical elements to draw Renko-style bricks on a standard chart.
Each time a new Renko brick forms, a colored rectangle (box) is drawn:
Green boxes → Represent bullish Renko bricks.
Red boxes → Represent bearish Renko bricks.
This allows traders to see Renko-like formations on a time-based chart, while ensuring that past bricks do not change.
Trading Strategy Implementation
Since the Renko emulator provides a stable price structure, it is possible to apply a consistent trading strategy that would otherwise fail on a traditional Renko chart.
1. Entry Conditions
A long trade is entered when:
The previous Renko brick was bearish .
The new Renko brick confirms an upward trend .
There is no existing long position .
A short trade is entered when:
The previous Renko brick was bullish .
The new Renko brick confirms a downward trend .
There is no existing short position .
2. Exit Conditions
Trades are closed when a trend reversal is detected:
Long trades are closed when a new bearish brick forms.
Short trades are closed when a new bullish brick forms.
Key Characteristics of This Approach
1. No Historical Recalculation
Once a Renko brick forms, it remains fixed and does not change.
Past price action does not shift based on future data.
2. Trading Strategies Operate Consistently
Since the Renko structure is stable, strategies can execute without unexpected changes in signals.
Live trading results align more closely with backtesting performance.
3. Allows Renko Analysis Without Switching Chart Types
Traders can apply Renko logic without leaving a standard time-based chart.
This enables integration with indicators that normally cannot be used on traditional Renko charts.
Considerations When Using This Strategy
Trade execution may be delayed compared to standard Renko charts. Since new bricks are only confirmed on closed bars, entries may occur slightly later.
Brick size selection is important. A smaller brickSize results in more frequent trades, while a larger brickSize reduces signals.
Conclusion
This Renko Emulation Strategy provides a method for using Renko-based trading strategies on a time-based chart without repainting. By ensuring that bricks do not change once formed, it allows traders to use stable Renko logic while avoiding the issues associated with traditional Renko charts.
This approach enables accurate backtesting and reliable live execution, making it suitable for trend-following and swing trading strategies that rely on Renko price action.
Repaint

Octopus Nest Strategy Hello Fellas,
Hereby, I come up with a popular strategy from YouTube called Octopus Nest Strategy. It is a no repaint, lower timeframe scalping strategy utilizing PSAR, EMA and TTM Squeeze.
The strategy considers these market factors:
PSAR -> Trend
EMA -> Trend
TTM Squeeze -> Momentum and Volatility by incorporating Bollinger Bands and Keltner Channels
Note: As you can see there is a potential improvement by incorporating volume.
What's Different Compared To The Original Strategy?
I added an option which allows users to use the Adaptive PSAR of @loxx, which will hopefully improve results sometimes.
Signals
Enter Long -> source above EMA 100, source crosses above PSAR and TTM Squeeze crosses above 0
Enter Short -> source below EMA 100, source crosses below PSAR and TTM Squeeze crosses below 0
Exit Long and Exit Short are triggered from the risk management. Thus, it will just exit on SL or TP.
Risk Management
"High Low Stop Loss" and "Automatic High Low Take Profit" are used here.
High Low Stop Loss: Utilizes the last high for short and the last low for long to calculate the stop loss level. The last high or low gets multiplied by the user-defined multiplicator and if no recent high or low was found it uses the backup multiplier.
Automatic High Low Take Profit: Utilizes the current stop loss level of "High Low Stop Loss" and gets calculated by the user-defined risk ratio.
Now, follows the bunch of knowledge for the more inexperienced readers.
PSAR: Parabolic Stop And Reverse; Developed by J. Welles Wilders and a classic trend reversal indicator.
The indicator works most effectively in trending markets where large price moves allow traders to capture significant gains. When a security’s price is range-bound, the indicator will constantly be reversing, resulting in multiple low-profit or losing trades.
TTM Squeeze: TTM Squeeze is a volatility and momentum indicator introduced by John Carter of Trade the Markets (now Simpler Trading), which capitalizes on the tendency for price to break out strongly after consolidating in a tight trading range.
The volatility component of the TTM Squeeze indicator measures price compression using Bollinger Bands and Keltner Channels. If the Bollinger Bands are completely enclosed within the Keltner Channels, that indicates a period of very low volatility. This state is known as the squeeze. When the Bollinger Bands expand and move back outside of the Keltner Channel, the squeeze is said to have “fired”: volatility increases and prices are likely to break out of that tight trading range in one direction or the other. The on/off state of the squeeze is shown with small dots on the zero line of the indicator: red dots indicate the squeeze is on, and green dots indicate the squeeze is off.
EMA: Exponential Moving Average; Like a simple moving average, but with exponential weighting of the input data.
Don't forget to check out the settings and keep it up.
Best regards,
simwai
---
Credits to:
@loxx
@Bjorgum
@Greeny

Ehlers Combo Strategy🚀 Presenting the Enhanced Ehlers Combo Strategy 🚀
Hello Traders! 👋 I'm thrilled to share the latest version of the Ehlers Combo Strategy v2.0. This powerful algorithm combines Ehlers Elegant Oscillator, Decycler, Instantaneous Trendline, Spearman Rank, and introduces the Signal to Noise Ratio for even more precise trading signals.
📊 Strategy Highlights:
Ehlers Elegant Oscillator: Captures market momentum and turning points.
Ehlers Decycler: Filters out market noise for clearer trend signals.
Instantaneous Trendline: Offers a dynamic view of the market trend.
Spearman Rank: Analyzes market rank correlations for enhanced insights.
Signal to Noise Ratio (SNR): Filters out noise for more accurate signals.
💡 Key Features & Customizations:
Adaptive Length: Enable adaptive length based on the market's current conditions.
SNR Threshold: Set your desired SNR threshold for filtering signals.
Exit Length: Define the length for exit signals.
📈 Trading Signals:
Long Entry: Elegant Oscillator and Decycler cross above 0, source crosses above Decycler, source is greater than an increasing Instantaneous Trendline, Spearman Rank is positive, and SNR exceeds the threshold.
Long Exit: Source crosses below the Instantaneous Trendline after entering a long position.
Short Entry: Elegant Oscillator and Decycler cross below 0, source crosses below Decycler, source is less than a decreasing Instantaneous Trendline, Spearman Rank is negative, and SNR exceeds the threshold.
Short Exit: Source crosses above the Instantaneous Trendline after entering a short position.
📊 Insights & Enhancements:
Dynamic Length: The strategy adapts its length dynamically based on market conditions.
Improved SNR: Signal to Noise Ratio ensures better filtering of signals.
Enhanced Visualization: The Elegant Oscillator now features improved color coding for a clearer interpretation.
🚨 Disclaimer:
Trading involves risk, and this script should be used judiciously. It's not a guaranteed profit machine, but with careful use, it can be a valuable addition to your toolkit.
Feel free to backtest, tweak, and make it your own! Let's conquer the markets together! 💪📈
🚀✨ Happy Trading! ✨🚀
---
🙌 Credits:
A big shoutout to the original contributors:
@blackcat1402
@cheatcountry
@DasanC

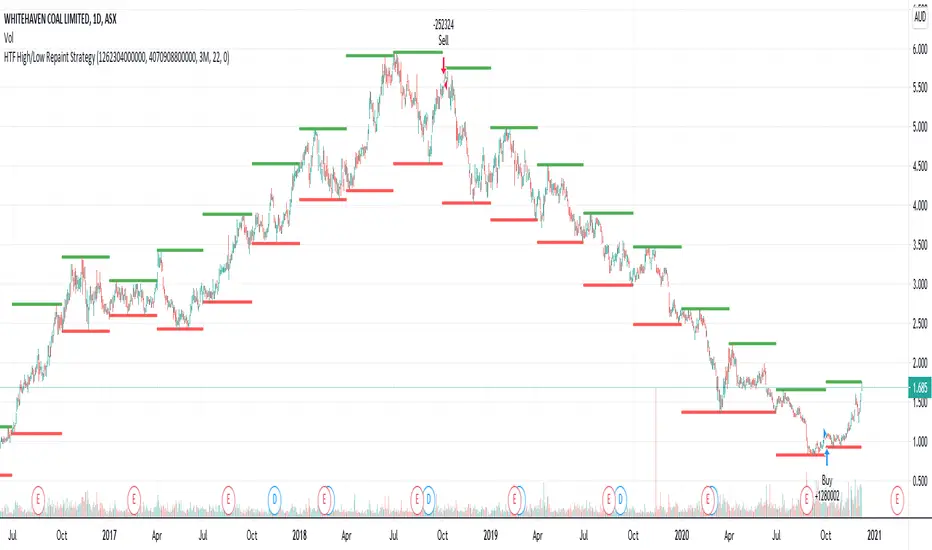
HTF High/Low Repaint StrategyHere is an another attempt to demonstrate repainting and how to avoid them. It happened few times to me that I develop a strategy which is giving immense returns - only to realize after few forward testing that it is repainting. Sometimes, it is well disguised even during forward testing.
In this simple strategy, conditions are as below:
Buy : When a 3M bar produces high and low higher than it's previous 3M bar high, low
Sell : When a 3M bar produces high and low lower than its previous 3M bar high, low.
Default setting is : lookahead = on and offset = 0
This means current 3M bar high low is plotted for all the daily bars within this month. Which means, strategy looks ahead of time to see this 3M bar high is higher than previous 3M bar high during the start of the first daily bar. Hence, this combination leads to massive repaint.
For example, trade made on October 2nd 2018 already knows well ahead of time that price is going to go down in next 3 months:
Similarly, after 2 years on October 2nd 2020 - the strategy already knows that last 3M high is going to be breached on 7th December 2020
Solution: If you are using security for higher timeframes, safer option is always to use offset 1. Further details in the trading view script:
BUT
It may still repaint if we are passing function to security.
For example:
f_secureSecurity(_symbol, _res, _src) => security(_symbol, _res, _src , lookahead = barmerge.lookahead
This function will likely avoid any repainting with Higher timeframe if we are passing in built variables such as high, low, close, open etc. But, if we try to pass supertrend, this will not produce right results. This is because supertrend calculation in turn uses high/low/close values which do not consider the offset while calculating. Hence, even with offset 1, this will still produce issues.
Hence, the call:
= f_secureSecurity(syminfo.tickerid, derivedResolution, supertrend(3,10), offset) will again lead to massive repainting. Solution to this is to implement supertrend function and use high, low, close values derived from secureSecurity.
Quick tips to identify or be suspicious about repainting
Unbelievable results on all timeframes and all instruments with both long and short trades
Lower timeframes giving significantly higher returns on backtest when compared to higher timeframe
If these things happen, be wary about repainting and do a through check of all security function usage in your strategy.
All the best :)
PS: Apply 3-5 days resolution and see the fun. Also, WHC is one hell of a Christmas tree. Could have made immense profit in the same strategy even without repainting.
Upper Timeframe - Repaint FixThis script is a proof of concept and one possible solution for how to deal with upper timeframe repainting issues. It works for Strategies only .
Strategies that utilize data from upper timeframes can still be subject to repainting issues when forward testing. Users can copy the code and use a similar solution in your own scripts.
For full code commentary, explanations and examples visit the backtest-rookies (.com) website.
14/28 Day SMA Divergence and RSI - No RepaintIf you are interested in purchasing my algorithmic trading bot that receives Tradingview indicator alerts via email and then executes them in Bittrex, please visit my product page here: ilikestocks.com Additionally, I would love to create video/blog guides on creating Tradingview scripts or strategies. If you are a knowledgeable in finance or other related fields and would like to be featured on my page, please contact me at tanner@ilikestocks.com.
No crossovers were used in this script, and this is likely the reason for the no repaint(Correct me if wrong).
This strategy script uses a 14-day SMA signal line, a 28-day SMA and RSI. The strategy works by determining whether the (14-day SMA is above the 28-day SMA and the RSI levels are overbought(below 30)) or RSI is very overbought(below 13 or so). Once either of these conditions have been met, a long position is opened.
The initial long position must be partially closed by the take profit first and then the final close is executed if the 14-day signal SMA is below the 28-day SMA; you may also exclusively use take profit to close positions.
The green plotted spikes are the initial long position conditions. The orange plotted spikes are take profit signals once a long position is opened. The red plotted spikes are plotted when the SMA 14-day is below the 28-day SMA.
Please do leave constructive criticism or comments below because it helps me better create scripts!

GMAE Original (By Kevin Manrrique)This script is called GMAE Original by me (Kevin Manrrique). I'm publishing this to the public because we are all traders and we need to support each other as a TVcommunity. This is something I built for fun. This script uses a series of EMA's. NO REPAINT, NO LAGGING! It works better for short-term trends as you can see. Please leave the copyright on the script at all times even if you rebuild it. If you need any help or have questions please inbox me privately. If you interested in joining up and building an indicator or strategy please inbox me as well. Thank you and I hope you enjoy this script as much as I do.
Remember there are no holy grails. The only holy grail there is are indicators built together to stop faulty signals and be as accurate as possible and this is one of them.
Sincerely,
Kevin Manrrique

Daily Close Comparison Strategy (by ChartArt via sirolf2009)Comparing daily close prices as a strategy.
This strategy is equal to the very popular "ANN Strategy" coded by sirolf2009(1) which calculates the percentage difference of the daily close price, but this bar-bone version works completely without his Artificial Neural Network (ANN) part.
Main difference besides stripping out the ANN is that my version uses close prices instead of OHLC4 prices, because they perform better in backtesting. And the default threshold is set to 0 to keep it simple instead of 0.0014 with a larger step value of 0.001 instead of 0.0001. Just like the ANN strategy this strategy goes long if the close of the current day is larger than the close price of the last day. If the inverse logic is true, the strategy goes short (last close larger current close). (2)
This basic strategy does not have any stop loss or take profit money management logic. And I repeat, the credit for the fundamental code idea goes to sirolf2009.
(2) Because the multi-time-frame close of the current day is future data, meaning not available in live-trading (also described as repainting), is the reason why this strategy and the original "ANN Strategy" coded by sirolf2009 perform so excellent in backtesting.
All trading involves high risk; past performance is not necessarily indicative of future results. Hypothetical or simulated performance results have certain inherent limitations. Unlike an actual performance record, simulated results do not represent actual trading. Also, since the trades have not actually been executed, the results may have under- or over-compensated for the impact, if any, of certain market factors, such as lack of liquidity. Simulated trading programs in general are also subject to the fact that they are designed with the benefit of hindsight. No representation is being made that any account will or is likely to achieve profits or losses similar to those shown.
(1) You can get the original code by sirolf2009 including the ANN as indicator here:
(1) and this is sirolf2009's very popular strategy version of his ANN:
