RSI Call-outs [BigBitsIO]This is a simple RSI indicator that overlays the current chart to show labels for specified oversold and overbought areas defined with inputs.
It will delete any labels of the same kind within the last 3 candles so you don't see as many labels as you would otherwise.
Red labels with white text represent overbought RSI levels as defined by the user.
Green labels with black test represent oversold RSI levels as defined by the user.
This RSI overlay help easily call-out overbought and oversold candles on a chart without sacrificing screen space for a traditional RSI indicator that is not overlayed on the chart.
Repaint

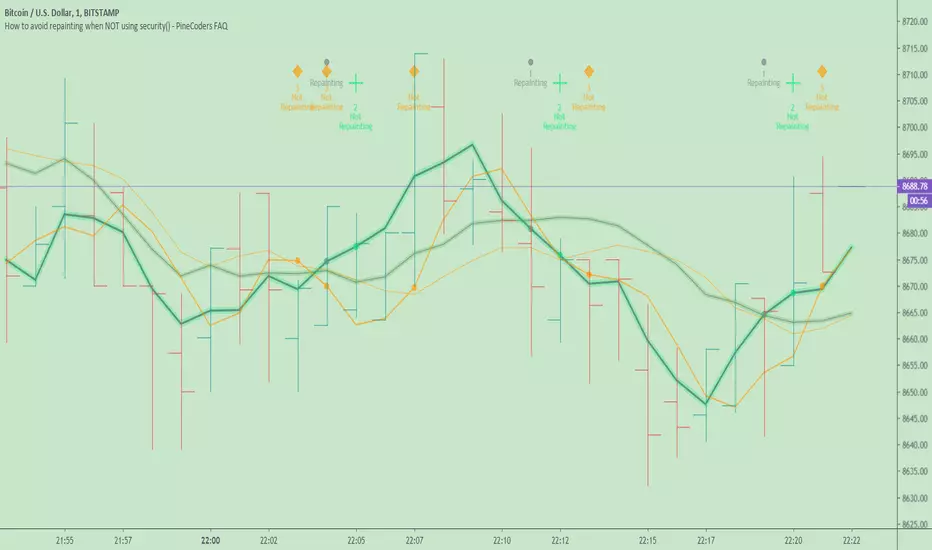
How to avoid repainting when NOT using security()Even when your code does not use security() calls, repainting dynamics still come into play in the realtime bar. Script coders and users must understand them and, if they choose to avoid repainting, need to know how to do so. This script demonstrates three methods to avoid repainting when NOT using the security() function.
Note that repainting dynamics when not using security() usually only come into play in the realtime bar, as historical data is fixed and thus cannot cause repainting, except in situations related to stock splits or dividend adjustments.
For those who don’t want to read
Configure your alerts to trigger “Once Per Bar Close” and you’re done.
For those who want to understand
Put this indicator on a 1 minute or seconds chart with a live symbol. As price changes you will see four of this script’s MAs (all except the two orange ones) move in the realtime bar. You are seeing repainting in action. When the current realtime bar closes and becomes a historical bar, the lines on the historical bars will no longer move, as the bar’s OHLC values are fixed. Note that you may need to refresh your chart to see the correct historical OHLC values, as exchange feeds sometimes produce very slight variations between the end values of the realtime bar and those of the same bar once it becomes a historical bar.
Some traders do not use signals generated by a script but simply want to avoid seeing the lines plotted by their scripts move during the realtime bar. They are concerned with repainting of the lines .
Other traders use their scripts to evaluate conditions, which they use to either plot markers on the chart, trigger alerts, or both. They may not care about the script’s plotted lines repainting, but do not want their markers to appear/disappear on the chart, nor their alerts to trigger for a condition that becomes true during the realtime bar but is no longer true once it closes. Those traders are more concerned with repainting of signals .
For each of the three methods shown in this script’s code, comments explain if its lines, markers and alerts will repaint or not. Through the Settings/Inputs you will be able to control plotting of lines and markers corresponding to each method, as well as experiment with the option, for method 2, of disabling only the lines plotting in the realtime bar while still allowing the markers and alerts to be generated.
An unavoidable fact is that non-repainting lines, markers or alerts are always late compared to repainting ones. The good news is that how late they are will in many cases be insignificant, so that the added reliability of the information they provide will largely offset the disadvantages of waiting.
Method 1 illustrates the usual way of going about things in a script. Its gray lines and markers will always repaint but repainting of the alerts the marker conditions generate can be avoided by configuring alerts to trigger “Once Per Bar Close”. Because this gray marker repaints, you will occasionally see it appear/disappear during the realtime bar when the gray MAs cross/un-cross.
Method 2 plots the same MAs as method 1, but in green. The difference is that it delays its marker condition by one bar to ensure it does not repaint. Its lines will normally repaint but its markers will not, as they pop up after the condition has been confirmed on the bar preceding the realtime bar. Its markers appear at the beginning of the realtime bar and will never disappear. When using this method alerts can be configured to trigger “Once Per Bar” so they fire the moment the marker appears on the chart at the beginning of the realtime bar. Note that the delay incurred between methods 1 and 2 is merely the instant between the close of a realtime bar and the beginning of the next one—a delay measured in milliseconds. Method 2 also allows its lines to be hidden in the realtime bar with the corresponding option in the script’s Settings/Inputs . This will be useful to those wishing to eliminate unreliable lines from the realtime bar. Commented lines in method 2 provide for a 2b option, which is to delay the calculation of the MAs rather than the cross condition. It has the obvious inconvenient of plotting delayed MAs, but may come in handy in some situations.
Method 3 is not the best solution when using MAs because it uses the open of bars rather than their close to calculate the MAs. While this provides a way of avoiding repainting, it is not ideal in the case of MA calcs but may come in handy in other cases. The orange lines and markers of method 3 will not repaint because the value of open cannot change in the realtime bar. Because its markers do not repaint, alerts may be configured using “Once Per Bar”.
Spend some time playing with the different options and looking at how this indicator’s lines plot and behave when you refresh you chart. We hope everything you need to understand and prevent repainting when not using security() is there.
Look first. Then leap.
Zero Phase Filtering [Repaint] - ExperimentalImportant !
The indicator is for experimental purpose only, it must not be used as a decisional tool but only as a visual one (like Zig-Zag, Fractal etc). The information this indicator display is uncertain and subject to drastic changes over time. If you have further question feel free to pm me.
Introduction
Most of the filters you will find are causal, this mean that they depend on present and past input values, this explain the lag they produce. Non causal filters however will use future input values. A well know way to get a zero-phase filter is by using the forward backward method, but this is not possible in pinescript as i recall. So we have to use some kind of function that will display future values, this is possible using the security function in version 2 or the one in version 3 using barmerge.lookahead_on .
The Use Of A Repainting Indicator
Its always better to filter data in order to have a clearer view of what is happening, this can be useful when doing some forecasting or doing less formal kind of analysis. However since it repaint you cant use it as a signal provider or use signals of other indicators using this filter as source.
For example if you want to forecast a smooth indicator, the forecast of this indicator under normal circumstances could still have lag associated with it, so you would have to react before your forecast, this wont happen if you apply this filter as your indicator source.
The Filter
We smooth with a simple moving average the price provided by the security function twice, length control the smoothing level. Since security depend on the time frame you are in you must select your time frame in the indicator parameter selection window.
Filtering using 45 minutes time frame close price in a 5 minutes chart, we fix this by selecting our time frame.
Consider the fact that the input of the indicator is just periodic price, so sometimes the lag can sometimes be less or more than 0 and the estimation not centered.
The indicator can work on time frames up to 1h, after that the filter have some lag, i tried fixing this and i ended up having data errors.
Applying our filter as source for the rsi oscillator.
Conclusion
It is possible to have a kind of zero-phase filters, but it would be better if pinescript could support backward indexing thus making us able to do forward backward filtering.
Since noise can affect our analysis, applying smoothing without having to use offset in plot can be considered useful.

ZigZag Repaint Examplesimple example showing how to use na to create straight lines that "repaint" as the latest bars update.
