MTF MA Ribbon and Bands + BB, Gaussian F. and R. VWAP with StDev█ Multi Timeframe Moving Average Ribbon and Bands + Bollinger Bands, Gaussian Filter and Rolling Volume Weighted Average Price with Standard Deviation Bands
Up to 9 moving averages can be independently applied.
The length , type and timeframe of each moving average are configurable .
The lines, colors and background fill are customizable too.
This script can also display:
Moving Average Bands
Bollinger Bands
Gaussian Filter
Rolling VWAP and Standard Deviation Bands
Types of Moving Averages:
Simple Moving Average (SMA)
Exponential Moving Average (EMA)
Smoothed Moving Average (SMMA)
Weighted Moving Average (WMA)
Volume Weighted Moving Average (VWMA)
Least Squares Moving Average (LSMA)
Hull Moving Average (HMA)
Arnaud Legoux Moving Average (ALMA)
█ Moving Average
Moving Averages are price based, lagging (or reactive) indicators that display the average price of a security over a set period of time.
A Moving Average is a good way to gauge momentum as well as to confirm trends, and define areas of support and resistance.
█ Bollinger Bands
Bollinger Bands consist of a band of three lines which are plotted in relation to security prices.
The line in the middle is usually a Simple Moving Average (SMA) set to a period of 20 days (the type of trend line and period can be changed by the trader, a 20 day moving average is by far the most popular).
The SMA then serves as a base for the Upper and Lower Bands which are used as a way to measure volatility by observing the relationship between the Bands and price.
█ Gaussian Filter
Gaussian filter can be used for smoothing.
It rejects high frequencies (fast movements) better than an EMA and has lower lag.
A Gaussian filter is one whose transfer response is described by the familiar Gaussian bell-shaped curve.
In the case of low-pass filters, only the upper half of the curve describes the filter.
The use of gaussian filters is a move toward achieving the dual goal of reducing lag and reducing the lag of high-frequency components relative to the lag of lower-frequency components.
█ Rolling VWAP
The typical VWAP is designed to be used on intraday charts, as it resets at the beginning of the day.
Such VWAPs cannot be used on daily, weekly or monthly charts. Instead, this rolling VWAP uses a time period that automatically adjusts to the chart's timeframe.
You can thus use the rolling VWAP on any chart that includes volume information in its data feed.
Because the rolling VWAP uses a moving window, it does not exhibit the jumpiness of VWAP plots that reset.
Made with the help from scripts of: adam24x, VishvaP, loxx and pmk07.
Ribbon

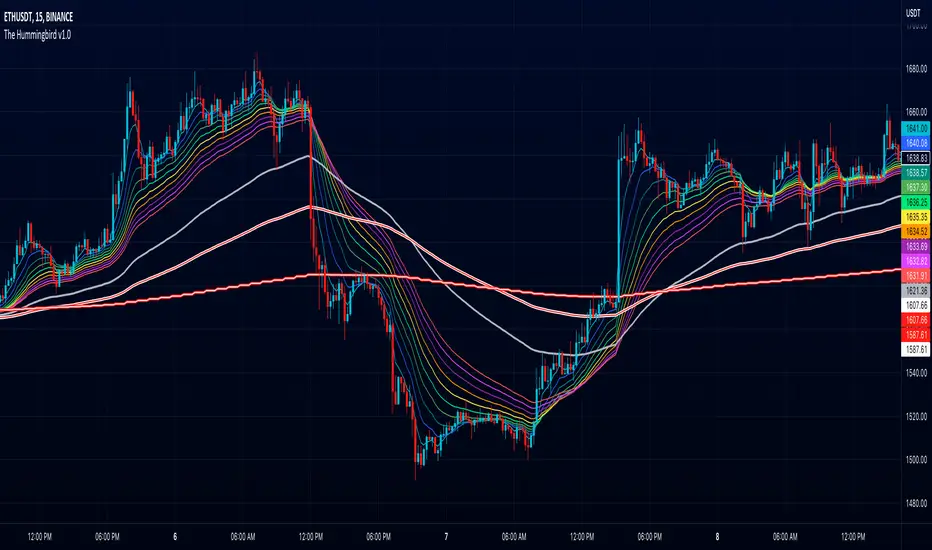
The Hummingbird - MA Ribbon by Joe (EMA, SMA, SMMA, WMA, VWMA)Tired of having to add multiple moving average indicators to your chart? Well, stop doing that. No, really. Listen. Adding duplicate indicators is totally not cool. And, it won't go over well at the next HOA meeting if you keep doing it.
Here's the sweet moving average ribbon you've been waiting for (with 1-10 moving average lines!). It will make your charts look much cooler 😎. And you'll gain the respect of all your neighbors if you add it to your charts.
In all seriousness, this is a slimmed-down version of my other super-awesome script with a stupid name, "Joe's Ultimate MA Ribbon (w/ Crossover Triggers)."
Basically, I removed the crossover signals from it and changed the name to a much superior name, "The Hummingbird."
Yeah. Right on. So, if you don't want or need the crossover signals, go right on humming with "The Hummingbird."
Enjoy, friends. 🍻
If you still want the original ribbon with crossover signals, get it here .
Options:
Show/Hide MA Lines: Only show the lines you wanna see. No more. No less.
MA Type (can be different for each line!): EMA , SMA , SMMA (RMA), WMA , VWMA
MA Source (for each line): open, close, high, low, hl2 , hlc3, ohlc4, hlcc4
MA Length (for each line): any number between 1 and 4999
Line Colors: Ooh, pretty.
MTF EMA Ribbon & Bands + BBMulti Timeframe Exponential Moving Average Ribbon & Bands + Boillinger Bands
I used the script "EMA Ribbon - low clutter, configurable " by adam24x, I made some color change and I added a few indicators (Boillinger Bands, EMA on multi timeframe and EMA bands from "34 EMA Bands " by VishvaP).
The script can display various EMA from the chart's timeframe but also EMA from other timeframes.
Bollinger Bands and EMA bands can also be added to the chart.

pickle financialversion 1.0
A multi-use indicator
FEATURES:
1) Robust VWAP with up to 3 deviations that can be adjusted for Session, Week, Month, Quarter, Year, Decade, Century, Earnings , Dividend, & Split intervals
2) 20 customizable Moving Averages that can be changed to EMAs, SMAs , WMAs, SMMAs, and VWMAs; can also be adjusted to Candle Closes, Highs, Lows, Opens, HLC3, HL2 , OHLC4, & HLCC4
-Praise be lady VWAP

.srb suite pin-upThe essential suite Indicator
that are well integrated to ensure visibility of essential items for trading.
it is very cumbersome to put symbol in the Tradingview chart and combine essential individual indicators one by one.
Moreover even with such a combination, the chart is messy and visibility is not good.
This is because each indicator is not designed with the others in mind.
This suite was developed as a composite-solution to that situation, and will make you happy.
--> This is steamlined pin-up version of .srb suite.
--> A minimal set of indicators for comparing different symbols.
--> This is well-balanced alternative next version of previous .b pin-up symbol
BTC-agg. Volume
4 BTC-spot & 4 BTC-PERP volume aggregated.
It might helps you don't miss out on important volume flows.
Weighted to spot trading volume when using PERP+spot volume .
If enabled, BTC-agg.Vol automatically applied when selecting BTC-pair.
--> This is used in calculations involving volumes, such as VWAP .
Moving Average
1 x JMA trend ribbon ; Accurately follow short-term trend changes.
2 x EMA ribbon ; zone , not the line.
MA extension line ; It provide high visibility to recognize the direction of the MA.
SPECIAL TOOLS
BB regular (Dev. 2.0, 2.5)
BB Extented (Dev. 2.5, 3.0, 3.5)
SPECIAL TOOLS - Ultra Volume Marking
x2 x4 greater than regular average volume, it will help you can take the reversal
It does not directly indicate volume, but ultra-volume marking is enough for compare.
---------------------------------------------------------------------------------------------------------------------------------------
if you have any questions freely contact to me by message on tradingview
but please understand that responses may be quite late.
Special thanks to all of contributors of community.
The script may be freely distributed under the MIT license.

.srb suiteThe essential suite Indicator.
that are well integrated to ensure visibility of essential items for trading.
it is very cumbersome to put symbol in the Tradingview chart and combine essential individual indicators one by one.
Moreover even with such a combination, the chart is messy and visibility is not good.
This is because each indicator is not designed with the others in mind.
This suite was developed as a composite-solution to that situation, and will make you happy.
designed to work in the same pane with open-source indicator by default.
Recommended visual order ; Back = .srb suite, Front = .srb suite vol & info
individually turn on/off only what you need on the screen.
BTC-agg. Volume
4 BTC-spot & 4 BTC-PERP volume aggregated.
It might helps you don't miss out on important volume flows.
Weighted to spot trading volume when using PERP+spot volume .
If enabled, BTC-agg.Vol automatically applied when selecting BTC-pair.
--> This is used in calculations involving volumes, such as VWAP.
Moving Average
1 x JMA trend ribbon ; Accurately follow short-term trend changes.
3 x EMA ribbon ; zone , not the line.
MA extension line ; It provide high visibility to recognize the direction of the MA.
SPECIAL TOOLS
VWAP with Standard Deviation Bands
VWAP ruler
BB regular (Dev. 2.0, 2.5)
BB Extented (Dev. 2.5, 3.0, 3.5)
Fixed Range Volume Profile ; steamlined one, performace tuned & update.
SPECIAL TOOLS - Auto Fibonacci Retracement - New GUI
'built-in auto FBR ' has been re-born
It shows - retracement Max top/ min bottom ; for higher visibility
It shows - current retracement position ; for higher visibility
The display of the Fib position that exceeds the regular range is auto-determined according to the price.
tradingview | chart setting > Appearance > Top margin 0%, Bottom margin 0% for optimized screen usage
tradingview | chart setting > Appearance > Right margin 57
.srb suite vol & info --> Visual Order > Bring to Front
.srb suite vol & info --> Pin to scale > No scale (Full-screen)
Visual order ; Back = .srb suite, Front = .srb suite vol & info
1. Fib.Retracement core is from tradingview built-in FBR ---> upgrade new-type GUI, and performance tuned.
2. Fixed-range volume-profile core is from the open-source one ---> some update & perf.tuned.
---------------------------------------------------------------------------------------------------------------------------------------
if you have any questions freely contact to me by message on tradingview.
but please understand that responses may be quite late.
Special thanks to all of contributors of community.
The script may be freely distributed under the MIT license.

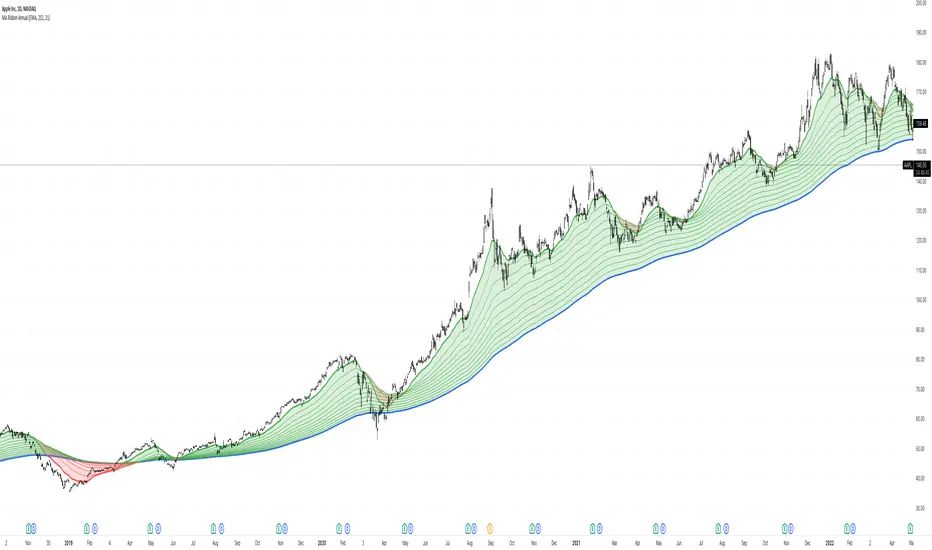
MA Ribbon AnnualThis script starts with the 252 E(S)MA and steps it down 21 days per MA. The starting ribbon (Annual Moving Avg Length) and step-downs (Monthly Step Downs) are adjustable.
The goal of this script is to quickly see if prices respect a certain MA length more than another. Monthly lengths were chosen because of their relation to earnings and other reports.
Timeframed Moving Average RibbonAdded timeframe inputs for each of the moving averages in the stock TradingView Moving Average Ribbon indicator.
Now one can use a combination of different moving averages such as the following without readjusting the indicator's settings when switching the chart's timeframes:
- 390 period 5 minute (5 day equivalent) SMA
- 150 period 1 day (30 week equivalent) EMA
- 200 period 1 week (50 month equivalent) SMA
- 50 period chart timeframe SMA
- 100 period chart timeframe SMA
- 200 period chart timeframe SMA

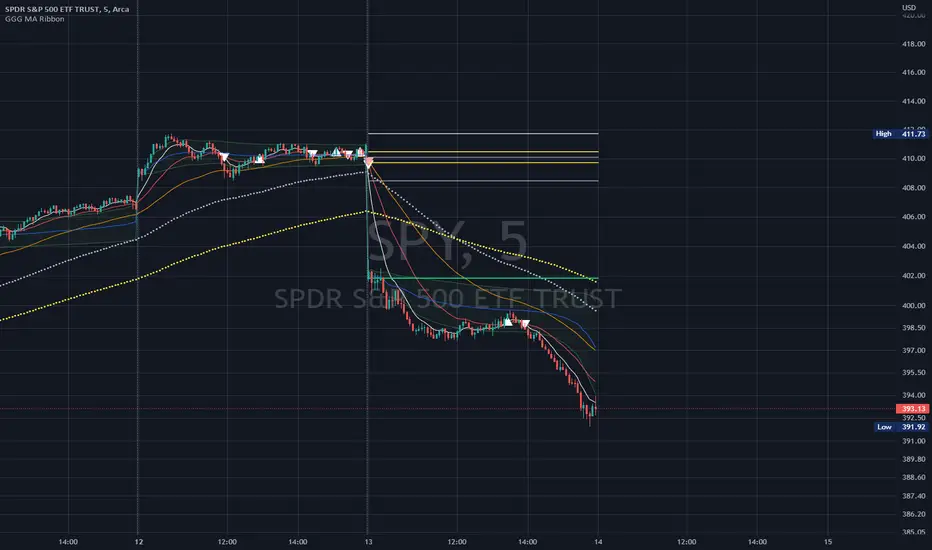
GoGoGadget MA RibbonMoving Average Ribbon with defaults for day-trading
8, 21, 50 EMAs
MA cross(over/under) markers
MA cross(over/under) alert conditions preconfigured
Reversal time periods highlight background or add labels for periods on standard days when reversals are likely (mainly useful for SPY or QQQ)
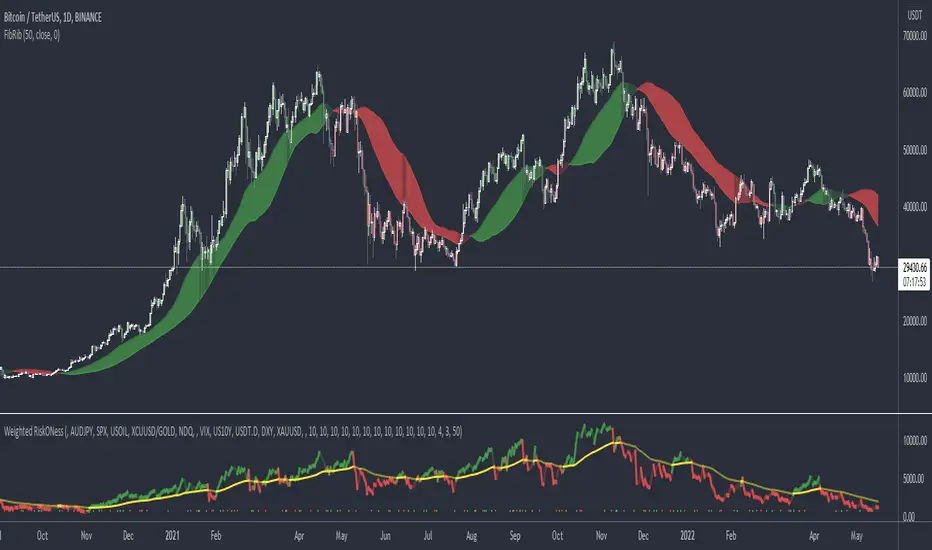
Fibonacci RibbonThe Fibonacci Ribbon (FibRib) creates two Fibonacci moving averages: essentially a Fibonacci WMA and a Fibonacci EMA.
The ribbon colors based on which is higher and where PA is relative to the ribbon.
Optional colored candles shades candles the same color as the ribbon.
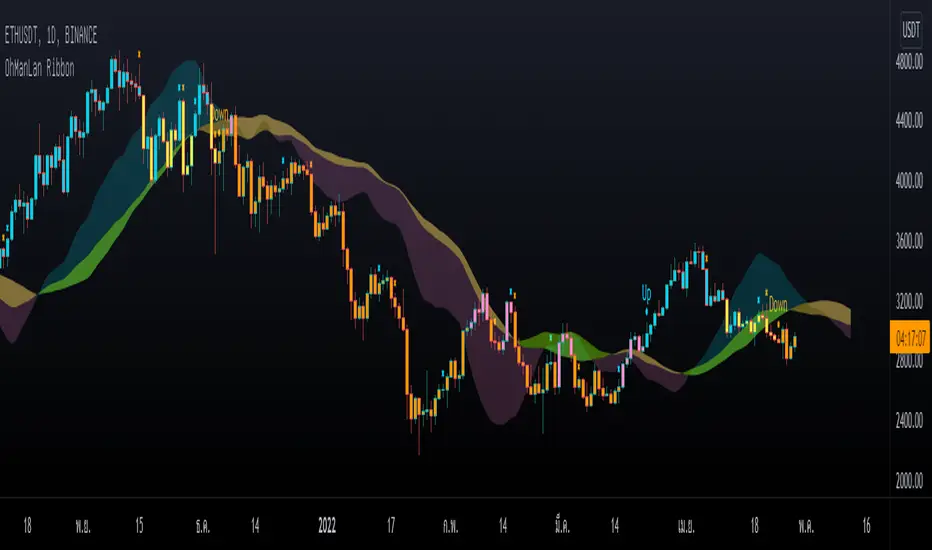
OhManLan RibbonWe focus on reducing the chance of loss. And trying to fix the Ribbon's main problem is signal lag. and more pseudo-signals when adjusting faster
What is OhManLan Ribbon?
1.) Up/Down signals that indicate a trend
2.) Partial Take-Profit signals that can be used as break-off signals
3.) OML Cloud that can be used as a support/resistance, as a stop loss or trailing stop, tells the strength of a trend and can also help reduce false up/down signals.
OhManLan Ribbon is an indicator that will make chart analysis easier for the crypto market.
### OML Colud
The cloud are a visual representation of support and resistance , And its color also represents the strength of the trend, Using the cloud here allows smoother components.
- How to use -
Buy when bar closes in Blue and Sell when bar closes in Orange, There are words to help you with reading the Up and Down signal, X is a Take-Profit signal. Sell partially when bar closes, Can be used with other indicators such as RSI (Divergence), Stochastic to confirm the accuracy.
---------------------------------------
เราให้ความสำคัญกับการลดโอกาสขาดทุน และพยายามแก้ไขปัญหาหลักของ Ribbon คือความล่าช้าของสัญญาณ และสัญญาณหลอกที่มากขึ้นเมื่อปรับค่าให้เร็วขึ้น
OhManLan Ribbon มีอะไรบ้าง?
1.) สัญญาณ Up/Down ที่บอกให้ทราบถึงแนวโน้ม
2.) สัญญาณ Partial Take-Profit ที่สามารถใช้เป็นสัญญาณแบ่งปิดทำกำไร
3.) OML Cloud ที่สามารถใช้เป็นแนวรับ-ต้าน, ใช้เป็นจุด Stop loss หรือ Trailing stop, บอกความแข็งแรงของเเนวโน้มและยังสามารถช่วยลดสัญญาณหลอกจาก Up/Down Signal ได้ด้วย
OhManLan Ribbon คือ Indicator ที่จะช่วยให้คุณวิเคราะห์กราฟได้ง่ายขึ้นสำหรับตลาดคริปโต
### วิธีการใช้งานเบื้องต้น
Up/Down Signals
- Up หมายถึง เทรนขาขึ้น สามารถเล่น Buy ได้
- Down หมายถึง เทรนขาลง สามารถเล่น Sell ได้
- Ribbon (Options): OML V4 ใช้ได้ทั่วไป, SaiDao ใช้สำหรับ Altcoins
*เตือน
- Up ไม่ได้หมายถึง แท่งเทียนสีฟ้า
- Down ไม่ได้หมายถึง แท่งเทียนสีส้ม
Up/Down สามารถขึ้นที่แท่งเทียนสีไหนก็ได้
*ทริคเสริม
แท่งเทียนสีชมพู สามารถ Buy บางส่วนได้หากมี RSI Divergence
แท่งเทียนสีเหลือง สามารถ Sell บางส่วนได้หากมี RSI Divergence
---------------------------------------
Partial Take-Profit Signals (X Signals)
- x สีส้ม หมายถึง แบ่งปิดทำกำไรสำหรับ Up Signal
- X สีฟ้า หมายถึง แบ่งปิดทำกำไรสำหรับ Down Signal
---------------------------------------
OML Cloud
- สามารถใช้เป็นแนวรับ-ต้าน, จุด Stop loss หรือ Trailing stop
- สามารถช่วยลดสัญญาณหลอก Up/Down
สีของ OML Cloud
-ฟ้า/เขียว หมายถึง เทรนขาขึ้นที่แข็งแรง
-ฟ้า/เหลือง หมายถึง เทรนขาขึ้นเริ่มอ่อนแรง
-ชมพู/เหลือง หมายถึง เทรนขาลงที่แข็งแรง
-ชมพู/เขียว หมายถึง เทรนขาลงเริ่มอ่อนแรง
---------------------------------------
### อย่าหาทำ
X อย่าพึ่งพา OhManLan Ribbon เพียงตัวเดียว
X อย่าซื้อขายตาม Up/Down Signal แล้วพูดว่ายอมขาดทุนไปเถอะเวลาได้ก็กินคำใหญ่ แบบนี้ไม่เอา การเทรดไม่ใช่ของเล่นจะมาทำเล่น ๆ พูดมักง่าย ๆ ไม่ได้แบบนี้ไม่เอา
X ถ้าไม่มีทักษะอื่นมาร่วมวิเคราะห์ ก็พยายามหลีกเลี่ยง Altcoin ไว้ก่อน
X หลีกเลี่ยงการเทรดบน Time frame ระยะกลางและระยะสั้น ***TF ที่เหมาะสมที่สุดคือ 1 Day (ระยะสั้น ได้แก่ 5-15-30 นาที, ระยะกลาง ได้แก่ 60-120 นาที)
Any RibbonThis indicator displays a ribbon of two individually configured Fast and Slow and Moving Averages for a fixed time frame. It also displays the last close price of the configured time frame, colored green when above the band, red below and blue when interacting. A label shows the percentage distance of the current price from the band, (again red below, green above, blue interacting), when the price is within the band it will show the percentage distance from median of the band.
The Fast and Slow Moving Averages can be set to:
Simple Moving Average (SMA)
Exponential Moving Average (EMA)
Weighted Moving Average (WMA)
Volume-Weighted Moving Average (VWMA)
Hull Moving Average (HMA)
Exponentially Weighted Moving Average (RMA) (SMMA)
Linear regression curve Moving Average (LSMA)
Double EMA (DEMA)
Double SMA (DSMA)
Double WMA (DWMA)
Double RMA (DRMA)
Triple EMA (TEMA)
Triple SMA (TSMA)
Triple WMA (TWMA)
Triple RMA (TRMA)
Symmetrically Weighted Moving Average (SWMA) ** length does not apply **
Arnaud Legoux Moving Average (ALMA)
Variable Index Dynamic Average (VIDYA)
Fractal Adaptive Moving Average (FRAMA)
I wrote this script after identifying some interesting moving average bands with my AMACD indicator and wanting to see them on the price chart. As an example look at the interactions between ETHBUSD 4hr and the band of VIDYA 32 Open and VIDYA 39 Open. Or start from the good old BTC Bull market support band, Weekly EMA 21 and SMA 20 and see if you can get a better fit. I find the Double RMA 22 a better fast option than the standard EMA 21.

[HuD] Bursa RibbonAs retail traders in Bursa Malaysia, before taking our position we must make sure that the chart we chose is an uptrend counter.
So this indicator can assist us to identify whether the chart is an uptrend or downtrend.
This indicator consist of 3 "ribbon"
🔰 First one is the combination of ema5 and ema10.
> lightest green when ema5 > ema10
> lightest red when ema10 > ema5
🔰 2nd Ribbon, combination of ema30 and ema50
> light green when ema30 > ema50
> light red when ema50 > ema30
🔰 3rd Ribbon, combination of ema70 and ema90
> dark green when ema70 > ema90
> dark red when ema90 > ema70
🔰 Ribbon also act as support and resistance
> We can use it to enter a trade when it retraces and "rests" on 1st or 2nd Ribbon
🔰 Blue Dot
> Blue dots = ema20
> When the candle drop below the blue dot, please take extra caution when you want to enter/hold your trade.
How to Use :
✅ Only enter a trade when all ribbons are green
✅ Do not take a position when candles are far from 1st Ribbon
✅ When the candle retrace inside Ribbon 1 or 2, do can monitor closely to enter BUY position.
- Please consider other factors such as volume, SnR, and RSI
Example :
Strong Uptrend Counter ( All Ribbons are green )
Strong Downtrend Counter ( All Ribbons are red )
Counter that has the potential to change from Downtrend to Uptrend
Other Info from this indicator
- Green candle is a breakout candle. When candle breakout the highest previous 5 candles with volume is higher than the previous 5 volume
- Table information : Volume, Value = Volume x Price
✅ Please open as many charts as possible and see how this ribbon shape reacts. Some ribbons will look steep and others are a bit sloping
Thanks and Happy Trading 😎

Average True Range (VStop) GuppyThis script allows Volatility Stop, an average true range-based indicator, to be plotted like a "Guppy" multiple moving average indicator. Backtesting results seem pretty good when a solid majority of the lines are in agreement.
Of course, as is customary with my scripts, the user can select the length, source, and multiple for any of the ATR lines plotted and customize the visuals how they want.
Value added:
As far as I know, there aren't any ATR-based indicators that quite do this -- setting up a "Guppy" actually seems to help quite a lot with seeing the overall big picture & capturing the meat of a trend.

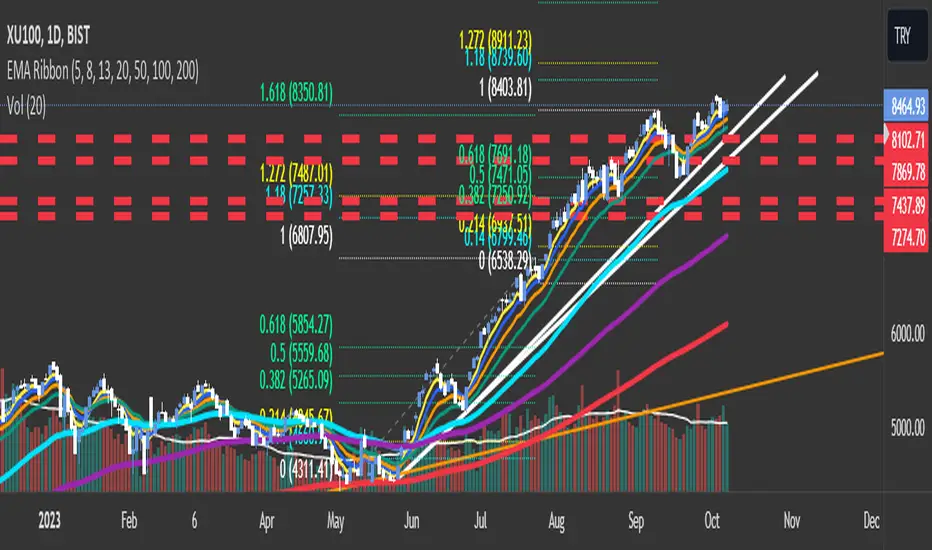
EMA RibbonI added 7 EMA in a ribbon form ( basically, I took from the open script base and just combined them)
By default:
To see Short trends ( Alligator)
EMA(5)
EMA(8)
EMA(13)
To See Longer Trends
EMA(20)
EMA(50)
EMA(100)
EMA(200)
Cheers
T3 Super GuppyA Tillson T3 moving average implemented variation of the CM Super Guppy indicator by @FritzMurphy
The T3 moving average was developed by Tom Tilson which combines multiple EMAs into a single moving average. it is smoother and more responsive compared to traditional moving averages. The disadvantage is that it can overshoot price.
█ Description
T3 Super Guppy consists of 20 T3 moving averages:
• 7 fast T3 MAs
• 13 slow T3 MAs
Visuals:
• Compact view available for chart minimalists
• In compact view only 10 of the fastest T3 moving averages will be displayed
• Compact view will not affect how the colour scales with trend movement
• Ribbon transparency will automatically scale based on the display mode chosen
Colour Gradient
• The more T3 MAs that cross above or below their slower counterparts will result in how deep the chosen upTrend(Blue) or downTrend(Red) colour is displayed
• Helps to spot weakening trends or reversal signals when indicator colour starts converging into the opposite colour
• Single colour mode is available if you find the colour gradient distracting
█ Credits
@ChrisMoody original guppy idea:
@FritzMurphy super guppy format:
█ Examples
compact view:
full view:

Momentum RibbonThe Momentum Ribbon is a collection of Moving Averages which indicate the severity of pull-backs in a given market.
As the ribbon spreads apart, it indicates more and more significant support/resistance for a trending market. As it is compressed back together, it displays a blue colour to indicate a "cooling" of trend momentum.
Adjustable Moving Average periods and types! You can customize the parameters of your ribbon to your heart's content!

MEGA_RIBBON_3000🏀 MEGA_RIBBON_3000 is a set of 11 Exponential Moving Averages (EMA), pushing to the limit what's doable with a free member account.

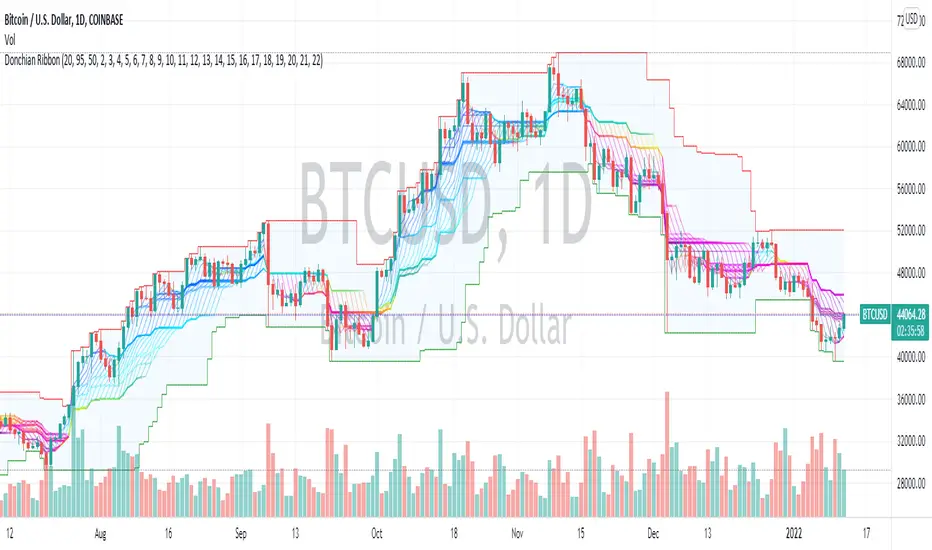
Donchian Range, RSI, and Levels SystemThe Donchian average is defined as average(highest, lowest) for a given period length. By plotting many different lengths, clustering of the lines seems to form natural support/resistance levels. A Donchian Channel and RSI rainbow colors are also provided to define the range and trend.
Cloud Ribbon ++ by [JohnnySnow]Inspired by my favorite EMA ribbon - "EMA Ribbon " by fskrypt.
This Ribbon ADD the option to choose the avarage algorithm of the ribbon .
Created also to be more friendly to read along with trendlines and Fibonacci retracements.
For those like me that NOT use this ribbon to find exact price action but instead, to have a grasp of possible Support/Resistance strenght ahead.
High transparency lines and a configurable color palette for filling the background give the ribbon a look of support/ Resistance cloud Strenght.
Each MA length, line, and background color can be easily configured.

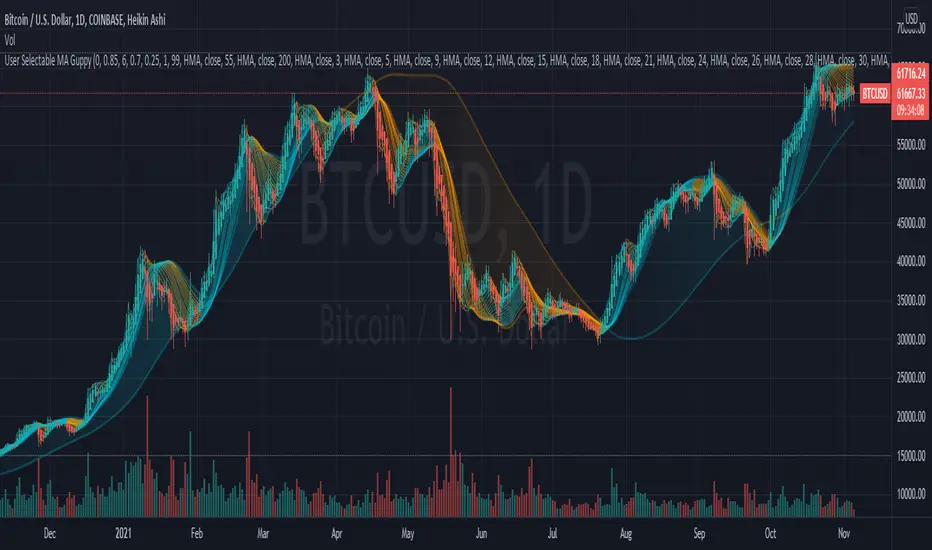
User Selectable Moving Average GuppyA version of the popular "Moving Average Ribbon" or "Guppy" indicators, except nearly everything about it is user selectable. The user can change the source, period, and type of moving average used for every single line on the chart. Note: The visuals are fairly intensive and may take a moment to catch up after adjusting settings.
Credit: This script utilizes the "Color Gradient Framework" tutorial by LucF (PineCoders) to create gradient visuals, which are also customizable for the user.
Moving Average Options:
Running (SMoothed) Moving Average (RMA or SMMA) - Slowest
Simple Moving Average (SMA) - Slow
Exponential Moving Average (EMA) - Responds faster to price than SMA
Weighted Moving Average (WMA)
Volume-Weighted Moving Average (VWMA)
Triple EMA (TEMA)
Exponential Hull Moving Average (EHMA) - Hull with Smoothing (Slower than Hull)
Least Squares Moving Average (LSMA) - Simple Linear Regression
Arnaud Legoux Moving Average (ALMA) - Adjustable, set offset=1 to be current, offset=0.85 for good smoothing (Slower)
Hull Moving Average (HMA) - Normally responds fastest to price of all options
Value Added :
This script is unique in that it allows the user to chart the "Guppy", except nearly everything about it is customizable. The user can change the source, period, and type of moving average used for every single line.
Typically, the Guppy is plotted with simple moving average or exponential moving average, which respond much slower to price than the Hull Moving Average, which this indicator uses as default. (Elimination of lag)
The Hull MA settings for the highest time frame moving averages should work well for assessing the overall macro trend, with a nice visual presentation. Additional labels and alerts for the macro trend are available.
Furthermore, this script provides many more options for type of moving average than is typical for a moving average indicator that provides the user with options, including advanced options such as Hull, TEMA, and ALMA.
The visual presentation is customizable and should provide some entertainment for users who want to create pretty charts.
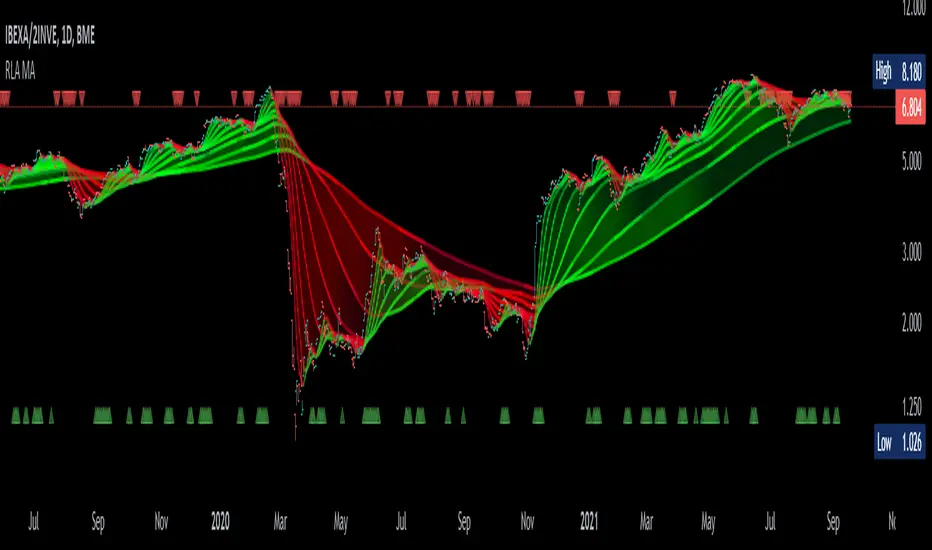
Alma Moving Average Ribbon Reverse Length [DM]Greetings Colleagues
Following some recommendations and ideas I share this moving average, put all of them together
The length calculation is automatic there is only one input.
The length is inverse so it will wrap from the longest reference point, hence using phi
Moving averages will wrap around the price.
I've also added gradient color to plots and fill plots
There is an alert selector in case you are interested in a particular crossing, "remember that the order is reversed".
There is an alert visual plotshapes with offset signal.
Finally, after spending a few hours with the Williams alligator moving averages I found nothing special, but I added the individual offset adjustment for each moving average in case someone comes up with something.
Enjoy”
Some references about alma by "tradingview pinecoders"
What to look for
The Arnaud Legoux Moving Average has three elements to it:
Window: This element is the period. By default, the window is set to 9 periods, but it can be customized to fit any trading style.
Offset: This element is the Gaussian that is applied to the combo line and can be aligned to the current price. It’s default is set to 0.85, but by setting it to 1, you can make it align fully to the current price (similar to how an Exponential Moving Average (EMA) with a setting of 0 is like a Simple Moving Average (SMA)). 0.85 is what is recommended, however, you can customize it like with the window element.
Sigma: This element is a standard deviation that is applied to the combo line in order for it to appear more sharp. The default is set to 6 and it is not recommended to change the setting. The value of 6 is inspired by the Six Sigma process.
www.tradingview.com
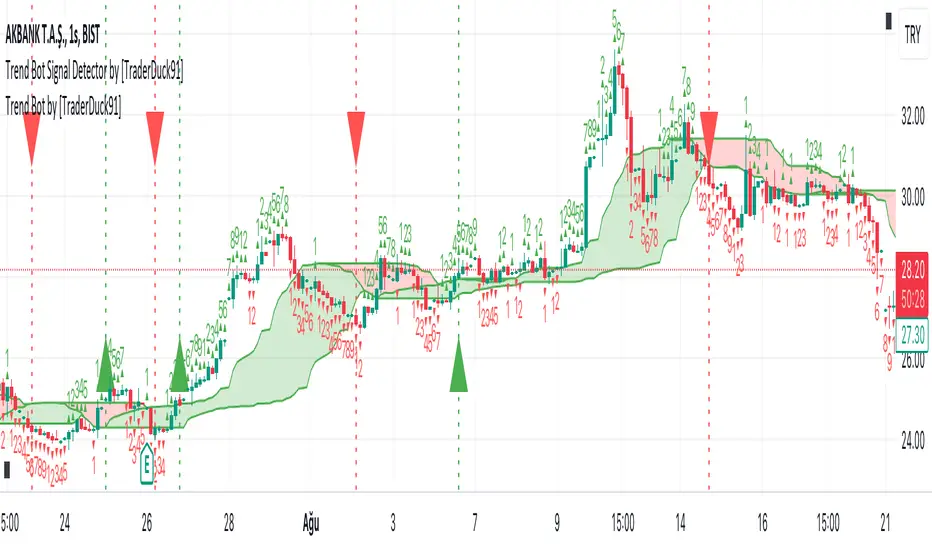
Trend Bot by [ToplaninKizlarUcuyoruz]Description:
1. Just a moving average strategy used in this indicator.
2. If the src2 (you can change it in settings) close above highest MA, appear the long signal.
3. And if the src2 close under the lowest MA, appear the short signal.
How is it using:
Green is an uptrend. Red is a downtrend.
-If you see the green up triangle signal, open long (and close short)
-If you see the red down triangle signal, open short (and close long)
*** Please check signals with your own strategy and your favorite indicators ***
inspired by the original open source indicator and added some new setting options:
(click on the image to open the original indicator's page)