INSTITUTIONAL MOMENTUM [@Ash_TheTrader]⚡ The Impulse Engine: Institutional Velocity & Smart Structure System
Subtitle/Short Description: Stop looking at just Open and Close. Visualize the speed of price action, detect institutional footprints, and trade off dynamic "living" market structure that flips and burns automatically. Developed by @Ash_TheTrader.
The Hidden Dimension of Price Action
Most traders look at a standard candlestick and see four data points: Open, High, Low, and Close.
But this hides the most critical information: The struggle.
Did the buyers step in aggressively in the first 5 minutes, pushing price to highs instantly? (Institutional buying)
Or did it take 59 minutes of slow, grinding effort to reach that high? (Retail exhaustion/Trap)
Standard candles look identical in both scenarios. The Impulse Engine, developed by @Ash_TheTrader, solves this by visualizing the "Speed of Price" (Velocity) directly onto your chart, combined with a state-of-the-art, dynamic market structure system.
It’s not just an indicator; it’s a complete market X-ray.
1. The Velocity Painter: See the Speed ⚡
The core of this system is the Velocity Engine. It looks "inside" your current timeframe bar (using lower timeframe data) to calculate how fast price traveled to its extremes.
It paints the bars based on institutional urgency, allowing you to ignore the noise and focus on the momentum.
The Visual Code:
⚡ NEON CYAN (Bullish Impulse) : Aggressive buying. Price ripped from the open to the high very quickly. This is where the smart money is stepping on the gas.
⚡ NEON MAGENTA (Bearish Impulse): Aggressive selling. Price crashed from the open to the low immediately.
💤 FADED GREY (Exhaustion/Trap): The "grind." Price took a long time to reach its extremes. These are often low-momentum environments or potential traps waiting to reverse.
STANDARD GREEN/RED: Normal market flow with no significant velocity extremes.
"Trade the Neon, Ignore the Grey." — @Ash_TheTrader
2. Smart Structure: "Living" Levels 🏗️
Old-school pivot indicators clutter your chart with endless historical lines that are no longer relevant. The Impulse Engine uses a "Living Structure" algorithm that manages the lifecycle of every support and resistance level.
It only shows you the two most relevant Resistance levels (R1, R2) above price, and the two most relevant Support levels (S1, S2) below price.
Risk-Based Classification:
You choose the structure based on your trading style in the settings:
Scalp Mode: Detects short-term, 5-bar swings. (Thin dotted lines).
Trend Mode: Detects standard trend swings (21-bar). (Dashed lines).
Major Swing: Detects deep, major structural points (60-bar). (Thick solid lines).
The "Flip & Burn" Mechanic (Viral Feature) 🔥
This is where the system gets smart. It understands market mechanics:
The Flip (Role Reversal): If a Resistance level is broken by a candle close, it automatically turns Gold and becomes Support (Flip). The same applies to Support turning into Resistance. You no longer need to guess if an old level will hold from the other side.
The Burn (Auto-Cleaning): If a "Flipped" level is broken again, the system recognizes it has lost its structural integrity. The line is instantly "burned" (removed from the chart).
This ensures your chart only ever shows levels that are active and respected.
3. Whale Signs: The Footprint of Big Money 🐋
Sometimes, velocity isn't enough. You need to see raw power.
The Whale Sign feature detects massive expansions in volatility. It flags any candle whose range is significantly larger (default 2x) than the average of the previous two candles.
💚 Green Triangle + $ (Below Bar): A massive bullish expansion candle. A "Wake Up" call for longs.
❤️ Red Triangle + $ (Above Bar): A massive bearish expansion candle. A warning sign for shorts.
These often precede sustained velocity moves.
4. The Pro HUD (Heads-Up Display) 💻
In the bottom right corner, the dynamic HUD gives you a real-time health check of the current candle.
Status Header: Instantly tells you if the current candle is IMPULSE, EXHAUSTION, or NORMAL.
Live Velocity %: The exact speed score. The text color changes to Neon during impulses and fades to grey during exhaustion.
Mode Info: Reminds you which risk setting you are currently using (e.g., Mode: ).
Signature: The official @Ash_TheTrader stamp of quality.
How to Trade With The Impulse Engine
This system is designed for confluence. Never trade a signal in isolation.
📈 Strategy 1 : The "Velocity Bounce" (Trend Continuation)
Ensure the market is trending (e.g., making higher highs).
Wait for price to pull back to a Smart Support level (Cyan dashed line or Gold "Flip" line).
Trigger: Look for a Neon Cyan Impulse Candle to form right off that support level. This confirms institutions are defending the structure with speed.
📉 Strategy 2: The "Whale Breakout"
Identify a consolidation zone below a Smart Resistance level.
Trigger: A Whale Sign ($) appears on a candle that successfully closes above the Resistance level.
Confirmation: The very next candle should ideally be a Neon Impulse candle continuing the move.
Conclusion
The markets are moved by aggression and speed. By obscuring this data, standard charts put you at a disadvantage.
The Impulse Engine brings this hidden data to the forefront, combining institutional velocity detection with smart, automated market structure that reacts to price just like a professional trader would.
Trade faster, trade smarter.
Developed by @Ash_TheTrader.
(Disclaimer: This tool is for informational purposes only and does not constitute financial advice. Always manage your risk.)
Scalper

IVX: Institutional Velocity X-Ray [Ash_TheTrader]The Intrabar Liquidity X-Ray: Seeing Institutional Speed Inside the Candle ⚡🐢
Stop getting trapped by standard candlesticks. It’s time to see how fast the money is actually moving.
A standard candlestick tells you four things: Open, High, Low, and Close. It’s the foundation of technical analysis.
But it hides the most important metric of all: Speed.
Two bullish 1-Hour candles can look identical on your chart. Both opened at $100 and closed at $105.
Candle A hit $105 in the first 5 minutes, then spent 55 minutes holding that level.
Candle B ground slowly upwards, finally hitting $105 in the 59th minute.
To a standard indicator, these candles are the same. To a professional trader, they are opposites. One shows aggressive, front-loaded institutional buying; the other shows weak, exhausted retail grinding.
As @Ash_TheTrader, I developed the Intrabar Liquidity X-Ray to solve this problem. It stops looking at the surface of the candle and looks inside it.
🧠 The Concept: Time-To-Form
This indicator uses advanced Pine Script technology to conduct an "X-Ray" scan of the bar you are looking at.
If you are on a 1-Hour chart, the script uses request.security_lower_tf to fetch the data of the 60 individual 1-minute bars hidden inside that single hour bar.
It then asks a critical question: How long did it take for this candle to achieve its ultimate High or Low?
In a Bullish candle, we measure the time it took to hit the specific minute of the bar's High.
In a Bearish candle, we measure the time it took to hit the specific minute of the bar's Low.
By measuring this "Time-To-Form," we can classify the intent behind the move.
⚡ The "Fast" Candle (Institutional Aggression)
When smart money wants to move an asset, they don't wait all day. They execute large block orders that move price rapidly to their desired level, and then they defend it.
The Signal: The indicator identifies a bar as "Fast" if it hits its High (for bulls) or Low (for bears) in the first 20% of the candle's duration.
The Visual: The bar turns Neon Cyan and is marked with a lightning bolt ⚡.
Interpretation by @Ash_TheTrader: This is urgent liquidity. Institutions are front-loading their orders. These levels are often strong zones of support or resistance on retests because the big players showed their hand early.
🐢 The "Slow" Candle (Retail Grind)
Conversely, when a move is driven by retail traders chasing price, or when a trend is exhausted, price struggles to make new extremes. It grinds slowly, taking the entire duration of the candle just to inch slightly higher or lower.
The Signal: The indicator identifies a bar as "Slow" if it takes more than 80% of the candle's duration to finally reach its High or Low.
The Visual: The bar turns Orange and is marked with a turtle 🐢 beneath it.
Interpretation by @Ash_TheTrader: This is "weak" movement. Even if the candle is green, if it took 58 minutes of a 60-minute bar just to make a new high, the buyers are exhausted. Be wary of reversals after seeing a cluster of 🐢 candles.
💻 Features and The Dashboard
To make this data actionable in real-time, I have engineered a clean Heads-Up Display (HUD) directly on the chart.
The On-Chart Dashboard: Located in the top right, the dashboard gives you the live stats of the current forming bar. It tells you exactly what percentage of the time has passed and whether the current structure is considered Institutional ⚡ or a Retail Grind 🐢.
Other Features:
Dual Polarity Logic: Works seamlessly for both bullish trends (tracking speed to Highs) and bearish trends (tracking speed to Lows).
Smart Volume Filtering: The indicator automatically ignores insignificant low-volume "noise" bars, only highlighting speed on candles with above-average volume.
Full Alert Capability: Set alerts for "Fast ⚡" detections to catch sudden institutional activity as it happens.
⚙️ Best Practices for Using This Tool
Because this tool looks inside a bar, it is designed to be used on Higher Timeframes.
Recommended Timeframes: 30-Minute, 1-Hour, 4-Hour, or Daily charts.
Do Not Use On: 1-Minute or 5-Minute charts. (You cannot effectively "X-Ray" a 1-minute bar using 1-minute data; the math doesn't work).
A Final Note from @Ash_TheTrader
Trading is about information asymmetry. The market hides the most valuable data beneath the surface of the Open and Close. Use the Intrabar Liquidity X-Ray to stop guessing the speed of the market and start seeing it.
Trade safe, trade smart.⚡

The Physics Engine [@Ash_TheTrader]🏛️ Welcome to the Physics of Finance
By @Ash_TheTrader
Traditional technical analysis often relies on "lagging" indicators. Tools like the RSI or moving averages tell you where price has been. While useful, they are like driving a car looking only in the rearview mirror.
The Kinematic Impulse Engine (KIE) is different. It is designed to be a leading indicator of momentum shifts.
It doesn't just look at price; it treats price action like a physical object moving through space to measure its Velocity (Speed), Acceleration (G-Force), and Mass (Volume). By understanding the physics behind a move, we can determine if a trend is a powerful impulse or an exhausted drift waiting to reverse.
⚛️ The Core Concept: Trading with G-Force
If you step on the gas pedal in a car, you feel pushed back into your seat. That is acceleration (positive G-Force). When you slam on the brakes, you are thrown forward. That is deceleration (negative G-Force).
The market works the same way.
Standard momentum indicators only measure speed. The KIE measures how fast that speed is changing.
The Problem with Standard Indicators: Price can be moving higher (high speed), but the rate at which it is moving higher is slowing down (deceleration). A standard indicator will still look bullish right up until the reversal happens.
The KIE Solution: The KIE detects that deceleration instantly, warning you that the "G-Force" pushing the price up has vanished, often before the price peaks.
🎨 Visual Decoder: Reading the Heatmap
We have eliminated the need to stare at complex oscillator lines below your chart. The KIE paints the candles directly based on their "Kinetic Energy."
1. Neon Cyan : The Impulse (High G-Force) 🚀
Physics State: High Velocity + Positive Acceleration.
Meaning: The market has "pedal to the metal." Buyers are aggressive, and the move is speeding up. This is where you want to be in a trade.
Signal: Look for the small triangles (🚀) marking the start of these impulse moves out of the noise.
2. Deep Purple : Exhaustion (Braking) 🛑
Physics State: High Velocity + Negative Acceleration (Deceleration).
Meaning: The car is still moving forward fast, but the driver has taken their foot off the gas or hit the brakes.
Signal: This is a massive warning sign. If you are long and candles turn purple, the trend is running on fumes. Expect consolidation or a reversal soon.
3. Dark Gray : Equilibrium (Chop) 💤
Physics State: Low Velocity.
Meaning: No significant energy present. The market is chopping sideways.
Signal: Stay out of the market or use range-bound strategies.
⚠️ Unique Feature: Gravity Divergence Detection
This is the most powerful feature of the Kinematic Impulse Engine. It detects when price action is defying the laws of physics.
Imagine throwing a ball into the air. As it reaches the very peak of its arc, it is still moving upward, but gravity is decelerating it rapidly just before it falls back down.
The KIE detects this exact moment in the market:
Gravity Sell Signal: Price makes a new high, but Acceleration (G-Force) crashes rapidly. The market is fighting gravity and will likely snap back.
If you see a "GRAVITY" label pop up on a Deep Purple candle at a high, take notice.
🧠 The Engine Room (Under the Hood)
For the technical traders, here is how @Ash_TheTrader designed the engine:
Relative Velocity: Price changes are normalized against Average True Range (ATR) volatility. A $10 move in Bitcoin is not the same as a $10 move in a penny stock; the KIE adjusts for this automatically.
Mass Integration (Volume Weighting): In physics, Force = Mass x Acceleration. The KIE optionally uses relative Volume as "Mass." A move backed by high volume has more "weight" and is harder to stop than a low-volume move.
The HUD: The on-screen dashboard gives you real-time readings of the current Velocity and raw G-Force metrics, along with an instant trend status summary.
🛡️ How to Use This in Your Trading
The Breakout Trader: Wait for gray candles (chop). Enter when the first Neon Cyan candle appears, ideally accompanied by an Impulse Triangle (🚀). Ride the cyan until it turns purple.
The Reversal Trader: Wait for an extended run of cyan candles. When the candles turn Deep Purple and you see a "GRAVITY" warning label, look for shorting opportunities as the momentum is exhausted.
Trade smart. Trade with physics.
Developed by @Ash_TheTrader

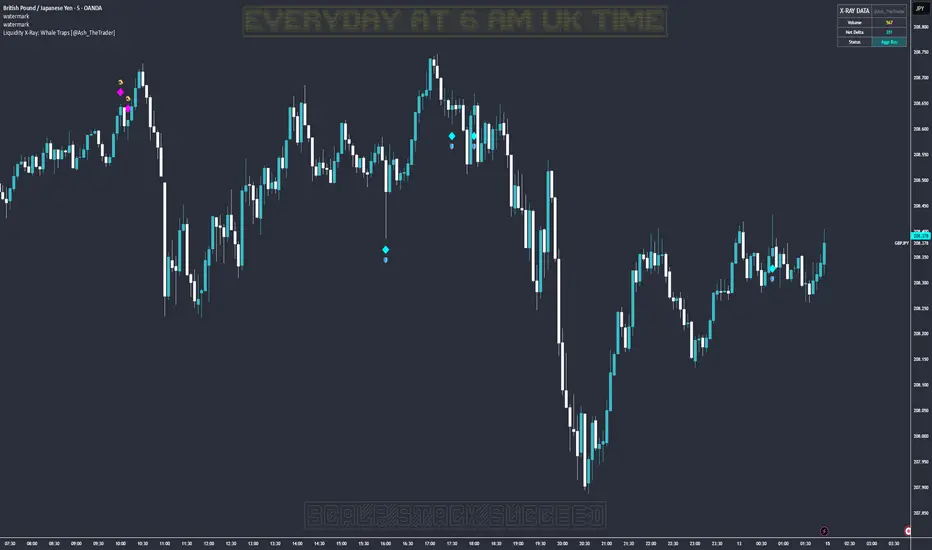
Liquidity X-Ray: Whale Traps [@Ash_TheTrader]👁️ Liquidity X-Ray: The Institutional Edge
Stop Trading Blind. See Inside the Candle.
Ninety percent of retail traders only see the outer shell of a candlestick—the Open, High, Low, and Close. They are trading blind to the actual battle that took place during that candle's formation.
Institutions, however, use expensive Order Flow software to see where aggressive buying or selling is happening in real-time.
The Liquidity X-Ray Strategy, developed by @Ash_TheTrader, levels the playing field. It uses advanced Intrabar Analysis to simulate institutional order flow footprints directly on your TradingView chart, automating powerful reversal signals based on "Absorption."
🧠 The Concept: Intrabar Analysis & Delta
How does it work?
Imagine a single 1-Hour candle. Inside that candle, there are sixty 1-Minute candles hidden from view.
This strategy performs an "X-Ray" scan. It tunnels into the lower timeframes (e.g., 5-minute data inside a 1-hour bar) to calculate the Net Delta—the difference between aggressive buying volume and aggressive selling volume.
Cyan Candles: Indicate that aggressive buyers (hitting the Ask) won the internal battle.
Magenta Candles: Indicate that aggressive sellers (hitting the Bid) won the internal battle.
But knowing who won isn't enough. The real edge comes from identifying Absorption.
🎯 The Signals: Detecting Traps & Shields
The core philosophy of this strategy by @Ash_TheTrader is simple: Identify where high effort yields low results.
When massive volume comes in, but price refuses to move, it means one side is being "absorbed" by a larger player. This is often the precursor to a violent reversal.
1. The Bear Trap (🪤)
What you see: A candle with massive volume and aggressive internal buying (positive Delta), yet the candle body remains small and fails to push price significantly higher.
The Psychology: Retail traders are FOMO-buying aggressively at a high. Institutional "Whales" are sitting on the other side, passively selling into this demand, absorbing all the buy orders without letting price rise.
The Result: Once the buyers are exhausted, the trap snaps shut, and price reverses downward.
Strategy Action: Enters a SHORT position.
2. The Bull Shield (🛡️)
What you see: A candle with massive volume and aggressive internal selling (negative Delta), yet the candle body remains small and fails to push price lower.
The Psychology: A "Stop Run" is occurring. Retail traders are panic-selling. Smart money is stepping in like a shield, absorbing all the sell pressure at a fixed level.
The Result: Once the sellers are exhausted, there is no one left to sell, and price rallies upward.
Strategy Action: Enters a LONG position.
⚡ Strategy Features & The Viral Dashboard
This isn't just an indicator; it's a complete, automated trading system.
Automated Execution: The script takes the trades for you when a Shield or Trap is confirmed upon candle close.
Smart Risk Management: It automatically places Stop Losses beyond the wick of the signal candle and targets a default 2:1 Risk/Reward ratio.
The Live Performance Panel: Look at the top right of your chart. The strategy features a built-in, professional-grade dashboard that displays real-time statistics. You can instantly see the strategy's Win Rate and Net Profit over the current historical data.
"Numbers don't lie. Don't just guess if a setup works; watch the win rate adjust in real-time." — @Ash_TheTrader
🛠️ How to Use This Strategy
For the best results, follow these institutional guidelines:
Timeframe: This strategy is most effective on Higher Timeframes where institutional volume is dominant. We recommend the 1-Hour (1H) or 4-Hour (4H) charts.
Intrabar Resolution (Settings): In the strategy settings, ensure the "Intrabar Resolution" is set lower than your chart timeframe. The default is 5 minutes, which is ideal for scanning inside 1H or 4H candles.
Confluence: While the strategy can be traded standalone, the best signals often occur near major support/resistance zones or key Fibonacci levels.
⚠️ Disclaimer
This strategy uses request.security_lower_tf to perform its calculations. While highly accurate, past performance on the dashboard does not guarantee future results. Always manage your risk responsibly.
Trade smart. See the liquidity.
~ @Ash_TheTrader
NEURAL FLOW | The AI-Powered Regime Classifier [by @Ash_TheTrade📉 Stop Trading Blindly. Filter the Noise with AI.
Why do your favorite strategies work perfectly one week and bleed your account the next?
The answer is simple: Context.
A Moving Average crossover works in a trend but gets slaughtered in chop. RSI works in a range but fails in a strong breakout. Most indicators are "dumb"—they apply the same math regardless of the market's current reality.
I created Neural Flow to fix this.
Developed by @Ash_TheTrader, this isn't just another buy/sell arrow indicator. It is a sophisticated market Regime Classifier built on concepts derived from machine learning (Lorentzian Distance algorithms).
It doesn't just tell you where price is; it tells you what the market is doing.
🧠 The Concept: How It Works
The core idea behind this script is simple yet powerful: Don't trade unless the environment is right.
The Neural Flow algorithm acts like a veteran trader watching over your shoulder. It analyzes multiple "neurons" (data points representing momentum, volatility, and cyclicality) and compares the current price action to historical data.
By identifying what "state" the market is currently in, it paints your chart in real-time, acting as the ultimate filter for any strategy you use.
👁️ The 4 Market Regimes
The indicator instantly classifies the market into one of four distinct states, visualizing them with a full-chart background glow and candle painting:
1. 🐂 Bull Trend (Neon Green)
The market has clear upward momentum, healthy RSI, and strong trend orientation.
Action: Look for Long entries. Buy dips.
2. 🐻 Bear Trend (Neon Red)
The market has clear downward momentum and weak underlying metrics.
Action: Look for Short entries. Sell rallies.
3. 🚫 CHOP (Grey/Monochrome)
This is the most important feature. The AI has detected low volatility squeeze conditions or directionless ADX. This is where 80% of traders lose money due to fake-outs and whipsaws.
Action: DO NOT TRADE. Sit on your hands and preserve capital.
4. ⚡ Breakout Detected (Gold/Yellow)
The algorithm has detected a sudden, violent expansion in volatility (Bollinger Width explosion) following a period of chop. The direction is not yet confirmed, but a big move is imminent.
Action: Get ready. Watch for a transition into a Bull or Bear regime.
💻 The Glassmorphism Dashboard & AI Confidence
In the corner of your chart, you will find a futuristic, transparent "Glass UI" dashboard designed by @Ash_TheTrader.
It provides instant situational awareness without cluttering your view.
The AI Confidence Score:
This is your conviction meter. It calculates how aligned the various "neurons" of the algorithm are (ranging from 0% to 100%).
A Bull Trend with 40% Confidence might be weak and prone to reversal.
A Bull Trend with 85%+ Confidence indicates strong confluence across multiple data points.
Pro Tip from @Ash_TheTrader: Only take trades when the AI Confidence is above 75%.
🚀 How to Use This in Your Trading
This tool is designed to be versatile.
As a Strategy Filter (Recommended): Use your existing favorite strategy (e.g., MACD, SMC, Price Action). Before taking a trade, glance at the Neural Flow background.
Your strategy says Buy, but the background is Grey (Chop)? Skip the trade.
Your strategy says Sell, and the background is Red (Bear)? Take the trade with confidence.
As a Standalone System: Wait for the market to transition out of "Grey Chop" into a "Green Bull" or "Red Bear" regime. Confirm that the "AI Confidence" on the dashboard is high (>70%), and enter in the direction of the new trend.
⚙️ Settings & Customization
While the default settings are tuned for most markets, @Ash_TheTrader believes in flexibility:
Training Window: Adjust the sensitivity of the regime detection.
Visuals: Customize all colors to match your chart aesthetic.
Glass Dashboard: Move it, resize it, or turn it off completely.
Baseline EMA: Toggle the 50-period baseline reference line on or off to keep your charts ultra-clean.
A Note from the Author:
"Trading isn't about catching every move; it's about catching the right moves and staying safe during the noise. I built this tool to help me instantly recognize when to step on the gas and when to hit the brakes. I hope it brings clarity to your charts."
— @Ash_TheTrader
Disclaimer: This tool is for informational purposes only and does not constitute financial advice. Always manage your risk.

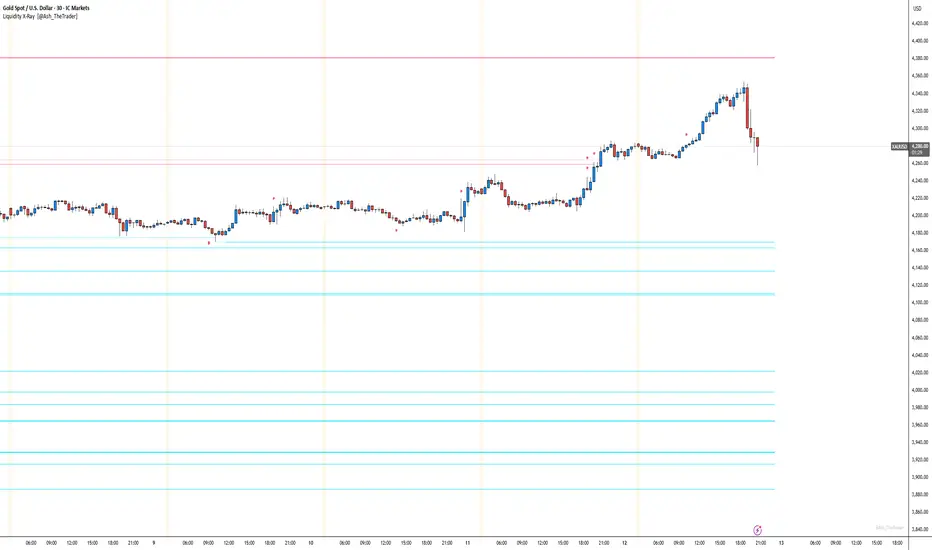
See Where The Banks Are Hunting: Liquidity X-Ray[@Ash_TheTrader]# 🛑 Stop Being "Liquidity." Start Seeing the Trap.
### Introducing: **Liquidity X-Ray **
How many times have you placed your stop-loss just below a perfect support level, only to watch a single candle wick down, trigger your stop, and immediately reverse toward your original target?
You weren't unlucky. You were targeted.
Welcome to the world of Smart Money Concepts (SMC). In the institutional game, your stop loss isn't protection—it's fuel. The market makers need liquidity to fill huge orders, and they find it clustered at obvious swing highs and lows.
I developed the **Liquidity X-Ray** to stop guessing where these traps are laid. This isn't just another support and resistance tool; it’s a dynamic, living heatmap of market psychology.
---
### 🧠 The Philosophy: The "Time-Decay" Algorithm
Standard indicators draw static lines that clutter your chart. The **Liquidity X-Ray** is different. It understands that *time* is a crucial factor in building liquidity pressure.
I have engineered a unique **Time-Decay Intensity** feature into this script. It visualizes the density of resting orders based on how long a level has remained untouched.
#### The Visual Language:
* **👻 The Ghosts (New Zones):** When a new swing high or low forms, a faint, transparent zone appears. It’s watching.
* **💡 The Neon Traps (Mature Zones):** As time passes and price fails to revisit that level, the zone solidifies. It becomes brighter, more opaque, and intensely neon. **This is your signal.** A bright neon zone means a massive pile of retail stop-losses has accumulated there. The Banks *need* to visit it.
* **💥 The Sweep Explosion:** When price finally pushes into a mature zone, the script detects the "Liquidity Grab." The box flashes bright white, cuts off immediately, and prints a **💥 LIQ GRAB** label on your chart. The trap has been sprung.
---
### ⚙️ Key Features & Cyberpunk Aesthetics
This tool is designed to look incredible on dark charts while providing institutional-grade data.
* **Dynamic Buyside/Sellside Heatmaps:** Clear visual distinction between where shorts are trapped (Neon Red/Pink) and where longs are trapped (Neon Cyan).
* **Smart Memory Management:** The script intelligently manages old zones to ensure your chart *never* lags, regardless of the timeframe.
* **Volume Filtering (Optional):** You can choose to only plot zones formed on high-volume pivot points, ensuring you are only watching significant market structures.
* **Instant Alerts:** Set alerts for the "Sweep Explosion" so you never miss a major reversal setup.
---
### 🎯 How to Trade the X-Ray
**Do NOT trade the breakout of these zones.** These are traps.
1. **Identify the Target:** Look for the oldest, brightest, most solid neon zones on your timeframe (H1 and H4 are powerful).
2. **Wait for the Hunt:** Be patient. Let price aggressively move toward the zone.
3. **The Explosion:** Wait for the candle to wick into the zone and trigger the **💥 LIQ GRAB** visual.
4. **The Reversal Entry:** Once the liquidity is taken, look for lower timeframe confirmation (like a Change of Character or engulfing candle) in the *opposite* direction. You are now trading *with* the smart money recovery, not *against* their stop hunt.
---
### Author's Note
Trading is about information asymmetry. The institutions have seen your stops for decades. It’s time you started seeing where they are hunting.
Trade smart, stay safe.
— **@Ash_TheTrader**
AI Probabilistic OrderFlow Scalper⭐ Description:
📌 AI Probabilistic OrderFlow Scalper
This script combines Order Flow, Auction Market Theory, Volume Imbalance, Market Structure (HH/LL), RSI bias filtering, and a probability-based direction model inspired by AI and statistics.
It produces high-precision scalping entries designed for fast markets such as Futures, while remaining compatible with all markets (indices, crypto, forex, metals).
This is not a typical indicator — it is a probabilistic predictive model engineered to provide sniper entries, a tick-based Take Profit, a volatility-adaptive ATR Stop Loss, and optional Value Area levels (VAH/VAL/POC).
⭐ Main Features:
🔥 Directional probability model (AI-style weighted scoring)
📊 Order Flow imbalance (delta-like logic)
📈 HH/LL market structure detection
🎯 Smart RSI bias filter
🚀 One signal per trend shift (anti-spam)
🎯 Tick-based Take Profit (perfect for NQ / futures)
🛡️ ATR-based dynamic Stop Loss
📉 Value Area display: VAH, VAL, POC
🔊 Volume confirmation filter
📡 Directional probability plot
✔️ Works for Futures, Crypto, Forex, Indices
🧠 Probabilistic AI Approach
The model uses a 3-factor scoring system:
Order Flow imbalance
Market structure (HH/LL)
RSI trend bias
Each validated condition = 1 point.
The total score is converted into Buy/Sell probabilities, and the higher-probability direction is selected.
When probability exceeds the threshold (e.g. 80%), the system triggers a high-confidence sniper signal.
This mirrors Revenue Management logic:
→ Only take a decision when probability of success is maximized.
🎯 Buy/Sell Signals (Sniper Entries)
🔵 Green triangle under the candle = high-probability Buy
🔴 Red triangle above the candle = high-probability Sell
✔️ Only one signal per directional shift
✔️ Signals appear only when all strict filters are satisfied
📌 Automatic TP / SL
TP: fixed tick-based (e.g. 100 ticks for NQ scalping)
SL: ATR-based, adapts to volatility
TP/SL display can be enabled or disabled
Perfectly calibrated for high-speed scalping.
📘 How to Use
Use on every timeframe
Adjust probability threshold (75–90 recommended)
Enable strict mode for maximum precision
Let the model filter entries automatically
Choose a TP suitable for your market
Optionally display VAH/VAL/POC for Auction Theory context
Always test using backtesting before going live
🏆 Advantages
Extremely fast for scalping
High win-rate potential via probabilistic filtering
Clean signals (no noise or spam)
Combines the strongest trading frameworks:
Order Flow
Market Structure
Statistical modeling
Volume profiling
Automated risk management

AI Probabilistic OrderFlow Scalper⭐ Main Name
AI Probabilistic OrderFlow Scalper
⭐Description:
📌 AI Probabilistic OrderFlow Scalper — Predictive Auction Theory Model for Futures
This script combines Order Flow, Auction Market Theory, Volume Imbalance, Market Structure (HH/LL), RSI bias filtering, and a probability-based direction model inspired by AI and Revenue Management.
It produces high-precision scalping entries designed for fast markets such as Nasdaq Futures (NQ), while remaining compatible with all markets (indices, crypto, forex, metals).
This is not a typical indicator — it is a probabilistic predictive model engineered to provide sniper entries, a tick-based Take Profit, a volatility-adaptive ATR Stop Loss, and optional Value Area levels (VAH/VAL/POC).
⭐ Main Features
🔥 Directional probability model (AI-style weighted scoring)
📊 Order Flow imbalance (delta-like logic)
📈 HH/LL market structure detection
🎯 Smart RSI bias filter
🚀 One signal per trend shift (anti-spam)
🎯 Tick-based Take Profit (perfect for NQ / futures)
🛡️ ATR-based dynamic Stop Loss
📉 Value Area display: VAH, VAL, POC
🔊 Volume confirmation filter
📡 Directional probability plot
✔️ Works for Futures, Crypto, Forex, Indices
🧠 Probabilistic AI Approach
The model uses a 3-factor scoring system:
Order Flow imbalance
Market structure (HH/LL)
RSI trend bias
Each validated condition = 1 point.
The total score is converted into Buy/Sell probabilities, and the higher-probability direction is selected.
When probability exceeds the threshold (e.g. 80%), the system triggers a high-confidence sniper signal.
This mirrors Hight probability decision:
→ Only take a decision when probability of success is maximized.
🎯 Buy/Sell Signals (Sniper Entries)
🔵 Green triangle under the candle = high-probability Buy
🔴 Red triangle above the candle = high-probability Sell
✔️ Only one signal per directional shift
✔️ Signals appear only when all strict filters are satisfied
📌 Automatic TP / SL
TP: fixed tick-based (e.g. 100 ticks for NQ scalping)
SL: ATR-based, adapts to volatility
TP/SL display can be enabled or disabled
Perfectly calibrated for high-speed scalping.
📘 How to Use
Use any timeframe
Adjust probability threshold (75–90 recommended)
Enable strict mode for maximum precision
Let the model filter entries automatically
Choose a TP suitable for your market
Optionally display VAH/VAL/POC for Auction Theory context
Always test using backtesting before going live
🏆 Advantages
Extremely fast for scalping
High win-rate potential via probabilistic filtering
Clean signals (no noise or spam)
Combines the strongest trading frameworks:
Order Flow
Market Structure
Statistical modeling
Volume profiling
Automated risk management

9/15 EMA Scalper 9/15 EMA Scalper — by uzairbaloch
This script is a price-action based scalping system built around the 9 EMA and 15 EMA trend structure.
It identifies short-term reversal points where the market pulls back into the EMAs and confirms direction with a strong candle signal.
The strategy looks for:
• A clear EMA trend (9 above 15 for buys, 9 below 15 for sells)
• Pullback into EMA9/EMA15 with candle bodies touching the fast EMA
• Strong confirmation candle (engulfing / strong momentum / controlled wick)
• Optional slope filter to avoid flat, choppy sessions
• Automatic trade labels showing Entry, SL and TP (based on R:R)
The script is designed for scalping on gold, indices, and high-volatility FX pairs.
It resets trade logic immediately after SL or TP is hit, so it can catch the next valid signal without delay.
This tool is meant as an indicator — not a full strategy — and can be used to visually mark high-probability EMA pullback setups with precise levels.
Author: uzairbaloch

Gold 1&5 Min Trading Strategy [TradingFinder] XAU Scalper Signal🔵 Introduction
Scalping in financial markets is based on immediate price reactions and precise analysis of price action behavior. In this trading approach, the trader must identify signals that originate directly from market structure, momentum shifts, candlestick formations, and the position of price relative to key zones.
Supply and demand areas serve as the primary regions of order concentration and form the foundation of scalping analysis, since they provide the most accurate representation of balance or imbalance between buyers and sellers as well as the active flow of liquidity in the market.
In demand zones, price reactions usually begin with the formation of reversal or continuation candlestick patterns. These patterns include structures such as Pin Bar, Engulfing, Doji, Failure, Rejection, and other forms of false breakout behavior, each of which can indicate a potential short term change in direction.
Liquidity plays a central role in these reactions, because price entering a demand zone typically coincides with the absorption of sell side liquidity and the restoration of order flow. This process often leads to rapid movements that are suitable for scalping. Therefore, combining candlestick confirmation with the location of price inside a supply or demand zone is one of the most reliable methods of identifying low risk scalping signals.
Demand zones include several structural variations, each representing a different form of liquidity behavior. One of the most well known examples is the order block, which is the final bearish candle before a strong bullish movement and indicates the presence of unfilled buy side interest.
Another important structure is the Fair Value Gap, which appears when a price void forms across three consecutive candles due to a lack of liquidity during the moment of displacement. The market often returns to this area to restore balance. Imbalance structures also represent one sided pressure in order flow where the market reacts later to correct these inefficiencies.
Breaker structure is another key element in demand analysis. A breaker is formed when an order block is violated and price returns to the same level after collecting liquidity, then continues in the opposite direction. This pattern often appears near liquidity based highs or lows and reflects a shift in the strength of market participants.
Together, order blocks, Fair Value Gaps, imbalances, and breakers form the core of demand analysis in price action and are widely used in precise scalping strategies due to their strong connection with liquidity and the high predictability of price reactions within them.
Bullish Setup :
Bearish Setup :
🔵 How to Use
This strategy is built on price action analysis, market reactions inside supply and demand zones, and confirmation through candlestick patterns. The first step is to identify key areas such as order blocks, Fair Value Gaps, imbalances, or breakers.
After these zones are located, price behavior within them is examined using candlestick structure and momentum direction. Entries are taken only when price reaches a validated zone, a clear sign of liquidity absorption or injection appears, and a confirming candlestick forms inside the zone.
This approach allows the trader to capture fast and precise entries during moments when the market is actively reacting to decision points.
🟣 Long Setup
In the buy setup, a valid demand zone must first be identified. This can be a bullish order block, an unfilled bullish Fair Value Gap, an imbalance at the lower part of structure, or a bullish breaker. When price enters this zone and shows signs of absorbing sell side liquidity, candlestick behavior must be examined.
Formation of reversal signals such as a Pin Bar with a long lower wick, bullish Engulfing, Rejection Candle, or a false breakout of the low, indicates a favorable shift in order flow. After receiving candlestick confirmation, a buy entry is taken within the same zone and the stop level is placed below the liquidity boundary. Targets are typically based on filling gaps, reaching supply zones, or returning to structural means.
🟣 Short Setup
In the sell setup, a valid supply zone must be recognized. This may include a bearish order block, a bearish Fair Value Gap, an imbalance at the upper part of structure, or a bearish breaker. When price enters this zone and liquidity accumulates above nearby highs, the probability of a fast momentum shift increases.
Confirmation occurs when a bearish reversal pattern forms such as Engulfing, Pin Bar with a long upper wick, indecisive Doji followed by rejection, or a false breakout of the high. After confirmation, the sell entry is placed and the stop level is set above the liquidity zone. Targets are selected based on filling lower Fair Value Gaps, reaching demand zones, or returning to structural midpoints.
🔵 Settings
Last Candle in Signal Direction : When On, a signal is issued only if the last candle moves in the direction required by the signal.
Signal in Nearly Zone : When enabled, the signal becomes valid even if the candle is near the zone rather than strictly inside it. When disabled, only signals formed inside the zone are allowed.
Allow Both Side Signals : When On, signals from both sides of the structure can be issued even if a limiting level exists. When disabled, only signals that do not violate the limiting level are allowed.
🔵 Conclusion
Using price action, supply and demand zones, and candlestick confirmation alongside liquidity analysis creates an effective framework for identifying fast market reactions in scalping conditions. Focusing on structures such as order blocks, Fair Value Gaps, imbalances, and breakers allows the trader to recognize shifts in momentum and changes in order flow with greater precision.
In this approach, entries are taken only when price reaches a validated zone, liquidity behavior is observable, and the confirming candle forms at the correct location. This leads to organized, low risk scalping signals that are aligned with the real time behavior of the market.

Binary Options Gold Scalping [TradingFinder] 1 & 5 Min Strategy🔵 Introduction
In binary options trading, price movements are often driven by the market’s tendency to reach key liquidity zones. These areas include Liquidity, Fair Value Gaps (FVGs), and Order Blocks (OBs), zones where a large number of pending orders are concentrated.
When price reaches one of these zones, it typically enters a Liquidity Sweep phase to collect available liquidity. After this process, the market often reacts sharply, either reversing direction or continuing its move with renewed momentum. Understanding this cycle forms the foundation of most smart money-based binary options strategies.
In this analytical approach, a Liquidity Sweep is usually seen as a False Breakout, often recognized through a distinctive candle confirmation pattern. The pattern appears when price briefly breaks a level to trigger stops, then quickly returns within range. This formation is one of the most reliable reversal signals for short-term trades and plays a central role in many binary options strategies.
After a liquidity sweep, price often returns to Fair Value Gap (FVG) or Order Block (OB) areas to restore balance in the market. These are zones where institutional orders are typically placed, and reactions around them can create high-probability trade setups. In binary options trading, this quick reaction following a sweep and retrace into an FVG or OB provides one of the best entry opportunities for short-term trades.
By combining the concepts of Liquidity Sweep, Fair Value Gap, and Order Block, traders can build a precise binary options strategy based on smart money behavior, allowing them to identify market reversals with greater confidence and enter at the optimal moment.
Bullish Setup :
Bearish Setup :
🔵 How to Use
This indicator is built on the Smart Money Concept (SMC) framework and serves as a core tool for accurately detecting Liquidity Sweeps, Order Blocks, and Fair Value Gaps in binary options trading.
Its logic is simple yet powerful : when price reaches high-interest liquidity zones and shows reversal signs, the indicator issues an entry signal immediately after a Candle Confirmation is complete.
Signals only activate when both the market structure and the candle confirmation pattern align, ensuring high accuracy in spotting genuine reversals.
🟣 Long Position
A bullish signal appears when the market, after a downward move, reaches sell-side liquidity zones where liquidity has built up below previous lows. In such conditions, a bullish Order Block or Fair Value Gap often exists in the same region, acting as a potential reversal point.
When the indicator detects the presence of liquidity, an imbalance zone (FVG), and a valid candle confirmation simultaneously, it triggers a green Call signal.
In a binary options strategy, the best entry moment is immediately after the candle confirmation closes, as this is when the probability of reversal is highest and the market tends to react strongly within the next few candles.
In the example below, after the liquidity sweep and candle confirmation, price quickly rallied, resulting in a Binary Win setup.
🟣 Short Position
A bearish signal occurs when price, after an upward move, reaches an area of buy-side liquidity and collects liquidity above recent highs. At this stage, the market is typically overbought and ready to reverse. If a bearish Order Block or Fair Value Gap exists in the same area and a candle confirmation pattern forms, the indicator displays a red Put signal.
This setup is highly accurate because multiple structural confirmations occur simultaneously : liquidity has been absorbed, price is rebalancing, and the confirmation candle has closed.
In binary options trading, this is the ideal moment to enter a Put (Sell) position, as the price reaction to the downside is usually quick and decisive.
In the example chart, the indicator generated a bearish signal right after the candle confirmation and completion of the liquidity sweep, price then dropped within minutes, resulting in another Binary Win.
🔵 Settings
Time Frame : Select the desired timeframe for analysis. If left blank, the indicator uses the chart’s current timeframe.
Swing Period : Defines how many candles are used to detect structural pivots (swing highs and lows). A higher value increases accuracy but reduces the number of signals.
Candle Pattern : Enables candle-based confirmation logic. When turned on, the indicator issues signals only if a valid reversal pattern is detected. You can also choose the confirmation filter strength, tighter filters show fewer but more precise signals.
🔵 Conclusion
A deep understanding of Liquidity Sweeps, Order Blocks, and Fair Value Gaps can make a decisive difference between ordinary and professional traders in the binary options market.
This indicator, combining smart money logic with candle confirmation, is one of the most precise tools for detecting true market reversals. When liquidity is collected and structural reversal signs emerge, the indicator automatically recognizes the price reaction and generates a reliable Call or Put signal.
Using this tool alongside market structure analysis and FVG detection allows traders to enter high-probability setups while filtering out false breakouts. For that reason, this binary options strategy is not only suitable for short-term trading but also valuable for understanding deeper smart-money behavior across timeframes.
Ultimately, success with this system comes down to two key principles: understanding the logic of the liquidity sweep and waiting for the candle confirmation to close. When these two conditions align, the indicator can pinpoint the best entry points with remarkable precision, helping you build a structured, intelligent, and profitable binary options strategy.

Binary Options Fast Scalping [TradingFinder] M1 & M5 Signals🔵 Introduction
In the structure of financial markets, spiky moments and sudden price movements play a key role in Liquidity Grabs and Market Structure Resets. These movements usually occur after the accumulation of orders in Buy Side or Sell Side Liquidity zones and are accompanied by rapid breaks in the form of Break of Structure (BoS) or Change of Character (CHoCH).
At this stage, the market temporarily moves in the direction of liquidity to trigger counter orders and then enters a Retracement or Pullback phase, a point where professional traders using the Smart Money Concept (SMC) look for candle confirmation to enter with precision.
This strategy is built upon the same logic : an initial spiky move as a signal of institutional or liquidity driven algorithms, followed by a controlled pullback toward areas such as the Order Block, Fair Value Gap (FVG), or Imbalance Zone, and finally an entry based on a strong confirmation candle (Engulf, Rejection, Breaker) that defines the true direction of order flow.
This combination of price behavior, especially on lower timeframes such as M1 or M5, provides an ideal setup for fast Scalping, Micro Structure Trading, and even short term directional prediction in Binary Options Trading.
Since the main focus of this method is on identifying liquidity phases, structural confirmations, and momentum confirmation candles, the trader can design entries with high probability and logical stop loss placement using the concepts of Fractal Market Structure and Multi Timeframe Confirmation.
In the scalping version, the main objective is to capture the move toward the next liquidity pool or opposite demand and supply zone, while in the binary version, only the prediction of the next candle’s direction matters. This strategy inherently operates based on Smart Money Behavior, Liquidity Engineering, and Order Flow Dynamics, allowing the extraction of fast and profitable moves from the internal logic of market structure.
🔵 How to Use
The operational logic of this strategy is based on Liquidity Sweep, Pullback, and Confirmation Candle. The trader should first identify the initial Impulse Move, which is often accompanied by liquidity absorption around Buy Side or Sell Side Liquidity areas. After that, the market enters the Retracement phase and returns to structural zones such as the Order Block or the Fair Value Gap (FVG).
At this point, a position is taken only when a confirmation candle (Engulf, Breaker, or Rejection Candle) closes in the direction of continuation and aligns with the new structure (BOS or CHoCH). Applying this model on lower timeframes offers the highest precision for fast Scalping or for predicting the next candle’s direction in Binary Option trading.
🟣 Bullish Setup
In the bullish setup, the market first forms a spiky upward move with a sudden increase in momentum, indicating the activation of liquidity flow in the Buy Side Liquidity zone. This movement is usually accompanied by a Break of Structure (BOS) to the upside and marks the beginning of the Impulse Move phase. After this move, the price enters the Pullback phase and returns to structural areas such as the Bullish Order Block, Fair Value Gap (FVG), or Mitigation zone.
At this stage, the trader waits for a bullish confirmation candle (Bullish Engulf or Breaker Candle) to validate the end of the retracement. Entry is made at the close of the confirmation candle or on a minor pullback, with the stop loss placed below the Swing Low or below the pullback zone. The target is set at the next Buy Side Liquidity or Equal Highs. In the binary version, only the direction of the next candle matters and the entry takes place immediately after the confirmation candle.
🟣 Bearish Setup
In the bearish setup, the market first forms a spiky downward move, signaling increased selling pressure and liquidity absorption at the Sell Side Liquidity zone. This movement is accompanied by a Break of Structure (BOS) to the downside and represents the beginning of a bearish momentum phase. After the spike, the price enters the Retracement phase and returns to the Bearish Order Block or bearish Fair Value Gap zone. Within these areas, the formation of a bearish confirmation candle (Bearish Engulf, Breaker, or Rejection Candle) validates the continuation of the downtrend.
The entry is taken at the close of the confirmation candle, with the stop loss placed above the Swing High or above the pullback zone, and the target set toward the next Sell Side Liquidity or Equal Lows. In binary applications, only the direction of the next candle is considered and the confirmation candle serves as the entry trigger.
🔵 Conclusion
This strategy, by combining the principles of the Smart Money Concept, Liquidity Dynamics, and Candle Confirmation Logic, offers a precise and multi functional approach to market entry. Its core structure, identifying the initial spiky movement, waiting for a structural pullback, and entering based on a confirmation candle allows quick interpretation of institutional liquidity behavior and provides trading opportunities with high accuracy and controlled risk.
On lower timeframes, this logic becomes a powerful tool for Scalping and Micro Structure Trading, while in binary markets it delivers high success rates due to its focus on predicting the next candle’s direction. Built upon the foundations of Order Flow, Market Structure, and Fractal Liquidity Behavior, this strategy demonstrates that even in the fastest and noisiest market conditions, the order of Smart Money remains observable and exploitable.

PulseGrid Universal Scalper - Adaptive Pulse and Symmetric SpansInstrument agnostic. Works on any symbol and timeframe supported by TradingView.
Message or hit me up in chat for full access .
Purpose and scope
PulseGrid is a short timeframe strategy designed to read intrabar structure and recent path so that entries align with actionable momentum and context. The strategy is private. The description below provides all the information needed to understand how it behaves, how it sizes risk, how to tune it responsibly, and how to evaluate results without making unrealistic claims. The design is instrument agnostic. It runs on any asset class that prints open high low close bars on TradingView. That includes commodities such as Gold and WTI, currencies, crypto, equity indices, and single stocks. Performance will always depend on the symbol’s liquidity, spread, slippage, and session structure, which is why the description focuses on principles and safe parameter ranges instead of hard promises.
What the strategy does at a glance
It builds a composite entry signal named Pulse from five normalized bar features that reflect short term pressure and follow through.
It applies regime guards that keep the strategy inactive when the tape is either too quiet, too bursty, or too directionally random.
It optionally uses a directional filter where a fast and a slow exponential average must agree and their gap must be material relative to recent true range.
When a signal is allowed, risk is sized using symmetric spans that come from nearby untraded price distances above and below the market. The strategy sets a single stop and a single take profit from those spans.
Lines for entry, stop, and take profit are drawn on the chart. A compact on chart table shows trade counts, win rate, average R per trade, and profit factor for all trades, longs only, and shorts only.
This combination yields entries that are reactive but not chaotic, and risk lines that respect the market’s recent path instead of generic pip or point targets.
Why the design is original and useful
The core originality is the union of a composite entry that adapts to volatility and a geometry based risk model. The entry uses five different viewpoints on the same bar space instead of relying on a single technical indicator. The risk model uses spans that come from actual untraded distance rather than fixed multipliers of a generic volatility measure. The result is a framework that is simple to read on a chart and simple to evaluate, yet it avoids the traps of curve fitting to one symbol or one month of data. Because everything is normalized locally, the same logic translates across asset classes with only modest tuning.
The Pulse composite in detail
Pulse is a weighted blend of the following normalized features.
Impulse imbalance. The script sums upward and downward impulses over a short window. An upward impulse is the extension of highs relative to the prior bar. A downward impulse is the extension of lows relative to the prior bar. The net imbalance, scaled by the local range, captures whether extension pressure is building or fading.
Wick and close location. Inside each bar, the distance between the close and the extremes carries information about rejection or acceptance. A bar that closes near the high with relatively heavier lower wick suggests upward acceptance. A bar that closes near the low with heavier upper wick suggests downward acceptance. A weight controls the contribution of wick skew versus close location so that users can favor reversal or momentum behaviour.
Shock touches. Within the recent range window, touches that occur very near the top decile or bottom decile are marked. A short sliding window counts recent shocks. Frequent top shocks in a rising context suggest supply tests. Frequent bottom shocks in a declining context suggest demand tests. The count is normalized by window length.
Breakout ledger. The script compares current extremes to lagged extremes and keeps a simple count of recent upside and downside breakouts. The difference behaves as a short term polarity meter.
Curvature. A simple second difference in closing price acts as a curvature term. It is normalized by the recent maximum of absolute one bar returns so that the value remains bounded and comparable to other terms.
Pulse is smoothed over a fraction of the main signal length. Smoothing removes impulse spikes without destroying the quick reaction that scalpers need. The absolute value of smoothed Pulse can be used with an adaptive gate so that only the top percentile of energy for the recent environment is eligible for entries. A small floor prevents accidental entries during very quiet periods.
Regime guards that keep the strategy selective
Three guards must all pass before any entry can occur.
Auction Balance Factor. This is the proportion of closes that land inside a mid band of the prior bar’s high to low range. High values indicate balanced chop where breakouts tend to fail. Low values indicate directional conditions. The strategy requires ABF to sit below a user chosen maximum.
Dispersion via a Gini style measure on absolute returns. Very low dispersion means bars are small and uniform. Very high dispersion means a few outsized bars dominate and slippage risk can be elevated. The strategy allows the user to require the dispersion measure to remain inside a band that reflects healthy activity.
Binary entropy of direction. Over the core window, the proportion of up closes is used to compute a simple entropy. Values near one indicate coin flip behaviour. Values near zero indicate one sided sequences. The guard requires entropy below a ceiling so that random directionality does not produce noise entries.
An optional directional filter asks that a fast and a slow exponential average agree on direction and that their gap, when divided by an average true range, exceed a threshold. This filter can be enabled on symbols that trend cleanly and disabled when the composite entry is already selective enough.
Risk sizing with symmetric spans
Instead of fixed points or a pure ATR multiplier, the strategy sizes stops and targets from a pair of spans. The upward span reflects recent untraded distance above the market. The downward span reflects recent untraded distance below the market. Each span is floored by a fallback that comes from the maximum of a short simple range average and a standard average true range. A tick based floor prevents microscopic stops on instruments with high tick precision. An asymmetry cap prevents one span from becoming many times larger than the other. For long entries the stop is a multiple of the downward span and the target is a multiple of the upward span. For short entries the stop is a multiple of the upward span and the target is a multiple of the downward span. This creates a risk box that is symmetric by construction yet adaptive to recent voids and gaps.
Execution, ties, and housekeeping
Entries evaluate at bar close. Exits are tested from the next bar forward. If both stop and target are hit within the same bar, the outcome can be resolved in a consistent way that favors the stop or the target according to a single user setting. A short cooldown in bars prevents flip flops. Users can restrict entries to specific sessions such as London and New York. The chart renders entry, stop, and target lines for each trade so that every action is visible. The table in the top right shows trade counts, take profit and stop counts, win rate, average R per trade, and profit factor for the whole set and by direction.
Defaults and responsible backtesting
The default properties in the script use a realistic initial capital and commission value. Users should also set slippage in the strategy properties to reflect their broker and symbol. Small timeframe trading is sensitive to friction and the strategy description does not claim immunity to that reality. The strategy is intended to be tested on a dataset that produces a meaningful sample of trades. A sample in the range of a hundred trades or more is preferred because variance in short samples can be large. On thin symbols or periods with little regular trading, users should either change timeframe, change sessions, or use more selective thresholds so that the sample contains only liquid scenarios.
Universal usage across markets
The strategy is universal by design. It will run and produce lines on any open high low close series on TradingView. The composite entry is made of normalized parts. The regime guards use proportions and bounded measures. The spans use untraded distance and range floors measured in the local price scale. This allows the same logic to function on a currency pair, a commodity, an index future, a stock, or a crypto pair. What changes is calibration.
A safe approach for universal use is as follows.
Start with the default signal length and wick weight.
If the chart prints many weak signals, enable the directional filter and raise the normalized gap threshold slightly.
If the chart is too quiet, lower the adaptive percentile or, with adaptive off, lower the fixed pulse threshold by a small amount.
If stops are too tight in quiet regimes, raise the fallback span multiplier or raise the minimum tick floor in ticks.
If you observe long one sided days, lower the maximum entropy slightly so that entries only occur when directionality is genuine rather than alternating.
Because the logic is bounded and local, these simple steps carry over across symbols. That is why the strategy can be used literally on any asset that you can load on a TradingView chart. The code does not depend on a specific tick size or a specific exchange calendar. It will still remain true that symbols with higher spread or fewer regular trading hours demand stricter thresholds and larger floors.
Suggested parameter ranges for common cases
These ranges are guidelines for one to five minute bars. They are not promises of performance. They reflect the balance between having enough signals to learn from and keeping noise controlled.
Signal length between 18 and 34 for liquid commodities and large capitalization equities.
Wick weight between 0.30 and 0.50 depending on whether you want reversal recognition or close momentum.
Adaptive gate percentile between 85 and 93 when adaptive is enabled. Fixed threshold between 0.10 and 0.18 when adaptive is disabled. Use a non zero floor so very quiet periods still require some energy.
Auction Balance Factor maximum near 0.70 for symbols with clear session bursts. Slightly higher if you prefer to include more balanced prints.
Dispersion band with a lower bound near 0.18 and an upper bound near 0.68 for most session instruments. Tighten the band if you want to skip very bursty days or very flat days.
Entropy maximum near 0.90 so coin flip phases are filtered. Lower the ceiling slightly if the symbol whipsaws frequently.
Stop multiplier near one and take profit multiplier between two and three for a single target approach. Larger target multipliers reduce hit rate and lengthen holding time.
These are safe starting points across commodities, currencies, indices, equities, and crypto. From there, small increments are preferred over dramatic changes.
How to evaluate responsibly
A clean chart and a direct test process help avoid confusion. Use standard candles for signals and exits. If you use a non standard chart type such as Heikin Ashi or Renko, do so only for visualization and not for the strategy’s signal computation, as those chart types can produce unrealistic fills. Turn off other indicators on the published chart unless they are needed to demonstrate a specific property of this strategy. When you post results or discuss outcomes, include the symbol, timeframe, commission and slippage settings, and the session settings used. This makes the context clear and avoids misleading readers.
When you look at results, consider the following.
The distribution of R per trade. A positive average R with a moderate profit factor suggests that exits are sized appropriately for the symbol.
The balance between long and short sides. The HUD table separates the two so you can see if one side carries the edge for that symbol.
The sensitivity to the tie preference. If many bars hit both stop and take profit, the market is chopping inside the risk box and you may need larger floors or stricter regime guards.
The session effect. Session hours matter for many instruments. Align your session filter with where liquidity and volatility concentrate.
Known limitations and honest warnings
PulseGrid is not a guarantee of future profit. It is a systematic way to read short term structure and to size risk in a way that reflects recent path. It assumes that the data feed reflects the exchange reality. It assumes that slippage and spread are non zero and uses explicit commission and user provided slippage to approximate that. It does not place multiple targets. It does not trail stops. It is not a high frequency system and does not attempt to model queue priority or microsecond fills. On illiquid symbols or very short timeframes outside regular hours, signals will be less reliable. Users are responsible for choosing realistic settings and for evaluating whether the symbol’s conditions are suitable.
First use checklist
Load the symbol and timeframe you care about.
If the instrument has clear sessions, turn on the session filter and select realistic London and New York hours or other sessions relevant to the instrument.
Set commission and slippage in the strategy properties to values that match your broker or exchange.
Run the strategy with defaults. Look at the HUD summary and the lines.
Decide whether to enable the directional filter. If you see frequent reversals around the entry line, enable it and raise the normalized gap threshold slightly.
Adjust the adaptive gate. If the chart floods, raise the percentile. If the chart starves, lower it or use a slightly lower fixed threshold.
Adjust the fallback span multiplier and tick floor so that stops are never microscopic.
Review per session performance. If one session underperforms, restrict entries to the better one.
This simple process takes minutes and transfers to any other symbol.
Why this script is private
The source remains private so that the underlying method and its implementation details are not copied or republished. The description here is complete and self contained so that users can understand the purpose, originality, usage, and limitations without needing to inspect the source. Privacy does not change the strategy’s on chart behavior. It only protects the specific coding details.
Guarantee and compliance statements
This description does not contain advertising, solicitations, links, or contact information. It does not make performance promises. It explains how the script is original and how it works. It also warns about limitations and the need for realistic assumptions. The strategy is not investment advice and is not created only for qualified investors. It can be tested and used for educational and research purposes. Users should read TradingView’s documentation on script properties and backtesting. Users should avoid non standard chart types for signal computation because those produce unrealistic results. Users should select realistic account sizes and friction settings. Users should not post claims without showing the settings used.
Closing summary
PulseGrid is a compact framework for short timeframe trading that combines a composite entry built from multiple normalized bar features with a symmetric span model for risk. The entry adapts to volatility. The regime guards keep the strategy inactive when the tape is either too quiet or too erratic. The risk geometry respects recent untraded spans instead of arbitrary distances. The entire design is instrument agnostic. It will run on any symbol that TradingView supports and it will behave consistently across asset classes with modest tuning. Use it with a clean chart, realistic friction, and enough trades to make your evaluation meaningful. Use sessions if the instrument concentrates activity in specific hours. Adjust one control at a time and prefer small increments. The goal is not to find a magic parameter. The goal is to maintain a stable rule set that reads market structure in a way you can trust and audit.

AnchorPulse RWAP Universal ScalperWhat it is
AnchorPulse Scalper is an intraday indicator that reads price in real time through three ideas working together.
A live pivot engine that detects the current micro leg.
An Anchored Range Weighted Average Price that starts at each new leg or session.
An adaptive rhythm score that communicates a simple bias: Buy, Sell, or Wait.
The goal is clarity. You get one anchor line, soft bands that show stretch, discrete Buy and Sell marks, and a plain-language dashboard that says Trend, Phase, Bias, Momentum, Volatility, Stretch, ETA to next turn, and Regime. No external dependencies and no lookahead. It is designed for standard chart types on one to five minute timeframes across liquid symbols such as major FX, index futures, large cap stocks, and mainstream crypto pairs.
What makes it original
Most scalpers either track a fixed moving average or draw from a session VWAP. AnchorPulse does neither. The anchor resets at every new micro leg detected by a real time pivot engine that measures distance in units of ATR rather than in fixed points. This produces a responsive anchor that updates only when the market proves a leg has turned. On top of that, the rhythm timer keeps an average of how long legs usually last, so the indicator can treat the start and the end of a leg differently. Early in a leg it favors continuation signals. Late in a leg it watches for mean reversion. This mix of an ATR-based leg detector, a leg-anchored RWAP, and a rhythm aware bias is the core originality.
Plain explanation of the calculations
Pivot engine. While price travels up, the script tracks the highest high reached since the last pivot. If price pulls back from that extreme by at least a user defined fraction of ATR, the leg flips down. The reverse applies to down legs. The distance threshold is adaptive because ATR changes with volatility. A short cooldown in bars can prevent double flips on violent bars.
Anchored Range Weighted Average Price. From the first bar of each new leg the script accumulates a weighted average of the typical price, where the weight is the true range of each bar. The anchor can also reset at the start of a session and can ignore the very first session bar to avoid overweighting the open gap.
Progress and phase. The script measures how far price traveled from the last pivot relative to the reversal threshold. That is progress. At the same time it maintains an exponential average of leg duration in bars. The current leg age divided by that average is the age ratio. An age ratio below an adaptive early threshold means Early. Above an adaptive late threshold means Late. The thresholds drift with recent variability in leg length so they match the rhythm of the market.
Wick pressure and intrabar skew. Lower wick minus upper wick, normalized by ATR and smoothed, acts as tape pressure. The sign of close minus open, smoothed, is intrabar skew. They are combined into a compact momentum read.
Bands and stretch. The script computes the deviation of typical price from the anchor and builds soft bands around the anchor. Standard deviation is capped by a multiple of mean absolute error to avoid inflated bands just after a pivot.
Regime filter. You may optionally gate continuation entries when the higher timeframe EMA disagrees, or gate reversals when ADX shows strong trend.
Adaptive edge score. Progress and momentum are turned into percentile scores using a normal CDF of their rolling z scores. This yields a familiar zero to one hundred scale that is easier to read than raw values. Early in an up leg adds a small bonus to long bias. Early in a down leg adds a small bonus to short bias.
Gap cap. Signals are rejected if price is too far from the anchor. The cap is expressed as a fraction of price, which scales across symbols.
What you see on the chart
One white anchor line. Two transparent bands. Subtle green or orange background when a bias is active. Buy marks below bars and Sell marks above bars. Small triangles at pivots. Bar tint softly aligned with momentum. A compact table in the corner that tells you the state in plain language. On alert, a single JSON line can be sent to your alert channel with ticker, timeframe, trend, phase, bias, edge score, stretch, ETA in bars, and regime note.
How to use it in practice
Choose a liquid symbol and a one to five minute timeframe.
Keep the mode on Hybrid until you learn the personality of the market. If you notice long directional pushes, try Continuation mode. If you see frequent fades near the end of legs, try Reversal mode.
Read the table. Trend shows Up or Down according to the current leg. Phase shows Early, Mid, or Late from the rhythm timer. Bias shows Buy, Sell, or Wait once the signal rules and the gap cap are satisfied. Momentum reads Strong Up, Neutral, or Strong Down from wick pressure and skew. Volatility shows Calm, Average, or Wild relative to an ATR baseline. Stretch vs anchor prints the distance between close and the anchor as a percent of price. ETA shows how many bars remain to the average leg length if such a read is meaningful. Regime reflects the optional gate: None, HTF Up, HTF Down, Strong, or Soft.
Focus on the anchor. Continuation longs are stronger when price holds above the anchor in the first part of an up leg with positive momentum and adequate progress. Continuation shorts are the mirror case below the anchor. Reversal longs are stronger when a down leg is late, price crosses the anchor, and momentum flips positive. Reversal shorts are the mirror case in late up legs.
Respect the gap cap. When price is stretched far away from the anchor, skip signals and wait for re-alignment or a fresh leg.
Keep the chart clean. The script is designed to work on its own. If you add other tools, make sure they do not paint multiple backgrounds or heavy drawings that obscure the anchor and the bands.
Inputs explained with practical defaults
The script ships with sensible defaults and all inputs provide tooltips inside the indicator. The description here is included so traders who do not read code can still understand how to tune it.
Signal mode. Continuation uses early leg logic. Reversal uses late leg logic at anchor crosses. Hybrid allows both and lets the edge score decide.
ATR length and Pivot reversal in ATR. These govern flips. Shorter ATR and smaller reversal multiples yield faster turns and more signals. Longer and larger do the opposite. A middle ground such as ATR 50 with reversal 0.75 often reads well across liquid markets.
Rhythm smoothing length and Freeze bars after flip. The first sets how quickly the average leg length adapts. The second prevents double flips on wide bars. Values around 20 and 1 to 3 bars work well for most symbols.
Session hours, Session reset, and Skip first session bar. These are optional. Day sessions in equities can benefit from a reset and from skipping the first bar so the anchor is not dragged by the open gap. Round the session to your venue.
Wick pressure length and Intrabar skew length. They control how quickly the micro momentum reacts. Values between 6 and 12 for wick pressure and 4 to 10 for skew are common.
Early and Late thresholds and the Adaptive option. If you turn adaptation on, the thresholds drift with leg variability. The adaptiveness setting controls the strength of that drift.
Minimum progress and Maximum stretch vs anchor. The first ensures that continuation signals only occur once the leg moved a minimum distance from the last pivot. The second prevents chasing far from the anchor. As a rule, raise minimum progress when the market chops and reduce it on trend days. Keep stretch around one to two percent for many symbols, then adjust by product.
Regime filter. Higher timeframe EMA supports trend alignment. ADX supports a simple read on the strength of trend. Use one at a time or none, depending on your preference.
Adaptive scoring lookback. The percentile logic needs a modest window. Values near one hundred twenty bars tend to give stable ranks without lagging too much.
Band settings. Band length and width control the look of the soft channel around the anchor. The cap versus mean absolute error is there to keep the bands realistic just after flips.
Visual controls. Pick labels, triangles, or circles, and choose to mark only state changes if you prefer a very clean chart.
Why the dashboard uses plain language
Many traders prefer to reason in simple terms rather than in raw values. The table abstracts the math into natural categories such as Early versus Late, Calm versus Wild, or Strong Up versus Strong Down. The only numeric reads are Stretch and Edge score because these help in threshold decisions. Stretch is a percent of price so it scales across markets. Edge is a normalized score from zero to one hundred that reflects the combined progress, momentum, and phase. The table is intended to be the only element you need to glance at during a fast session once you learn the anchor and the band cues.
Design choices and integrity
No repaint. The script uses bar closes and standard Pine semantics with lookahead off in security calls. There are no offset tricks that move plotted values after the fact.
One background painter. Background tint is created by a single call to avoid vertical stripes.
Reset logic is explicit. The anchor resets at a pivot or at session start if that option is enabled. This is written to be transparent so you know why the anchor restarted.
Conservative defaults. Out of the box, the script is not tuned to over trade. It communicates bias rather than forcing entries.
Clean chart guidance. The tool is meant to be used on standard bars or candles. It is not intended for synthetic chart types such as Heikin Ashi, Renko, Kagi, Point and Figure, or Range for the purpose of signal generation.
How to read a few common situations
Breakout with strong follow through. Trend reads Up. Phase reads Early. Momentum reads Strong Up. Stretch sits inside the band. Bias shows Buy. This is the typical continuation long.
Extended push into exhaustion. Trend reads Up. Phase reads Late. Momentum cools. Stretch prints a high positive percent of price. Bias flips to Wait, sometimes to Sell after an anchor cross. This is the potential reversal short.
Mean reverting chop. Trend flips often. Phase hangs around Mid. Momentum flips sign frequently. Stretch hovers near zero. Bias often prints Wait. In this case you let the market speak and only act when the leg matures or when stretch spikes away from the anchor.
Trend day with strength. ADX filter reads Strong. Continuation is allowed. Reversal attempts are blocked. Bias favors the dominant direction.
Session open. If you selected a session reset and chose to skip the first bar, the anchor starts at the second bar and the first prints do not dominate the anchor.
Limits and realistic expectations
This indicator measures leg structure and micro pressure to suggest a bias. It is not a self-contained trading system. It does not size positions, pick stops, or set take profits. It does not promise accuracy or profits. In violent markets the pivot detector can flip and then flip back. Cooldown reduces this effect but cannot remove it. During news and illiquid hours the anchor can move very quickly. Wide slippage and spread can make any intraday approach impractical. These are standard realities of intraday trading and they also apply here.
Suggested workflows
Discretionary scalper. Keep the chart clean. Use the table to decide whether to engage, then work entries at the anchor or inside the band. Focus on position risk and a predefined stop level independent of the script.
Session specialist. If you trade a venue with strong sessions such as US equities or major FX sessions, enable the session reset. Many traders find the tool shines in the first two hours and the last hour of an active session.
Multi timeframe monitor. Keep AnchorPulse on one to five minutes and a simple higher timeframe EMA on a separate chart. If you prefer a single chart, switch the regime filter to HTF Trend and let the indicator handle it.
Alert driven workflow. Create alerts on Buy or Sell. The payload contains the essential context so you can log and review. Use the payload fields to build a small notebook of cases you like to take.
Why it is published as protected
The script contains original logic that relies on a compact set of calculations not commonly seen together. Publishing as protected keeps the logic intact while still giving the community full access through the Public Library.
Frequently asked questions
Does it repaint
No. The pivot flips on confirmed bars using ATR distance. The anchor, bands, and dashboard read from that state and do not shift after the bar closes.
What settings should I change first
Try the reversal distance in ATR and the minimum progress. These two govern how active or selective the tool becomes. If you see too many flips, raise the ATR multiple or the freeze bars. If you want faster action, lower them slightly.
What is a reasonable stretch cap
One to two percent of price is a useful starting point for many symbols. Thin products may need a larger cap. Extremely liquid products can often work with a smaller cap.
Should I use the regime filter
On days with persistent trend, the higher timeframe EMA filter or the ADX filter can help keep you with the flow. On rotational days, consider turning the filter off to allow more two sided action.
Can I use it on higher timeframes
The logic works on any timeframe, but the design and defaults target one to five minutes. If you go higher, adjust the ATR length, reversal distance, and rank lookback accordingly.
Can I combine it with volume
Yes. A simple volume filter that marks above average volume near the anchor can help you time entries. Keep the chart readable.
Risk notice and user responsibility
This indicator is a tool for research and education. It does not give investment advice, trade recommendations, or any guarantee of outcomes. All trading carries risk including the loss of capital. Past performance is not a reliable guide to future results. You are solely responsible for your trading decisions, for verifying that the indicator behaves as you expect on your data and platform settings, and for selecting appropriate risk controls such as position sizing, stops, and loss limits.
Summary
AnchorPulse Scalper is a concise way to read the market’s current leg, its anchor, and its rhythm. The pivot engine tells you direction. The leg-anchored RWAP shows where value sits for this micro move. The adaptive score simplifies momentum and progress into a familiar scale. The dashboard translates complex calculations into the plain words that scalpers actually use. If you prefer simple signals, enable alerts and let them flow into your log. If you prefer context, watch the anchor and bands as the leg evolves and let the rhythm guide your timing. Use it respectfully on a clean chart, stay realistic, and keep your own rules for risk.

Moon Scalper v3 + VSAMoon Scalper v3 is a high-precision scalping indicator optimized for the 15-minute chart. It delivers clean buy/sell signals with TP1 (1:1 risk-reward) exits using layered confirmations:
• **Volatility Bands** — SMA + multiplier detect expansion zones
• **EMA Filter (200)** — ensures trades align with trend
• **RSI Range Filter** — avoids extreme overbought/oversold traps (buy: 52–62, sell: 38–48)
• **Volume Spike Filter** — filters for institutional activity (vol > 1.4×SMA)
• **VSA Confirmation** — requires wide-spread, high-volume bars with reclaim (volume × 1.4, spread × 1.5, reclaim 50%)
**Usage Notes:**
Best used on 15m timeframe for liquid pairs (e.g., BTCUSDT, ETHUSDT). Signals appear as “BUY” / “SELL” labels on chart. Defaults yield high TP1 hit rate; use only during active sessions (e.g., London/NY) for best accuracy.
**Disclaimer:**
This indicator is for educational purposes only. Past performance is not a guarantee of future results. Always backtest before live trading and manage risk responsibly.

Mayfair Fx Scalper✅ Mayfair FX Scalper — By EastWave Capital
The Mayfair FX Scalper is a precision-focused, closed-source indicator designed for short-term intraday trading, particularly scalping on lower timeframes such as 1-minute, 3-minute, and 5-minute charts. This tool is developed by EastWave Capital and is based on a combination of Relative Strength Index (RSI) extremes and specific candlestick structure patterns to detect potential exhaustion and reversal points in the market.
🔍 How It Works:
The algorithm operates by evaluating three core elements:
RSI Extremes:
RSI is calculated using default settings.
Buy signals are considered only when the RSI on the previous candle is below 22 (oversold), and the current candle is bullish, while the previous one was bearish.
Sell signals are considered when the RSI on the previous candle is above 78 (overbought), and the current candle is bearish, while the previous one was bullish.
Candle Confirmation Logic:
The system waits for candle confirmation (e.g., shift in bullish/bearish structure) rather than triggering signals based on RSI alone.
This avoids false triggers in strong trends and filters weak entries.
SL/TP Estimation (Visual):
While not automatically placing orders, the indicator can optionally display lines or small labels showing a Stop Loss at the previous swing high/low (±0.5) and TP levels at 1R, 2R, and 3R based on that stop.
These visual aids help traders plan risk/reward and exits manually.
📈 How to Use:
Timeframes: Best suited for 1M, 3M, and 5M charts
Markets: Works well on Gold (XAU/USD), Forex majors, Indices, and Crypto
Session: Performs best during high volatility sessions (London & NY)
Use Case:
Wait for a signal label to appear after a clear momentum move.
Confirm price action and trend context.
Use provided visual SL/TP labels or apply your manual RR planning.
Combine with structure breaks, FVG zones, or liquidity sweeps for confluence.
⚠️ Important Notes:
This indicator does not repaint.
No automatic trades are executed. Signals are visual.
Not intended for use in isolation; best when combined with proper trade management and confirmation tools.
Past performance does not guarantee future results. Always manage risk appropriately

Trend Gauge [BullByte]Trend Gauge
Summary
A multi-factor trend detection indicator that aggregates EMA alignment, VWMA momentum scaling, volume spikes, ATR breakout strength, higher-timeframe confirmation, ADX-based regime filtering, and RSI pivot-divergence penalty into one normalized trend score. It also provides a confidence meter, a Δ Score momentum histogram, divergence highlights, and a compact, scalable dashboard for at-a-glance status.
________________________________________
## 1. Purpose of the Indicator
Why this was built
Traders often monitor several indicators in parallel - EMAs, volume signals, volatility breakouts, higher-timeframe trends, ADX readings, divergence alerts, etc., which can be cumbersome and sometimes contradictory. The “Trend Gauge” indicator was created to consolidate these complementary checks into a single, normalized score that reflects the prevailing market bias (bullish, bearish, or neutral) and its strength. By combining multiple inputs with an adaptive regime filter, scaling contributions by magnitude, and penalizing weakening signals (divergence), this tool aims to reduce noise, highlight genuine trend opportunities, and warn when momentum fades.
Key Design Goals
Signal Aggregation
Merged trend-following signals (EMA crossover, ATR breakout, higher-timeframe confirmation) and momentum signals (VWMA thrust, volume spikes) into a unified score that reflects directional bias more holistically.
Market Regime Awareness
Implemented an ADX-style filter to distinguish between trending and ranging markets, reducing the influence of trend signals during sideways phases to avoid false breakouts.
Magnitude-Based Scaling
Replaced binary contributions with scaled inputs: VWMA thrust and ATR breakout are weighted relative to recent averages, allowing for more nuanced score adjustments based on signal strength.
Momentum Divergence Penalty
Integrated pivot-based RSI divergence detection to slightly reduce the overall score when early signs of momentum weakening are detected, improving risk-awareness in entries.
Confidence Transparency
Added a live confidence metric that shows what percentage of enabled sub-indicators currently agree with the overall bias, making the scoring system more interpretable.
Momentum Acceleration Visualization
Plotted the change in score (Δ Score) as a histogram bar-to-bar, highlighting whether momentum is increasing, flattening, or reversing, aiding in more timely decision-making.
Compact Informational Dashboard
Presented a clean, scalable dashboard that displays each component’s status, the final score, confidence %, detected regime (Trending/Ranging), and a labeled strength gauge for quick visual assessment.
________________________________________
## 2. Why a Trader Should Use It
Main benefits and use cases
1. Unified View: Rather than juggling multiple windows or panels, this indicator delivers a single score synthesizing diverse signals.
2. Regime Filtering: In ranging markets, trend signals often generate false entries. The ADX-based regime filter automatically down-weights trend-following components, helping you avoid chasing false breakouts.
3. Nuanced Momentum & Volatility: VWMA and ATR breakout contributions are normalized by recent averages, so strong moves register strongly while smaller fluctuations are de-emphasized.
4. Early Warning of Weakening: Pivot-based RSI divergence is detected and used to slightly reduce the score when price/momentum diverges, giving a cautionary signal before a full reversal.
5. Confidence Meter: See at a glance how many sub-indicators align with the aggregated bias (e.g., “80% confidence” means 4 out of 5 components agree ). This transparency avoids black-box decisions.
6. Trend Acceleration/Deceleration View: The Δ Score histogram visualizes whether the aggregated score is rising (accelerating trend) or falling (momentum fading), supplementing the main oscillator.
7. Compact Dashboard: A corner table lists each check’s status (“Bull”, “Bear”, “Flat” or “Disabled”), plus overall Score, Confidence %, Regime, Trend Strength label, and a gauge bar. Users can scale text size (Normal, Small, Tiny) without removing elements, so the full picture remains visible even in compact layouts.
8. Customizable & Transparent: All components can be enabled/disabled and parameterized (lengths, thresholds, weights). The full Pine code is open and well-commented, letting users inspect or adapt the logic.
9. Alert-ready: Built-in alert conditions fire when the score crosses weak thresholds to bullish/bearish or returns to neutral, enabling timely notifications.
________________________________________
## 3. Component Rationale (“Why These Specific Indicators?”)
Each sub-component was chosen because it adds complementary information about trend or momentum:
1. EMA Cross
o Basic trend measure: compares a faster EMA vs. a slower EMA. Quickly reflects trend shifts but by itself can whipsaw in sideways markets.
2. VWMA Momentum
o Volume-weighted moving average change indicates momentum with volume context. By normalizing (dividing by a recent average absolute change), we capture the strength of momentum relative to recent history. This scaling prevents tiny moves from dominating and highlights genuinely strong momentum.
3. Volume Spikes
o Sudden jumps in volume combined with price movement often accompany stronger moves or reversals. A binary detection (+1 for bullish spike, -1 for bearish spike) flags high-conviction bars.
4. ATR Breakout
o Detects price breaking beyond recent highs/lows by a multiple of ATR. Measures breakout strength by how far beyond the threshold price moves relative to ATR, capped to avoid extreme outliers. This gives a volatility-contextual trend signal.
5. Higher-Timeframe EMA Alignment
o Confirms whether the shorter-term trend aligns with a higher timeframe trend. Uses request.security with lookahead_off to avoid future data. When multiple timeframes agree, confidence in direction increases.
6. ADX Regime Filter (Manual Calculation)
o Computes directional movement (+DM/–DM), smoothes via RMA, computes DI+ and DI–, then a DX and ADX-like value. If ADX ≥ threshold, market is “Trending” and trend components carry full weight; if ADX < threshold, “Ranging” mode applies a configurable weight multiplier (e.g., 0.5) to trend-based contributions, reducing false signals in sideways conditions. Volume spikes remain binary (optional behavior; can be adjusted if desired).
7. RSI Pivot-Divergence Penalty
o Uses ta.pivothigh / ta.pivotlow with a lookback to detect pivot highs/lows on price and corresponding RSI values. When price makes a higher high but RSI makes a lower high (bearish divergence), or price makes a lower low but RSI makes a higher low (bullish divergence), a divergence signal is set. Rather than flipping the trend outright, the indicator subtracts (or adds) a small penalty (configurable) from the aggregated score if it would weaken the current bias. This subtle adjustment warns of weakening momentum without overreacting to noise.
8. Confidence Meter
o Counts how many enabled components currently agree in direction with the aggregated score (i.e., component sign × score sign > 0). Displays this as a percentage. A high percentage indicates strong corroboration; a low percentage warns of mixed signals.
9. Δ Score Momentum View
o Plots the bar-to-bar change in the aggregated score (delta_score = score - score ) as a histogram. When positive, bars are drawn in green above zero; when negative, bars are drawn in red below zero. This reveals acceleration (rising Δ) or deceleration (falling Δ), supplementing the main oscillator.
10. Dashboard
• A table in the indicator pane’s top-right with 11 rows:
1. EMA Cross status
2. VWMA Momentum status
3. Volume Spike status
4. ATR Breakout status
5. Higher-Timeframe Trend status
6. Score (numeric)
7. Confidence %
8. Regime (“Trending” or “Ranging”)
9. Trend Strength label (e.g., “Weak Bullish Trend”, “Strong Bearish Trend”)
10. Gauge bar visually representing score magnitude
• All rows always present; size_opt (Normal, Small, Tiny) only changes text size via text_size, not which elements appear. This ensures full transparency.
________________________________________
## 4. What Makes This Indicator Stand Out
• Regime-Weighted Multi-Factor Score: Trend and momentum signals are adaptively weighted by market regime (trending vs. ranging) , reducing false signals.
• Magnitude Scaling: VWMA and ATR breakout contributions are normalized by recent average momentum or ATR, giving finer gradation compared to simple ±1.
• Integrated Divergence Penalty: Divergence directly adjusts the aggregated score rather than appearing as a separate subplot; this influences alerts and trend labeling in real time.
• Confidence Meter: Shows the percentage of sub-signals in agreement, providing transparency and preventing blind trust in a single metric.
• Δ Score Histogram Momentum View: A histogram highlights acceleration or deceleration of the aggregated trend score, helping detect shifts early.
• Flexible Dashboard: Always-visible component statuses and summary metrics in one place; text size scaling keeps the full picture available in cramped layouts.
• Lookahead-Safe HTF Confirmation: Uses lookahead_off so no future data is accessed from higher timeframes, avoiding repaint bias.
• Repaint Transparency: Divergence detection uses pivot functions that inherently confirm only after lookback bars; description documents this lag so users understand how and when divergence labels appear.
• Open-Source & Educational: Full, well-commented Pine v6 code is provided; users can learn from its structure: manual ADX computation, conditional plotting with series = show ? value : na, efficient use of table.new in barstate.islast, and grouped inputs with tooltips.
• Compliance-Conscious: All plots have descriptive titles; inputs use clear names; no unnamed generic “Plot” entries; manual ADX uses RMA; all request.security calls use lookahead_off. Code comments mention repaint behavior and limitations.
________________________________________
## 5. Recommended Timeframes & Tuning
• Any Timeframe: The indicator works on small (e.g., 1m) to large (daily, weekly) timeframes. However:
o On very low timeframes (<1m or tick charts), noise may produce frequent whipsaws. Consider increasing smoothing lengths, disabling certain components (e.g., volume spike if volume data noisy), or using a larger pivot lookback for divergence.
o On higher timeframes (daily, weekly), consider longer lookbacks for ATR breakout or divergence, and set Higher-Timeframe trend appropriately (e.g., 4H HTF when on 5 Min chart).
• Defaults & Experimentation: Default input values are chosen to be balanced for many liquid markets. Users should test with replay or historical analysis on their symbol/timeframe and adjust:
o ADX threshold (e.g., 20–30) based on instrument volatility.
o VWMA and ATR scaling lengths to match average volatility cycles.
o Pivot lookback for divergence: shorter for faster markets, longer for slower ones.
• Combining with Other Analysis: Use in conjunction with price action, support/resistance, candlestick patterns, order flow, or other tools as desired. The aggregated score and alerts can guide attention but should not be the sole decision-factor.
________________________________________
## 6. How Scoring and Logic Works (Step-by-Step)
1. Compute Sub-Scores
o EMA Cross: Evaluate fast EMA > slow EMA ? +1 : fast EMA < slow EMA ? -1 : 0.
o VWMA Momentum: Calculate vwma = ta.vwma(close, length), then vwma_mom = vwma - vwma . Normalize: divide by recent average absolute momentum (e.g., ta.sma(abs(vwma_mom), lookback)), clip to .
o Volume Spike: Compute vol_SMA = ta.sma(volume, len). If volume > vol_SMA * multiplier AND price moved up ≥ threshold%, assign +1; if moved down ≥ threshold%, assign -1; else 0.
o ATR Breakout: Determine recent high/low over lookback. If close > high + ATR*mult, compute distance = close - (high + ATR*mult), normalize by ATR, cap at a configured maximum. Assign positive contribution. Similarly for bearish breakout below low.
o Higher-Timeframe Trend: Use request.security(..., lookahead=barmerge.lookahead_off) to fetch HTF EMAs; assign +1 or -1 based on alignment.
2. ADX Regime Weighting
o Compute manual ADX: directional movements (+DM, –DM), smoothed via RMA, DI+ and DI–, then DX and ADX via RMA. If ADX ≥ threshold, market is considered “Trending”; otherwise “Ranging.”
o If trending, trend-based contributions (EMA, VWMA, ATR, HTF) use full weight = 1.0. If ranging, use weight = ranging_weight (e.g., 0.5) to down-weight them. Volume spike stays binary ±1 (optional to change if desired).
3. Aggregate Raw Score
o Sum weighted contributions of all enabled components. Count the number of enabled components; if zero, default count = 1 to avoid division by zero.
4. Divergence Penalty
o Detect pivot highs/lows on price and corresponding RSI values, using a lookback. When price and RSI diverge (bearish or bullish divergence), check if current raw score is in the opposing direction:
If bearish divergence (price higher high, RSI lower high) and raw score currently positive, subtract a penalty (e.g., 0.5).
If bullish divergence (price lower low, RSI higher low) and raw score currently negative, add a penalty.
o This reduces score magnitude to reflect weakening momentum, without flipping the trend outright.
5. Normalize and Smooth
o Normalized score = (raw_score / number_of_enabled_components) * 100. This yields a roughly range.
o Optional EMA smoothing of this normalized score to reduce noise.
6. Interpretation
o Sign: >0 = net bullish bias; <0 = net bearish bias; near zero = neutral.
o Magnitude Zones: Compare |score| to thresholds (Weak, Medium, Strong) to label trend strength (e.g., “Weak Bullish Trend”, “Medium Bearish Trend”, “Strong Bullish Trend”).
o Δ Score Histogram: The histogram bars from zero show change from previous bar’s score; positive bars indicate acceleration, negative bars indicate deceleration.
o Confidence: Percentage of sub-indicators aligned with the score’s sign.
o Regime: Indicates whether trend-based signals are fully weighted or down-weighted.
________________________________________
## 7. Oscillator Plot & Visualization: How to Read It
Main Score Line & Area
The oscillator plots the aggregated score as a line, with colored fill: green above zero for bullish area, red below zero for bearish area. Horizontal reference lines at ±Weak, ±Medium, and ±Strong thresholds mark zones: crossing above +Weak suggests beginning of bullish bias, above +Medium for moderate strength, above +Strong for strong trend; similarly for bearish below negative thresholds.
Δ Score Histogram
If enabled, a histogram shows score - score . When positive, bars appear in green above zero, indicating accelerating bullish momentum; when negative, bars appear in red below zero, indicating decelerating or reversing momentum. The height of each bar reflects the magnitude of change in the aggregated score from the prior bar.
Divergence Highlight Fill
If enabled, when a pivot-based divergence is confirmed:
• Bullish Divergence : fill the area below zero down to –Weak threshold in green, signaling potential reversal from bearish to bullish.
• Bearish Divergence : fill the area above zero up to +Weak threshold in red, signaling potential reversal from bullish to bearish.
These fills appear with a lag equal to pivot lookback (the number of bars needed to confirm the pivot). They do not repaint after confirmation, but users must understand this lag.
Trend Direction Label
When score crosses above or below the Weak threshold, a small label appears near the score line reading “Bullish” or “Bearish.” If the score returns within ±Weak, the label “Neutral” appears. This helps quickly identify shifts at the moment they occur.
Dashboard Panel
In the indicator pane’s top-right, a table shows:
1. EMA Cross status: “Bull”, “Bear”, “Flat”, or “Disabled”
2. VWMA Momentum status: similarly
3. Volume Spike status: “Bull”, “Bear”, “No”, or “Disabled”
4. ATR Breakout status: “Bull”, “Bear”, “No”, or “Disabled”
5. Higher-Timeframe Trend status: “Bull”, “Bear”, “Flat”, or “Disabled”
6. Score: numeric value (rounded)
7. Confidence: e.g., “80%” (colored: green for high, amber for medium, red for low)
8. Regime: “Trending” or “Ranging” (colored accordingly)
9. Trend Strength: textual label based on magnitude (e.g., “Medium Bullish Trend”)
10. Gauge: a bar of blocks representing |score|/100
All rows remain visible at all times; changing Dashboard Size only scales text size (Normal, Small, Tiny).
________________________________________
## 8. Example Usage (Illustrative Scenario)
Example: BTCUSD 5 Min
1. Setup: Add “Trend Gauge ” to your BTCUSD 5 Min chart. Defaults: EMAs (8/21), VWMA 14 with lookback 3, volume spike settings, ATR breakout 14/5, HTF = 5m (or adjust to 4H if preferred), ADX threshold 25, ranging weight 0.5, divergence RSI length 14 pivot lookback 5, penalty 0.5, smoothing length 3, thresholds Weak=20, Medium=50, Strong=80. Dashboard Size = Small.
2. Trend Onset: At some point, price breaks above recent high by ATR multiple, volume spikes upward, faster EMA crosses above slower EMA, HTF EMA also bullish, and ADX (manual) ≥ threshold → aggregated score rises above +20 (Weak threshold) into +Medium zone. Dashboard shows “Bull” for EMA, VWMA, Vol Spike, ATR, HTF; Score ~+60–+70; Confidence ~100%; Regime “Trending”; Trend Strength “Medium Bullish Trend”; Gauge ~6–7 blocks. Δ Score histogram bars are green and rising, indicating accelerating bullish momentum. Trader notes the alignment.
3. Divergence Warning: Later, price makes a slightly higher high but RSI fails to confirm (lower RSI high). Pivot lookback completes; the indicator highlights a bearish divergence fill above zero and subtracts a small penalty from the score, causing score to stall or retrace slightly. Dashboard still bullish but score dips toward +Weak. This warns the trader to tighten stops or take partial profits.
4. Trend Weakens: Score eventually crosses below +Weak back into neutral; a “Neutral” label appears, and a “Neutral Trend” alert fires if enabled. Trader exits or avoids new long entries. If score subsequently crosses below –Weak, a “Bearish” label and alert occur.
5. Customization: If the trader finds VWMA noise too frequent on this instrument, they may disable VWMA or increase lookback. If ATR breakouts are too rare, adjust ATR length or multiplier. If ADX threshold seems off, tune threshold. All these adjustments are explained in Inputs section.
6. Visualization: The screenshot shows the main score oscillator with colored areas, reference lines at ±20/50/80, Δ Score histogram bars below/above zero, divergence fill highlighting potential reversal, and the dashboard table in the top-right.
________________________________________
## 9. Inputs Explanation
A concise yet clear summary of inputs helps users understand and adjust:
1. General Settings
• Theme (Dark/Light): Choose background-appropriate colors for the indicator pane.
• Dashboard Size (Normal/Small/Tiny): Scales text size only; all dashboard elements remain visible.
2. Indicator Settings
• Enable EMA Cross: Toggle on/off basic EMA alignment check.
o Fast EMA Length and Slow EMA Length: Periods for EMAs.
• Enable VWMA Momentum: Toggle VWMA momentum check.
o VWMA Length: Period for VWMA.
o VWMA Momentum Lookback: Bars to compare VWMA to measure momentum.
• Enable Volume Spike: Toggle volume spike detection.
o Volume SMA Length: Period to compute average volume.
o Volume Spike Multiplier: How many times above average volume qualifies as spike.
o Min Price Move (%): Minimum percent change in price during spike to qualify as bullish or bearish.
• Enable ATR Breakout: Toggle ATR breakout detection.
o ATR Length: Period for ATR.
o Breakout Lookback: Bars to look back for recent highs/lows.
o ATR Multiplier: Multiplier for breakout threshold.
• Enable Higher Timeframe Trend: Toggle HTF EMA alignment.
o Higher Timeframe: E.g., “5” for 5-minute when on 1-minute chart, or “60” for 5 Min when on 15m, etc. Uses lookahead_off.
• Enable ADX Regime Filter: Toggles regime-based weighting.
o ADX Length: Period for manual ADX calculation.
o ADX Threshold: Value above which market considered trending.
o Ranging Weight Multiplier: Weight applied to trend components when ADX < threshold (e.g., 0.5).
• Scale VWMA Momentum: Toggle normalization of VWMA momentum magnitude.
o VWMA Mom Scale Lookback: Period for average absolute VWMA momentum.
• Scale ATR Breakout Strength: Toggle normalization of breakout distance by ATR.
o ATR Scale Cap: Maximum multiple of ATR used for breakout strength.
• Enable Price-RSI Divergence: Toggle divergence detection.
o RSI Length for Divergence: Period for RSI.
o Pivot Lookback for Divergence: Bars on each side to identify pivot high/low.
o Divergence Penalty: Amount to subtract/add to score when divergence detected (e.g., 0.5).
3. Score Settings
• Smooth Score: Toggle EMA smoothing of normalized score.
• Score Smoothing Length: Period for smoothing EMA.
• Weak Threshold: Absolute score value under which trend is considered weak or neutral.
• Medium Threshold: Score above Weak but below Medium is moderate.
• Strong Threshold: Score above this indicates strong trend.
4. Visualization Settings
• Show Δ Score Histogram: Toggle display of the bar-to-bar change in score as a histogram. Default true.
• Show Divergence Fill: Toggle background fill highlighting confirmed divergences. Default true.
Each input has a tooltip in the code.
________________________________________
## 10. Limitations, Repaint Notes, and Disclaimers
10.1. Repaint & Lag Considerations
• Pivot-Based Divergence Lag: The divergence detection uses ta.pivothigh / ta.pivotlow with a specified lookback. By design, a pivot is only confirmed after the lookback number of bars. As a result:
o Divergence labels or fills appear with a delay equal to the pivot lookback.
o Once the pivot is confirmed and the divergence is detected, the fill/label does not repaint thereafter, but you must understand and accept this lag.
o Users should not treat divergence highlights as predictive signals without additional confirmation, because they appear after the pivot has fully formed.
• Higher-Timeframe EMA Alignment: Uses request.security(..., lookahead=barmerge.lookahead_off), so no future data from the higher timeframe is used. This avoids lookahead bias and ensures signals are based only on completed higher-timeframe bars.
• No Future Data: All calculations are designed to avoid using future information. For example, manual ADX uses RMA on past data; security calls use lookahead_off.
10.2. Market & Noise Considerations
• In very choppy or low-liquidity markets, some components (e.g., volume spikes or VWMA momentum) may be noisy. Users can disable or adjust those components’ parameters.
• On extremely low timeframes, noise may dominate; consider smoothing lengths or disabling certain features.
• On very high timeframes, pivots and breakouts occur less frequently; adjust lookbacks accordingly to avoid sparse signals.
10.3. Not a Standalone Trading System
• This is an indicator, not a complete trading strategy. It provides signals and context but does not manage entries, exits, position sizing, or risk management.
• Users must combine it with their own analysis, money management, and confirmations (e.g., price patterns, support/resistance, fundamental context).
• No guarantees: past behavior does not guarantee future performance.
10.4. Disclaimers
• Educational Purposes Only: The script is provided as-is for educational and informational purposes. It does not constitute financial, investment, or trading advice.
• Use at Your Own Risk: Trading involves risk of loss. Users should thoroughly test and use proper risk management.
• No Guarantees: The author is not responsible for trading outcomes based on this indicator.
• License: Published under Mozilla Public License 2.0; code is open for viewing and modification under MPL terms.
________________________________________
## 11. Alerts
• The indicator defines three alert conditions:
1. Bullish Trend: when the aggregated score crosses above the Weak threshold.
2. Bearish Trend: when the score crosses below the negative Weak threshold.
3. Neutral Trend: when the score returns within ±Weak after being outside.
Good luck
– BullByte

Ultimate Scalping Tool[BullByte]Overview
The Ultimate Scalping Tool is an open-source TradingView indicator built for scalpers and short-term traders released under the Mozilla Public License 2.0. It uses a custom Quantum Flux Candle (QFC) oscillator to combine multiple market forces into one visual signal. In plain terms, the script reads momentum, trend strength, volatility, and volume together and plots a special “candlestick” each bar (the QFC) that reflects the overall market bias. This unified view makes it easier to spot entries and exits: the tool labels signals as Strong Buy/Sell, Pullback (a brief retracement in a trend), Early Entry, or Exit Warning . It also provides color-coded alerts and a small dashboard of metrics. In practice, traders see green/red oscillator bars and symbols on the chart when conditions align, helping them scalp or trend-follow without reading multiple separate indicators.
Core Components
Quantum Flux Candle (QFC) Construction
The QFC is the heart of the indicator. Rather than using raw price, it creates a candlestick-like bar from the underlying oscillator values. Each QFC bar has an “open,” “high/low,” and “close” derived from calculated momentum and volatility inputs for that period . In effect, this turns the oscillator into intuitive candle patterns so traders can recognize momentum shifts visually. (For comparison, note that Heikin-Ashi candles “have a smoother look because take an average of the movement”. The QFC instead represents exact oscillator readings, so it reflects true momentum changes without hiding price action.) Colors of QFC bars change dynamically (e.g. green for bullish momentum, red for bearish) to highlight shifts. This is the first open-source QFC oscillator that dynamically weights four non-correlated indicators with moving thresholds, which makes it a unique indicator on its own.
Oscillator Normalization & Adaptive Weights
The script normalizes its oscillator to a fixed scale (for example, a 0–100 range much like the RSI) so that various inputs can be compared fairly. It then applies adaptive weighting: the relative influence of trend, momentum, volatility or volume signals is automatically adjusted based on current market conditions. For instance, in very volatile markets the script might weight volatility more heavily, or in a strong trend it might give extra weight to trend direction. Normalizing data and adjusting weights helps keep the QFC sensitive but stable (normalization ensures all inputs fit a common scale).
Trend/Momentum/Volume/Volatility Fusion
Unlike a typical single-factor oscillator, the QFC oscillator fuses four aspects at once. It may compute, for example, a trend indicator (such as an ADX or moving average slope), a momentum measure (like RSI or Rate-of-Change), a volume-based pressure (similar to MFI/OBV), and a volatility measure (like ATR) . These different values are combined into one composite oscillator. This “multi-dimensional” approach follows best practices of using non-correlated indicators (trend, momentum, volume, volatility) for confirmation. By encoding all these signals in one line, a high QFC reading means that trend, momentum, and volume are all aligned, whereas a neutral reading might mean mixed conditions. This gives traders a comprehensive picture of market strength.
Signal Classification
The script interprets the QFC oscillator to label trades. For example:
• Strong Buy/Sell : Triggered when the oscillator crosses a high-confidence threshold (e.g. breaks clearly above zero with strong slope), indicating a well-confirmed move. This is like seeing a big green/red QFC candle aligned with the trend.
• Pullbacks : Identified when the trend is up but momentum dips briefly. A Pullback Buy appears if the overall trend is bullish but the oscillator has a short retracement – a typical buying opportunity in an uptrend. (A pullback is “a brief decline or pause in a generally upward price trend”.)
• Early Buy/Sell : Marks an initial swing in the oscillator suggesting a possible new trend, before it is fully confirmed. It’s a hint of momentum building (an early-warning signal), not as strong as the confirmed “Strong” signal.
• Exit Warnings : Issued when momentum peaks or reverses. For instance, if the QFC bars reach a high and start turning red/green opposite, the indicator warns that the move may be ending. In other words, a Momentum Peak is the point of maximum strength after which weakness may follow.
These categories correspond to typical trading concepts: Pullback (temporary reversal in an uptrend), Early Buy (an initial bullish cross), Strong Buy (confirmed bullish momentum), and Momentum Peak (peak oscillator value suggesting exhaustion).
Filters (DI Reversal, Dynamic Thresholds, HTF EMA/ADX)
Extra filters help avoid bad trades. A DI Reversal filter uses the +DI/–DI lines (from the ADX system) to require that the trend direction confirms the signal . For example, it might ignore a buy signal if the +DI is still below –DI. Dynamic Thresholds adjust signal levels on-the-fly: rather than fixed “overbought” lines, they move with volatility so signals happen under appropriate market stress. An optional High-Timeframe EMA or ADX filter adds a check against a larger timeframe trend: for instance, only taking a trade if price is above the weekly EMA or if weekly ADX shows a strong trend. (Notably, the ADX is “a technical indicator used by traders to determine the strength of a price trend”, so requiring a high-timeframe ADX avoids trading against the bigger trend.)
Dashboard Metrics & Color Logic
The Dashboard in the Ultimate Scalping Tool (UST) serves as a centralized information hub, providing traders with real-time insights into market conditions, trend strength, momentum, volume pressure, and trade signals. It is highly customizable, allowing users to adjust its appearance and content based on their preferences.
1. Dashboard Layout & Customization
Short vs. Extended Mode : Users can toggle between a compact view (9 rows) and an extended view (13 rows) via the `Short Dashboard` input.
Text Size Options : The dashboard supports three text sizes— Tiny, Small, and Normal —adjustable via the `Dashboard Text Size` input.
Positioning : The dashboard is positioned in the top-right corner by default but can be moved if modified in the script.
2. Key Metrics Displayed
The dashboard presents critical trading metrics in a structured table format:
Trend (TF) : Indicates the current trend direction (Strong Bullish, Moderate Bullish, Sideways, Moderate Bearish, Strong Bearish) based on normalized trend strength (normTrend) .
Momentum (TF) : Displays momentum status (Strong Bullish/Bearish or Neutral) derived from the oscillator's position relative to dynamic thresholds.
Volume (CMF) : Shows buying/selling pressure levels (Very High Buying, High Selling, Neutral, etc.) based on the Chaikin Money Flow (CMF) indicator.
Basic & Advanced Signals:
Basic Signal : Provides simple trade signals (Strong Buy, Strong Sell, Pullback Buy, Pullback Sell, No Trade).
Advanced Signal : Offers nuanced signals (Early Buy/Sell, Momentum Peak, Weakening Momentum, etc.) with color-coded alerts.
RSI : Displays the Relative Strength Index (RSI) value, colored based on overbought (>70), oversold (<30), or neutral conditions.
HTF Filter : Indicates the higher timeframe trend status (Bullish, Bearish, Neutral) when using the Leading HTF Filter.
VWAP : Shows the V olume-Weighted Average Price and whether the current price is above (bullish) or below (bearish) it.
ADX : Displays the Average Directional Index (ADX) value, with color highlighting whether it is rising (green) or falling (red).
Market Mode : Shows the selected market type (Crypto, Stocks, Options, Forex, Custom).
Regime : Indicates volatility conditions (High, Low, Moderate) based on the **ATR ratio**.
3. Filters Status Panel
A secondary panel displays the status of active filters, helping traders quickly assess which conditions are influencing signals:
- DI Reversal Filter: On/Off (confirms reversals before generating signals).
- Dynamic Thresholds: On/Off (adjusts buy/sell thresholds based on volatility).
- Adaptive Weighting: On/Off (auto-adjusts oscillator weights for trend/momentum/volatility).
- Early Signal: On/Off (enables early momentum-based signals).
- Leading HTF Filter: On/Off (applies higher timeframe trend confirmation).
4. Visual Enhancements
Color-Coded Cells : Each metric is color-coded (green for bullish, red for bearish, gray for neutral) for quick interpretation.
Dynamic Background : The dashboard background adapts to market conditions (bullish/bearish/neutral) based on ADX and DI trends.
Customizable Reference Lines : Users can enable/disable fixed reference lines for the oscillator.
How It(QFC) Differs from Traditional Indicators
Quantum Flux Candle (QFC) Versus Heikin-Ashi
Heikin-Ashi candles smooth price by averaging (HA’s open/close use averages) so they show trend clearly but hide true price (the current HA bar’s close is not the real price). QFC candles are different: they are oscillator values, not price averages . A Heikin-Ashi chart “has a smoother look because it is essentially taking an average of the movement”, which can cause lag. The QFC instead shows the raw combined momentum each bar, allowing faster recognition of shifts. In short, HA is a smoothed price chart; QFC is a momentum-based chart.
Versus Standard Oscillators
Common oscillators like RSI or MACD use fixed formulas on price (or price+volume). For example, RSI “compares gains and losses and normalizes this value on a scale from 0 to 100”, reflecting pure price momentum. MFI is similar but adds volume. These indicators each show one dimension: momentum or volume. The Ultimate Scalping Tool’s QFC goes further by integrating trend strength and volatility too. In practice, this means a move that looks strong on RSI might be downplayed by low volume or weak trend in QFC. As one source notes, using multiple non-correlated indicators (trend, momentum, volume, volatility) provides a more complete market picture. The QFC’s multi-factor fusion is unique – it is effectively a multi-dimensional oscillator rather than a traditional single-input one.
Signal Style
Traditional oscillators often use crossovers (RSI crossing 50) or fixed zones (MACD above zero) for signals. The Ultimate Scalping Tool’s signals are custom-classified: it explicitly labels pullbacks, early entries, and strong moves. These terms go beyond a typical indicator’s generic “buy”/“sell.” In other words, it packages a strategy around the oscillator, which traders can backtest or observe without reading code.
Key Term Definitions
• Pullback : A short-term dip or consolidation in an uptrend. In this script, a Pullback Buy appears when price is generally rising but shows a brief retracement. (As defined by Investopedia, a pullback is “a brief decline or pause in a generally upward price trend”.)
• Early Buy/Sell : An initial or tentative entry signal. It means the oscillator first starts turning positive (or negative) before a full trend has developed. It’s an early indication that a trend might be starting.
• Strong Buy/Sell : A confident entry signal when multiple conditions align. This label is used when momentum is already strong and confirmed by trend/volume filters, offering a higher-probability trade.
• Momentum Peak : The point where bullish (or bearish) momentum reaches its maximum before weakening. When the oscillator value stops rising (or falling) and begins to reverse, the script flags it as a peak – signaling that the current move could be overextended.
What is the Flux MA?
The Flux MA (Moving Average) is an Exponential Moving Average (EMA) applied to a normalized oscillator, referred to as FM . Its purpose is to smooth out the fluctuations of the oscillator, providing a clearer picture of the underlying trend direction and strength. Think of it as a dynamic baseline that the oscillator moves above or below, helping you determine whether the market is trending bullish or bearish.
How it’s calculated (Flux MA):
1.The oscillator is normalized (scaled to a range, typically between 0 and 1, using a default scale factor of 100.0).
2.An EMA is applied to this normalized value (FM) over a user-defined period (default is 10 periods).
3.The result is rescaled back to the oscillator’s original range for plotting.
Why it matters : The Flux MA acts like a support or resistance level for the oscillator, making it easier to spot trend shifts.
Color of the Flux Candle
The Quantum Flux Candle visualizes the normalized oscillator (FM) as candlesticks, with colors that indicate specific market conditions based on the relationship between the FM and the Flux MA. Here’s what each color means:
• Green : The FM is above the Flux MA, signaling bullish momentum. This suggests the market is trending upward.
• Red : The FM is below the Flux MA, signaling bearish momentum. This suggests the market is trending downward.
• Yellow : Indicates strong buy conditions (e.g., a "Strong Buy" signal combined with a positive trend). This is a high-confidence signal to go long.
• Purple : Indicates strong sell conditions (e.g., a "Strong Sell" signal combined with a negative trend). This is a high-confidence signal to go short.
The candle mode shows the oscillator’s open, high, low, and close values for each period, similar to price candlesticks, but it’s the color that provides the quick visual cue for trading decisions.
How to Trade the Flux MA with Respect to the Candle
Trading with the Flux MA and Quantum Flux Candle involves using the MA as a trend indicator and the candle colors as entry and exit signals. Here’s a step-by-step guide:
1. Identify the Trend Direction
• Bullish Trend : The Flux Candle is green and positioned above the Flux MA. This indicates upward momentum.
• Bearish Trend : The Flux Candle is red and positioned below the Flux MA. This indicates downward momentum.
The Flux MA serves as the reference line—candles above it suggest buying pressure, while candles below it suggest selling pressure.
2. Interpret Candle Colors for Trade Signals
• Green Candle : General bullish momentum. Consider entering or holding a long position.
• Red Candle : General bearish momentum. Consider entering or holding a short position.
• Yellow Candle : A strong buy signal. This is an ideal time to enter a long trade.
• Purple Candle : A strong sell signal. This is an ideal time to enter a short trade.
3. Enter Trades Based on Crossovers and Colors
• Long Entry : Enter a buy position when the Flux Candle turns green and crosses above the Flux MA. If it turns yellow, this is an even stronger signal to go long.
• Short Entry : Enter a sell position when the Flux Candle turns red and crosses below the Flux MA. If it turns purple, this is an even stronger signal to go short.
4. Exit Trades
• Exit Long : Close your buy position when the Flux Candle turns red or crosses below the Flux MA, indicating the bullish trend may be reversing.
• Exit Short : Close your sell position when the Flux Candle turns green or crosses above the Flux MA, indicating the bearish trend may be reversing.
•You might also exit a long trade if the candle changes from yellow to green (weakening strong buy signal) or a short trade from purple to red (weakening strong sell signal).
5. Use Additional Confirmation
To avoid false signals, combine the Flux MA and candle signals with other indicators or dashboard metrics (e.g., trend strength, momentum, or volume pressure). For example:
•A yellow candle with a " Strong Bullish " trend and high buying volume is a robust long signal.
•A red candle with a " Moderate Bearish " trend and neutral momentum might need more confirmation before shorting.
Practical Example
Imagine you’re scalping a cryptocurrency:
• Long Trade : The Flux Candle turns yellow and is above the Flux MA, with the dashboard showing "Strong Buy" and high buying volume. You enter a long position. You exit when the candle turns red and dips below the Flux MA.
• Short Trade : The Flux Candle turns purple and crosses below the Flux MA, with a "Strong Sell" signal on the dashboard. You enter a short position. You exit when the candle turns green and crosses above the Flux MA.
Market Presets and Adaptation
This indicator is designed to work on any market with candlestick price data (stocks, crypto, forex, indices, etc.). To handle different behavior, it provides presets for major asset classes. Selecting a “Stocks,” “Crypto,” “Forex,” or “Options” preset automatically loads a set of parameter values optimized for that market . For example, a crypto preset might use a shorter lookback or higher sensitivity to account for crypto’s high volatility, while a stocks preset might use slightly longer smoothing since stocks often trend more slowly. In practice, this means the same core QFC logic applies across markets, but the thresholds and smoothing adjust so signals remain relevant for each asset type.
Usage Guidelines
• Recommended Timeframes : Optimized for 1 minute to 15 minute intraday charts. Can also be used on higher timeframes for short term swings.
• Market Types : Select “Crypto,” “Stocks,” “Forex,” or “Options” to auto tune periods, thresholds and weights. Use “Custom” to manually adjust all inputs.
• Interpreting Signals : Always confirm a signal by checking that trend, volume, and VWAP agree on the dashboard. A green “Strong Buy” arrow with green trend, green volume, and price > VWAP is highest probability.
• Adjusting Sensitivity : To reduce false signals in fast markets, enable DI Reversal Confirmation and Dynamic Thresholds. For more frequent entries in trending environments, enable Early Entry Trigger.
• Risk Management : This tool does not plot stop loss or take profit levels. Users should define their own risk parameters based on support/resistance or volatility bands.
Background Shading
To give you an at-a-glance sense of market regime without reading numbers, the indicator automatically tints the chart background in three modes—neutral, bullish and bearish—with two levels of intensity (light vs. dark):
Neutral (Gray)
When ADX is below 20 the market is considered “no trend” or too weak to trade. The background fills with a light gray (high transparency) so you know to sit on your hands.
Bullish (Green)
As soon as ADX rises above 20 and +DI exceeds –DI, the background turns a semi-transparent green, signaling an emerging uptrend. When ADX climbs above 30 (strong trend), the green becomes more opaque—reminding you that trend-following signals (Strong Buy, Pullback) carry extra weight.
Bearish (Red)
Similarly, if –DI exceeds +DI with ADX >20, you get a light red tint for a developing downtrend, and a darker, more solid red once ADX surpasses 30.
By dynamically varying both hue (green vs. red vs. gray) and opacity (light vs. dark), the background instantly communicates trend strength and direction—so you always know whether to favor breakout-style entries (in a strong trend) or stay flat during choppy, low-ADX conditions.
The setup shown in the above chart snapshot is BTCUSD 15 min chart : Binance for reference.
Disclaimer
No indicator guarantees profits. Backtest or paper trade this tool to understand its behavior in your market. Always use proper position sizing and stop loss orders.
Good luck!
- BullByte

OnePunch Algo Scalper V6Overview:
OnePunch Algo Scalper V6 is an invite-only script designed for short-term trend scalping and extreme reversal detection. It uniquely combines classic momentum and volume indicators, enhanced with multi-time session awareness, to deliver precise high-probability entry alerts.
Core Concepts:
RSI and CCI are used together to identify momentum exhaustion points for early reversal spotting.
CMF is integrated to filter buy signals only when volume flow confirms bullish intent, avoiding weak uptrends.
SMA overlays track medium to long-term trends to confirm direction bias for safer scalping entries.
MACD Histogram weakness detection adds a momentum weakening filter to confirm whether bullish/bearish pressure is losing strength — improving risk-reward setups.
Stochastic crossovers help predict short-term pullbacks, allowing for precision "Prepare for CALL/PUT" signals.
Session-based background coloring indicates high-probability trading windows (Morning, Midday, Afternoon), guiding users to focus on optimal times.
Signals Generated:
✅ "Trending Up": Momentum acceleration uptrend signal (RSI + CCI crossover with volume confirmation).
✅ "Trending Down": Momentum deceleration sell signal.
✅ "Reversal Up" / "Bearish Down": Extreme oversold/overbought reversals.
✅ "Prepare for PUTs/CALLs": Anticipation signals based on stochastic weakening + MACD histogram convergence.
Chart Setup:
The script draws clean shape labels on the chart for each event (e.g., "Up Trend", "Bearish") for clarity.
Background highlights show different sessions to help traders recognize the most liquid periods.
No other indicators are required on the chart.
Usage Notes:
This script is ideal for scalping or short intraday swing trades on liquid assets like indices, crypto, or forex.
Best results when combined with manual Support/Resistance marking (use "Prepare for PUTs/CALLs" near S/R zones).

Pro Scalper AI [BullByte]The Pro Scalper AI is a powerful, multi-faceted scalping indicator designed to assist active traders in identifying short-term trading opportunities with precision. By combining trend analysis, momentum indicators, dynamic weighting, and optional AI forecasting, this tool provides both immediate and latched trading signals based on confirmed (closed bar) data—helping to avoid repainting issues. Its flexible design includes customizable filters such as a higher timeframe trend filter, and adjustable settings for ADX, ATR, and Hull Moving Average (HMA), giving traders the ability to fine-tune the strategy to different markets and timeframes.
Key Features :
- Confirmed Data Processing :
Utilizes a helper function to lock in price and volume data only from confirmed (closed) bars, ensuring the reliability of signals without the risk of intrabar repainting.
- Trend Analysis :
Employs ADX and Directional Movement (DI) calculations along with a locally computed HMA to detect short-term trends. An optional higher timeframe trend filter can further refine the analysis.
- Flexible Momentum Modes :
Choose between three momentum calculation methods—Stochastic RSI, Fisher RSI, or Williams %R—to match your preferred style of analysis. This versatility allows you to optimize the indicator for different market conditions.
- Dynamic Weighting & Volatility Adjustments :
Adjusts the contribution of trend, momentum, volatility, and volume through dynamic weighting. This ensures that the indicator responds appropriately to varying market conditions by scaling its sensitivity with user-defined maximum factors.
- Optional AI Forecast :
For those who want an extra edge, the built-in AI forecasting module uses linear regression to predict future price moves and adjusts oscillator thresholds accordingly. This feature can be toggled on or off, with smoothing options available for more stable output.
- Latching Mode for Signal Persistenc e:
The script features a latching mechanism that holds signals until a clear reversal is detected, preventing whipsaws and providing more reliable trade entries and exits.
- Comprehensive Visualizations & Dashboard :
- Composite Oscillator & Dynamic Thresholds : The oscillator is plotted with dynamic upper and lower thresholds, and the area between them is filled with a color that reflects the active trading signal (e.g., Strong Buy, Early Sell).
- Signal Markers : Both immediate (non-latching) and stored (latched) signals are marked on the chart with distinct shapes (circles, crosses, triangles, and diamonds) to differentiate between signal types.
- Real-Time Dashboard : A customizable dashboard table displays key metrics including ADX, oscillator value, chosen momentum mode, HMA trend, higher timeframe trend, volume factor, AI bias (if enabled), and more, allowing traders to quickly assess market conditions at a glance.
How to Use :
1. S ignal Interpretation :
- Immediate Signals : For traders who prefer quick entries, the indicator displays immediate signals such as “Strong Buy” or “Early Sell” based on the current market snapshot.
- Latched Signals : When latching is enabled, the indicator holds a signal state until a clear reversal is confirmed, offering sustained trade setups.
2. Trend Confirmation :
- Use the HMA trend indicator and the optional higher timeframe trend filter to confirm the prevailing market direction before acting on signals.
3. Dynamic Thresholds & AI Forecasting :
- Monitor the dynamically adjusted oscillator thresholds and, if enabled, the AI bias to gauge potential shifts in market momentum.
4. Risk Management :
- Combine these signals with additional analysis and sound risk management practices to determine optimal entry and exit points for scalping trades.
Disclaimer :
This script is provided for educational and informational purposes only and does not constitute financial advice. Trading involves risk, and past performance is not indicative of future results. Always perform your own analysis and use proper risk management strategies before trading.

No-Lag MA Crossover ScalperThe No Lag Crossover Scalper aims to capitalize on short-term trends using a combination of Hull Moving Average (HMA) for trend detection and multiple indicators for generating buy and sell signals. Here’s an overview of its components and approach:
1. Trend Detection with Hull Moving Averages (HMA) :
- Dual Hull MA Setup : Uses two Hull Moving Averages (HMA) to detect crossovers and crossunders, which are signals of short-term trend changes.
- No Lag Nature : HMAs are chosen for their ability to reduce lag compared to traditional moving averages, providing quicker responses to price movements.
2. Indicators for Signal Generation :
- Relative Strength Index (RSI) : Detects overbought and oversold conditions, generating signals when price movements diverge from RSI readings.
- Moving Average Convergence Divergence (MACD) : Provides signals based on the convergence and divergence of two moving averages, indicating potential trend reversals.
- Stochastic Oscillator (Stoch) : Identifies momentum shifts by comparing the current closing price to its range over a specific period.
- On-Balance Volume (OBV) : Measures buying and selling pressure based on volume flow, signaling potential changes in price direction.
- RSI Divergence : Looks for discrepancies between price action and RSI values, suggesting weakening trends and possible reversals.
3. Signal Generation Logic :
- Buy Signals : Generated when both HMAs cross over, supported by bullish indications from RSI, MACD, Stoch, OBV, or RSI divergence. At least 2 indicators must be true to generate a signal.
- Sell Signals : Triggered when HMAs cross under, complemented by bearish signals from the mentioned indicators.
4. Implementation and Optimization :
- Parameter Optimization : Fine-tuning of indicator periods and sensitivity settings to balance signal accuracy and responsiveness.
- Confirmation Mechanisms : Use of multiple indicators to confirm signals, reducing false positives and enhancing reliability.
Overall, the No Lag Crossover Scalper combines the speed of Hull Moving Averages with the reliability of multiple indicators to identify short-term trends effectively. By focusing on no lag indicators and confirming signals with diverse technical tools, it aims to capitalize on rapid market movements while managing risk through disciplined execution.
Credits: used TradingView ta library for a lot of the built-in indicators.
Disclaimer: This is still experimental beta version so use at your own risk.

HilalimSBHilalimSB A Wedding Gift 🌙
HilalimSB - Revealing the Secrets of the Trend
HilalimSB is a powerful indicator designed to help investors analyze market trends and optimize trading strategies. Designed to uncover the secrets at the heart of the trend, HilalimSB stands out with its unique features and impressive algorithm.
Hilalim Algorithm and Fixed ATR Value:
HilalimSB is equipped with a special algorithm called "Hilalim" to detect market trends. This algorithm can delve into the depths of price movements to determine the direction of the trend and provide users with the ability to predict future price movements. Additionally, HilalimSB uses its own fixed Average True Range (ATR) value. ATR is an indicator that measures price movement volatility and is often used to determine the strength of a trend. The fixed ATR value of HilalimSB has been tested over long periods and its reliability has been proven. This allows users to interpret the signals provided by the indicator more reliably.
ATR Calculation Steps
1.True Range Calculation:
+ The True Range (TR) is the greatest of the following three values:
1. Current high minus current low
2. Current high minus previous close (absolute value)
3. Current low minus previous close (absolute value)
2.Average True Range (ATR) Calculation:
-The initial ATR value is calculated as the average of the TR values over a specified period
(typically 14 periods).
-For subsequent periods, the ATR is calculated using the following formula:
ATRt=(ATRt−1×(n−1)+TRt)/n
Where:
+ ATRt is the ATR for the current period,
+ ATRt−1 is the ATR for the previous period,
+ TRt is the True Range for the current period,
+ n is the number of periods.
Pine Script to Calculate ATR with User-Defined Length and Multiplier
Here is the Pine Script code for calculating the ATR with user-defined X length and Y multiplier:
//@version=5
indicator("Custom ATR", overlay=false)
// User-defined inputs
X = input.int(14, minval=1, title="ATR Period (X)")
Y = input.float(1.0, title="ATR Multiplier (Y)")
// True Range calculation
TR1 = high - low
TR2 = math.abs(high - close )
TR3 = math.abs(low - close )
TR = math.max(TR1, math.max(TR2, TR3))
// ATR calculation
ATR = ta.rma(TR, X)
// Apply multiplier
customATR = ATR * Y
// Plot the ATR value
plot(customATR, title="Custom ATR", color=color.blue, linewidth=2)
This code can be added as a new Pine Script indicator in TradingView, allowing users to calculate and display the ATR on the chart according to their specified parameters.
HilalimSB's Distinction from Other ATR Indicators
HilalimSB emerges with its unique Average True Range (ATR) value, presenting itself to users. Equipped with a proprietary ATR algorithm, this indicator is released in a non-editable form for users. After meticulous testing across various instruments with predetermined period and multiplier values, it is made available for use.
ATR is acknowledged as a critical calculation tool in the financial sector. The ATR calculation process of HilalimSB is conducted as a result of various research efforts and concrete data-based computations. Therefore, the HilalimSB indicator is published with its proprietary ATR values, unavailable for modification.
The ATR period and multiplier values provided by HilalimSB constitute the fundamental logic of a trading strategy. This unique feature aids investors in making informed decisions.
Visual Aesthetics and Clear Charts:
HilalimSB provides a user-friendly interface with clear and impressive graphics. Trend changes are highlighted with vibrant colors and are visually easy to understand. You can choose colors based on eye comfort, allowing you to personalize your trading screen for a more enjoyable experience. While offering a flexible approach tailored to users' needs, HilalimSB also promises an aesthetic and professional experience.
Strong Signals and Buy/Sell Indicators:
After completing test operations, HilalimSB produces data at various time intervals. However, we would like to emphasize to users that based on our studies, it provides the best signals in 1-hour chart data. HilalimSB produces strong signals to identify trend reversals. Buy or sell points are clearly indicated, allowing users to develop and implement trading strategies based on these signals.
For example, let's imagine you wanted to open a position on BTC on 2023.11.02. You are aware that you need to calculate which of the buying or selling transactions would be more profitable. You need support from various indicators to open a position. Based on the analysis and calculations it has made from the data it contains, HilalimSB would have detected that the graph is more suitable for a selling position, and by producing a sell signal at the most ideal selling point at 08:00 on 2023.11.02 (UTC+3 Istanbul), it would have informed you of the direction the graph would follow, allowing you to benefit positively from a 2.56% decline.
Technology and Innovation:
HilalimSB aims to enhance the trading experience using the latest technology. With its innovative approach, it enables users to discover market opportunities and support their decisions. Thus, investors can make more informed and successful trades. Real-Time Data Analysis: HilalimSB analyzes market data in real-time and identifies updated trends instantly. This allows users to make more informed trading decisions by staying informed of the latest market developments. Continuous Update and Improvement: HilalimSB is constantly updated and improved. New features are added and existing ones are enhanced based on user feedback and market changes. Thus, HilalimSB always aims to provide the latest technology and the best user experience.
Social Order and Intrinsic Motivation:
Negative trends such as widespread illegal gambling and uncontrolled risk-taking can have adverse financial effects on society. The primary goal of HilalimSB is to counteract these negative trends by guiding and encouraging users with data-driven analysis and calculable investment systems. This allows investors to trade more consciously and safely.

CANDLE LEVELS [PRO]This indicator provides you with 55 levels! with labels to help you identify quickly where current price is in relation to the OPEN, CLOSE, HIGH OF DAY and LOW OF DAY to a respective level. Choose from levels as low as the 5 minute time frame all the way up to 200 days. All of the levels except the day's OPEN, HIGH OF DAY AND LOW OF DAY use the PREVIOUS time frame's level. In other words, when you're looking at the "1 DAY HIGH", that's actually the previous day's HIGH OF DAY. Whether you're a scalper on the lower time frames or a swing trader that mainly uses the 1 hour and above, these candle levels can be an invaluable source of support and resistance; in other words you'll often see price bounce off of a level (whether price is increasing or decreasing) once or multiple times and that could be an indication of a price's direction. Another way that you could utilize this indicator is to use it in confluence with other popular signals, such as an EMA crossover. For instance, you could watch as price rises above the 21 EMA all the while price is also crossing up and over the previous day's HIGH OF DAY with a relative volume that's double that of the previous week's average. These are just a few of some potential bullish signals that you could look for to go long on a trade using the candle levels provided.
I've made this indicator extremely customizable:
⚡Each level has 2 labels: 1 "at level" and 1 "at right", each label and price can be disabled
⚡Each label has its own input for label padding. The "at right" label padding input allows you to zoom in and out of a chart without the labels moving along their respective axis
⚡Each label's text can be customized via an "input.string" code base
⚡Each level's label can be changed via a plot style setting to determine if the label is centered with it's respective level or rides along the top of it
⚡Significant figures input allows you to round price up or down
⚡A "bias EMA" tool that color codes the candles and price line to show you where price is in relation to the 21 EMA (or another value that you pick). As a result, this can be an effective visual to help reduce cognitive load
⚡A "fill level" where color is determined by price opening above or below the previous day's close
⚡A "use current close" setting that's great to use in pre-market as it shows you where price is in relation to the previous days' close
----------------------------------------------------------------------------------------------------------------------
🙏Thanks to (c)satymahajan for the inspiration behind the ATR "previous close" and "bias candle" code base
🙏Thanks to my mentor (c)SimpleCryptoLife for the libraries and extensive code to help create this indicator