Profit Sniper 3.0Profit Sniper 3.0 is a completely new Indicator built from the ground up as a successor to previous 1.0 and 2.0 versions of Profit Sniper.
Offering up huge improvements, including multiple position triggers, derived from Bollinger Bands and Chande Momentum as well as our own bespoke stochastic ribbons that provide trend pivots .
Profit Sniper 3.0 has been specifically re-written to simplify usage, and for use with automation, including our own in-house trading robot known as C.A.T (Crypto Algo Trader). Another big decision was to remove the MACD from the indicator package, as invariably users preferred using the built-in MACD .
So how does it work?
3.0 operates off two timeframes in parallel, your Trend Timeframe (Higher Timeframe concerned with identifying market up & down trends), and your Trade Timeframe (Lower Timeframe to actually trade Longs & Shorts in).
Within each timeframe, you can tailor your preference for waiting for either Stochastic Ribbon cross only, or Ribbon Cross followed by Chande Confirmation for that additional market structure confidence. Flags & Alerts will then provide you with numerous trading Long & Short trading opportunities per day.
You also have the option to trade with trend so the indicator will automatically flag & alert only Shorts in a Short trend, and Longs in a Long Trend.
If you would like access, please send me a PM.
Scalping

Crypto Scalper Pro Study / Alerts===========
Crypto Scalper Pro Study Script with Alerts
===========
Our Crypto Scalper Pro Study with Alerts Script is a carbon copy of our tried and tested Crypto Scalper Pro Strategy , but now with the option of setting TradingView Alerts for your chosen trading plan. Making missing trades a thing of the past, and helping you to automate your own trading strategy using AutoView, 3Commas or similar 3rd party Auto Trading Software.
-----------
Crypto Scalper Pro is a scalping strategy developed to work alongside our Crypto Tipster Strategy, now you can trade the D markets with our Tipster, and Intra-Day markets with our Scalper!
This strategy works very well on shorter time frames across multiple crypto pairs, everything from 4H all the way down to a 5m chart, our Crypto Scalper will find the best Entry and Exit points for consistent and reliable returns.
We've added a few variables for you to play with to fine tune this scalper to suit your chosen trading plan - however, these will only adjust the strategy to a certain degree, as there are many algorithms and indicators doing their thing hidden in the background that take precedence.
-----------
What's Included?
Crypto Scalper Pro comes with a host of features and is being continually updated, these features include (but are not limited to):
- Date Range Settings
Setting custom Start/End dates can help hone your strategy to suit the current times, or get a general overview of the market over the years.
- Heikin Ashi Confirmation
We added HA confirmation for both Entry & Exit of trades. This started as a form of "Safe Mode", we have since adapted our safe mode far beyond Heikin Ashi; but kept this confirmation as an added extra.
- Variable Indicator Settings
As well as our Fixed Indicators and Price Action analysis going on in the background of the strategy, we've also included some Variable Indicators that you have access to edit.
Lookback Period will help establish how far back you'd want to be confirming price indications on the strategy - the higher the number the further back it will look, making the Scalping Strategy appear smoother with less trades during choppy times, the downside with a higher lookback is you might miss the start of a potentially epic trade, and only be shown an Entry after the event has already happened.
We find Lookback Lengths of between 5 and 100 could work depending on various other settings, the market being traded, and the timeframe being used.
MA Length (Length of Moving Average) - We use a few MA's to best determine various factors involved with successfully scalping a market, overall trend direction, current price movements and fake-out detection to name just a few. You've got the option of determining a good average length for a few of these variables.
Again, a short MA Length will catch every big move right at the start, but you're almost guaranteed a Negative Expected Value with that method, due to the vast quantity of losing trades in times of chop/ranging markets. A Higher MA Length will remove a lot of chop, reduce the quantity of trades, and therefore (should) result in a higher Percent of Trades Profitable; it will however add a certain lag to the strategy, meaning those highly profitable trades we're looking for may turn out to be not so highly profitable!
- Safe Mode
Enabling Safe Mode will add a couple more confirmation indicators to the strategy - the aim of Safe Mode is, in essence, to remove any trading signals that would end of being false/bad moves. Usually resulting in less Overall Trades, a higher Net Profit, higher % Profitable, higher Profit Factor AND a lower Drawdown. Use Safe Mode to help eliminate orders that would otherwise be placed in choppy markets.
- Stop Loss/Take Profit Settings
This is where Crypto Scalper Pro really proves itself, Money Management. We have an editable Fixed SL/TP, as well as Trailing Stops for Long or Short orders, all of which you can use on their own, or combined with each other. Playing with these settings can turn an un-profitable system into a very-profitable trading plan!
-----------
What's Included within Crypto Scalper Study / Alerts Script?
Our Study script will find Entry and Exit points exactly as our Pro Strategy would find them. The same indicators, methods and chart reading techniques are used, there are 2 big differences however...
The first difference is that our Pro Strategy has the ability to manage your money, Fixed Stops, Take Profit and Trailing Stops to name just a few. Our Study does not (yet) have these functions added due to the way TradingView's charting platform operates.
That's the bad news, the good news for our Crypto Scalper Study Script is that you can add Alerts to your trading plan! This is super handy if you decide to implement our methods into different time frames across various markets and are looking for Intra-day Alerts, or if you're looking to Automate your trading strategy using external software.
Help and Advice for setting up Alerts or to Automate your Strategy can be found on our website.
----------
For more information on the Crypto Scalper Pro Strategy visit the link in our signature.
Good Luck and Happy Trading!

Theft Indicator - 5Min Scalping SystemWhat is our indicator?
Theft Indicator - Buy & Sell Alert System is our first published script that shows price action on a certain period of time (We Use ATR indicator). We take pride in enabling trading to become easier for the experienced and the non-experienced traders around the globe. Buy & Sell alerts will be fired once a condition in our algo is met.
Does it Repaint?
Our indicator does NOT re-paint. Although while setting an alert it may pop up the repaint alert, please take into consideration that once a signal is fired on a "CLOSED BAR", our signal will never disappear, they do not repaint.
What Markets is it usable with?
You can use it in any market, Forex, Stocks, Crypto, Indices. All time frames are profitable, not all trades. But the Majority is profitable if you use a stop loss and target price.
How to use:
Simple plug and play it to your chart, in addition to a few other indicators we will recommend to you (we still have not published them yet), and this will confirm your trades. You can also connect TV alerts with a bot and let it run. Please be aware that SLIPPAGE time is important, If you run a bot on this indicator you HAVE to know that the buy/sell price will be on the bar AFTER the Candle close (For example: the BUY/SELL alert is on a candle, the buy/sell your bot or you will execute WILL be in the following candle depending on your trading system. We advise you to not leave the bot to trade on its own, you have to monitor and have a specific syntax that we will help you with creating according to your trading style.
How are the Buy/Sell Alerts fired?
We use the simple ATR (Average True Range) indicator. However we have modified the indicator to serve our trading system. Check below for a definition of what ATR is:
What is Average True Range - ATR?
The average true range (ATR) is a technical analysis indicator that measures market volatility by decomposing the entire range of an asset price for that period. Specifically, ATR is a measure of volatility introduced by market technician J. Welles Wilder Jr. The true range indicator is taken as the greatest of the following: current high less the current low; the absolute value of the current high less the previous close; and the absolute value of the current low less the previous close. The average true range is then a moving average, generally using 14 days, of the true ranges.
Why is our indicator special and different from the normal ATR indicators?
We have modified the mathematical equation and changed it slightly to give more accurate signals, we do not promise all trades are profitable, the use of this indicator is up to your own judgement and liability. We believe that we have an indicator like no other ATR.
P.S: This is not financial advice, we are just sharing our indicator that we know has good results, and it will take time for people in -ve profiles to recover losses and for the profiting to be more profitable. We use a specific trading method that only works with it
You can contact me for more information about the indicator, Goodluck :)

ScalpyScalpy is made up of a 2 main parts.
- The cloud comprising of a 10 period SMA and a 30 period SMA.
- When the cloud is green you should be looking for long entries.
- When the cloud is red you should be looking for short entries.
- Price is most bullish above a green cloud and most bearish below a red cloud.
- Being within the cloud indicates indecision.
The blue and white lines on the indicator show the relationship between price and momentum.
They can be used to spot reversals in two ways:
- The first is a divergence between price (blue line) and RSI (white line)
- If the price makes a lower low but the RSI makes a higher low this shows the trend is weakening and may be reversing soon (as can be seen by the two yellow lines on the chart).
The second is a simple crossover:
- When the white line crosses the blue line to the upside this signals a long entry.
- When the white line crosses the blue line to the downside this signals a short entry.

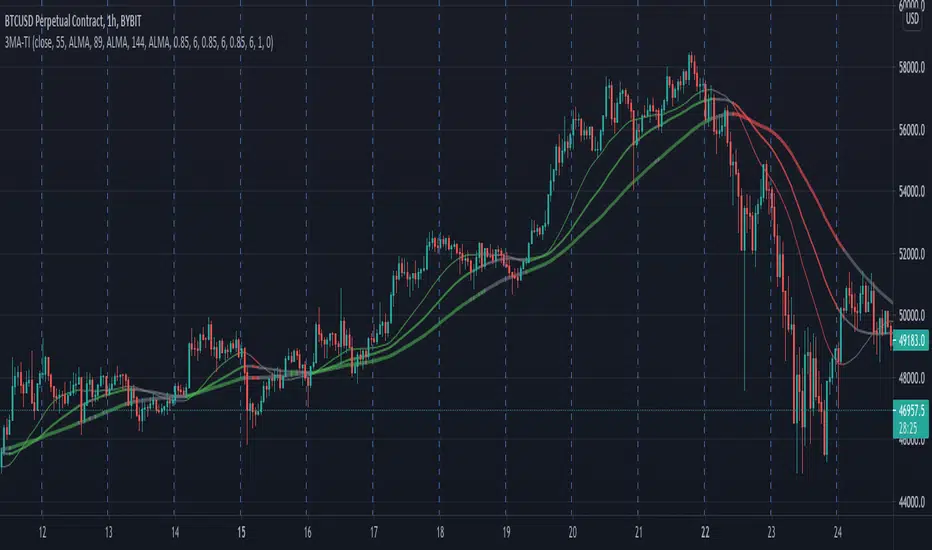
3 MA Trend IndicatorIt is a trend detector indicator, using 3 moving averages.
You can select different MA's and set the periods of them. If all 3 is increasing, the color will be green, if decreasing, the color will be red, gray otherwise.
It can be used for e.g. scalping.
Profit Sniper 2.0 Visual Scalper CompanionProfit Sniper companion indicator for scalping, derived from standard Chande Momentum that can be changed to display Heiken-Ashi Chande while Japanese candles are displayed on the screen.
To be used as a visual tool alongside "Profit Sniper 2.0" Indicator to allow you to clearly and easily verify Heiken-Ashi Chande Momentum precise position and general trend at the time a "Sight" label is painted onto your chart from the main "Profit Sniper 2.0" Indicator.
We'll be adding further indicators in the near future to match legacy Profit Sniper.

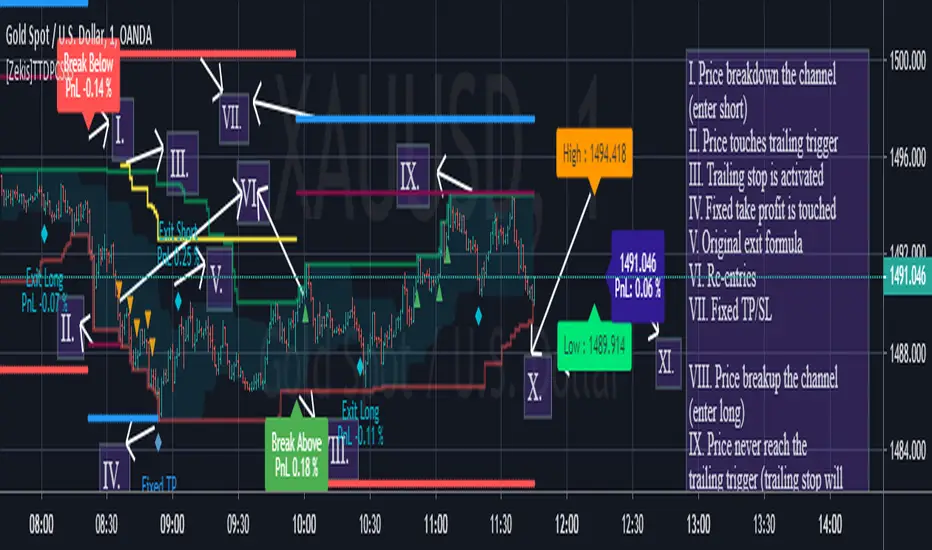
[Zekis]Turtle Trading Donchian Price Channels StrategyOne of the most famous strategy in the history of trading, #Turtle strategy have numerous legends, one of them is using Donchian Price Channels with 55 period for entries and 20 period for exits.
Can be used with any time frame
Added alerts
I added re-entries and re-exits for more scalps or for laddering trading.
Also you can modify parameters for entries and exits for your market needs.
Trade safe!
@Zekis
[JOHN] KNIFE CUThEY HELLO PEOPLE, THIS IS KNIFE CUT
This indicator work in sync with SUPER BOSS , check it.
KNIFE CUT
You can consider this as "BUY THE DIP" that is the best part of it. "BUY WHEN THE AREA IS BACK TO GREEN".
Is a special indicator with 2 metrics you can use for be a better trade and stop losing money entering useless positions.
This indicator can:
The Area in the center measure "Market cycles" check below, and "BUY PRESSURE", check the reaction with the price action, impressive? i know.
About the bars green or red, are trend bars, compare it to the price action and you can see that these bars catched all uptrends and downtrends.
(you can change also resolutions of background bars, current H4 resolution if you watch lower timeframes.)
*BUY PRESSURE / TREND BACKGROUND BARS
*MARKET CYCLES
This script work with every exchange and pairs, also forex.
See price history.
You not believe? i believe.

[BT] - ScalpMaster [ALERTS] v1Go easy on this script as it's my first, hopefully more to come!
ScalpMaster - V1
It's main feature is catch a bull run for volatile markets. Two main selling triggers (CCI and TSSL) with an option to only sell after fees are met (for profit).
Built in Statistics and Back-testing
I've introduced my own version of backtesting built into the main script. You can disable it if it's too much, just makes it easier to dial the settings in and compare with alert triggering. I've included this on all of my scripts.
***You will get a warning that this script repaints, however you can easily compare alerts against the labels. I'm not entirely sure, but I believe the repainting is due to the Global Stats Label at the end gets repainted to keep in the front. ***
Directions
Buy: When dialing in the script, watch the purple line above the source, when the current price crosses above this purple line then the buying trigger sets.
Sell: TSSL - Trailing Stop / Stop Limit, use available settings to manipulate behavior. It's meant to trail the bull run and sell once the price crosses the bottom tssl bar
Sell: CCI - Modify the FastMA and SlowMA settings
Sell: P+ - Above won't trigger until you are in the positive after the fees x2 are met. Great to keep your losses minimal. Combine this with a high Stop Loss for great results but might be waiting awhile for a profit.

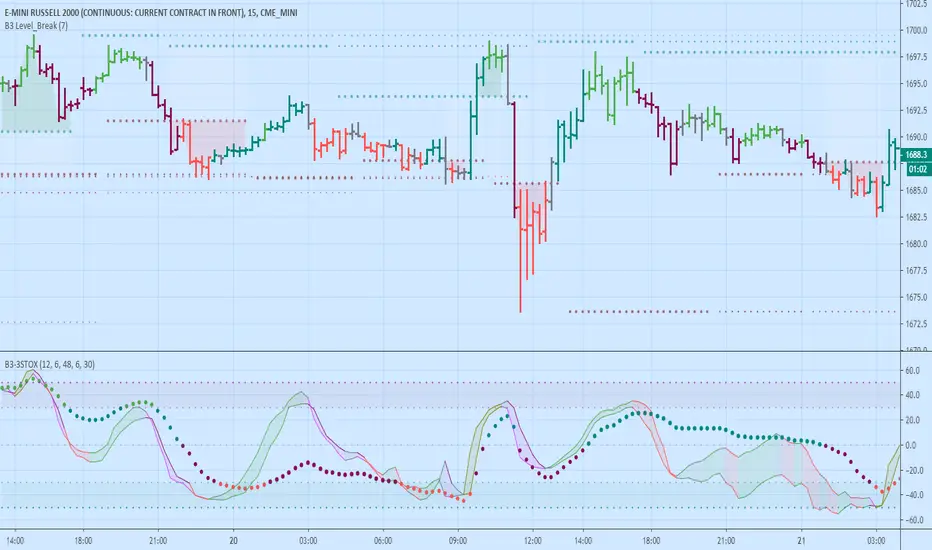
B3 3-Stox - Scalping OscillatorThis is an indicator that combines what I see some scalpers use on youtube videos and webinars.
3 Stox = Three Stochastic Readings
Fast Stochastic of Highs
Fast Stochastic of Lows
Slow Stochastic of Bar Average
Bar Color Code
Bar Color Coded
Light Green = Long with trend
Dark Green = Long counter trend
Light Red = Short with trend
Dark Red = Short counter trend
Fast Line Color Code
Green = Lows leading highs up (Organized Rise)
Olive = Highs leading lows up (Rapid Rise)
Red = Highs leading lows down (Organized Fall)
Fuchsia = Lows leading lows down (Rapid Fall)
Trades to be looked at:
Trading in the direction of the fast lines, when they are similar to and near one another, in the same direction as the Slow stochastic line's color or slope
Trading Long Fastline green color when all 3 lines are oversold
Trading Short Fastline red color when all 3 lines are overbought
AVOID Trading when fast lines are spread out and a large cloud appears between them (Chop Filter)
Look for solid up & down & up & etc. oscillation or you can use the slow line to find trends to trade
Green and red fast lines are organized moves, the olive and purple lines are faster moves and harder to lock in sometimes
Things to note:
Pairs nicely with a level printing study like B3 Level Break (applied on above chart)
There are 2 color schemes for the Fast High and Low Stochastic lines, and 2 color schemes for the bars
In this script the bar average is defined as (open+high+low+close+close ) / 5, keep the slow line at a large length input so that you can get a macro trend reading without zooming out the chart
The Extended Stochastics from one of my previous scripts is defaulted as the style used, however, you may turn that feature off and use the classic Stochastics
More details: drive.google.com
Enjoy!
~ B3 d^.^b
NiLUX Trend Scalper TSSL (Alerts)Trend Following Scalping Bot
Great results on pretty much any pair and timeframe
Features:
Dynamic Trend Detection
Long / Short Scalp Alerts
Take Profit (Trailing Stop) & Stop Loss Alerts
TP/SL Plots for Profitview included
This is Donationware 🍺
Leave me a tip, you decide the amount, then send me a DM to get access.
The link to my tip jar is below in the signature

[astropark] I love Fibonacci V1Dear Followers,
I Love Fibonacci is a tool designed to have a professional market momentum perspective to help you get rid of your emotions and trade more securely!
Don't let FOMO, fear and indecision take control of your trading actions!
Use it together with my 21 days EMA indicator
and EMA Ribbons
Here some examples on how to use them all together on EURUSD trading pair
and on BTCUSD trading pair
This is a free indicator, direct message me if you need further help.

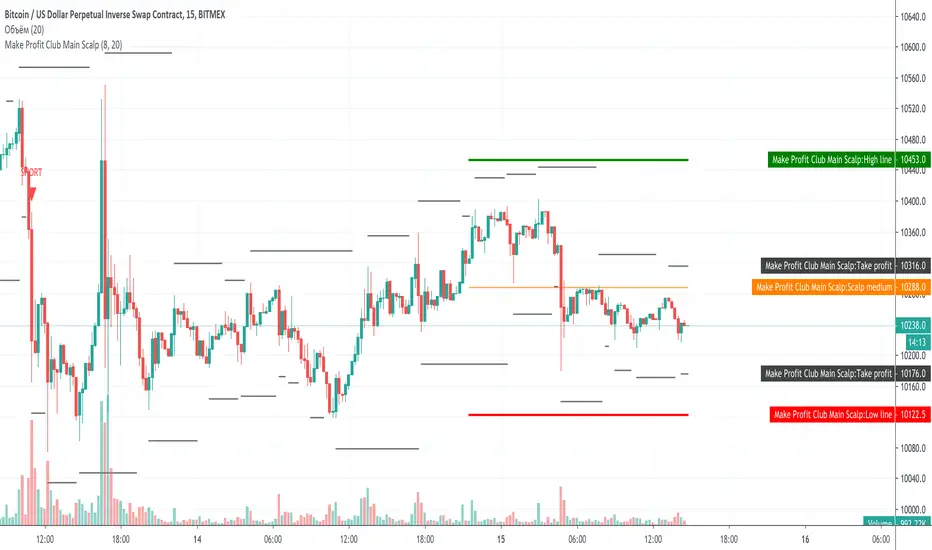
Make Profit Club Main ScalpThe main scalping indicator.
We use this indicator to trade for a short time in a TF of 5-15 minutes.
We have created takeprofit zones for you so that you can understand where we can get to and take your profit. these points are mostly very helpful.
There are basic settings that allow you to adjust the indicator individually for each situation; because of this, this indicator can be used for any exchange and any currency pair.
For Scalp trading, we use 3 different strategies available to our clients. If you enter them correctly, you can never see the minus sign.
Use the link below to obtain access to this indicator.
[astropark] Trend Is Your Friend V3 [alarms]Dear Followers,
today another awesome Swing and Scalping Trading Strategy indicator, runnable on a bot , which works great on High Timeframes (1D is suggested) but also on lower ones (just write me in order to help you find correct settings) and even better on 1m Renko chart!
If you are a scalper, you will love suggested entries for fast profit. You can run it on 1h timeframe (below is not suggested, there is "no-trend" below 1h!) if you are used to scalp trading and close each trade whenever you feel happy (a proper trailing stop strategy is suggested anyway).
This is not an evolution of "Trend Is Your Friend V1" or V2 , but a twin sister or the "Trend Is Your Friend V1" indicator you can see here below
and twin sister or the "Trend Is Your Friend V2" indicator you can see here below
This strategy differs for the engine used as basis, but has the same usage settings:
enable/disable signals on chart
enable/disable showing trend cloud
enable/disable bar coloring based on trend
enable/disable background coloring based on trend
edit trend period length (direct message me in order to help you fine best settings)
edit a smart variant option to enhance the trend cloud on your chart
enable/disable an option to smart enter trade
This strategy only trigger 1 buy or 1 sell. In order to get notified when a signal is triggered, you need to use the "alarms" version of this indicator.
Strategy results are calculated on the timeframe from December 2012 to now, so on 8 years, using 10000$ as initial capital and working at 1x leverage (so no leverage at all! If you like to use leverage, be sure to use a safe option, like 3x or 5x at most in order to have liquidation price very far).
This is not the "Holy Grail", so use a proper risk management strategy.
This script will let you set all notifications you may need in order to be alerted on each triggered signals.
The one for backtesting purpose can be found by searching for the astropark's "trend is your friend v3" and then choosing the indicator with "strategy" suffix in the name, or you can find here below
This is a premium indicator , so send me a private message in order to get access to this script.

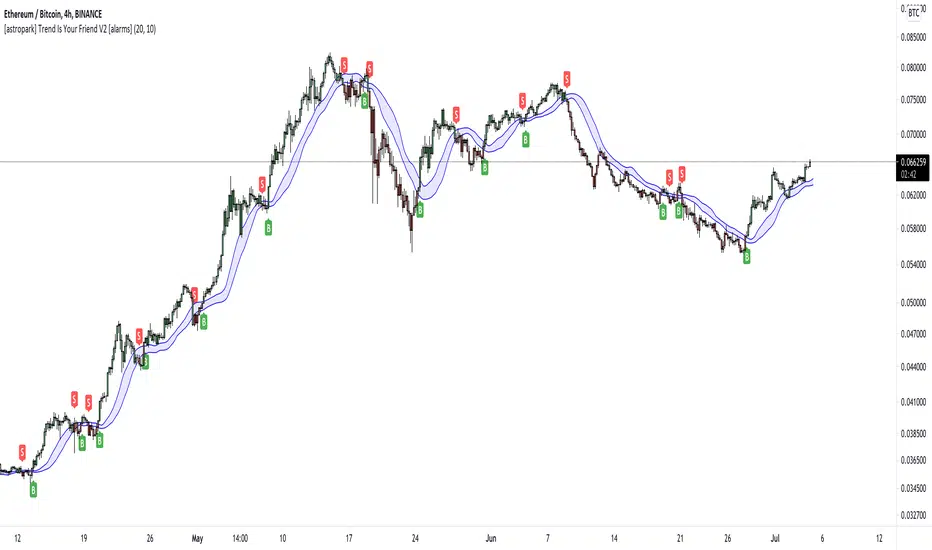
[astropark] Trend Is Your Friend V2 [alarms]Dear Followers,
today another awesome Swing and Scalping Trading Strategy indicator, runnable on a bot , which works great on High Timeframes (1D is suggested) but also on lower ones (just write me in order to help you find correct settings) and even better on 1m Renko chart!
If you are a scalper, you will love suggested entries for fast profit. You can run it on 1h timeframe (below is not suggested, there is "no-trend" below 1h!) if you are used to scalp trading and close each trade whenever you feel happy (a proper trailing stop strategy is suggested anyway).
This is a twin sister or the "Trend Is Your Friend V1" indicator you can see here below
This strategy differs for the engine used as basis, but has the same usage settings:
enable/disable signals on chart
enable/disable showing trend cloud
enable/disable bar coloring based on trend
enable/disable background coloring based on trend
edit trend period length (you have to increase it if you go on lower timeframes or you go on FOREX/Stocks market, direct message me in order to help you fine best settings)
This strategy only trigger 1 buy or 1 sell. In order to get notified when a signal is triggered, you need to use the "alarms" version of this indicator.
Strategy results are calculated on the timeframe from January 2015 to now, so on 5 years, using 10000$ as initial capital and working at 1x leverage (so no leverage at all! If you like to use leverage, be sure to use a safe option, like 3x or 5x at most in order to have liquidation price very far).
This is not the "Holy Grail", so use a proper risk management strategy.
This script will let you set all notifications you may need in order to be alerted on each triggered signals.
The one for backtesting purpose can be found by searching for the astropark's "trend is your friend" and then choosing the indicator with "strategy" suffix in the name, or you can find here below
This is a premium indicator , so send me a private message in order to get access to this script.
[astropark] Trend Is Your Friend V1 [alarms]Dear Followers,
today another awesome Swing and Scalping Trading Strategy indicator, runnable on a bot , which works great on High Timeframes (1D is suggested) but also on lower ones (just write me in order to help you find correct settings) and even better on 1m Renko chart!
If you are a scalper, you will love suggested entries for fast profit. You can run it on 1h timeframe (below is not suggested, there is "no-trend" below 1h!) if you are used to scalp trading and close each trade whenever you feel happy (a proper trailing stop strategy is suggested anyway).
This strategy let's you edit following settings:
enable/disable signals on chart
enable/disable showing trend cloud
enable/disable bar coloring based on trend
enable/disable background coloring based on trend
enable a special option to enhance trend cloud on FOREX/Stocks charts (optional)
edit trend period length (you have to increase it if you go on lower timeframes, like 1h)
This strategy only trigger 1 buy or 1 sell. In order to get notified when a signal is triggered, you need to use the "alarms" version of this indicator.
Strategy results are calculated on the timeframe from August 2017 to now, so on almost 2 years and half, using 10000$ as initial capital and working at 1x leverage (so no leverage at all! If you like to use leverage, be sure to use a safe option, like 3x or 5x at most in order to have liquidation price very far).
This is not the "Holy Grail", so use a proper risk management strategy.
This script will let you set all notifications you may need in order to be alerted on each triggered signals.
The one for backtesting purpose can be found by searching for the astropark's "trend is your friend" and then choosing the indicator with "strategy" suffix in the name, or you can find here below
This is a premium indicator , so send me a private message in order to get access to this script.

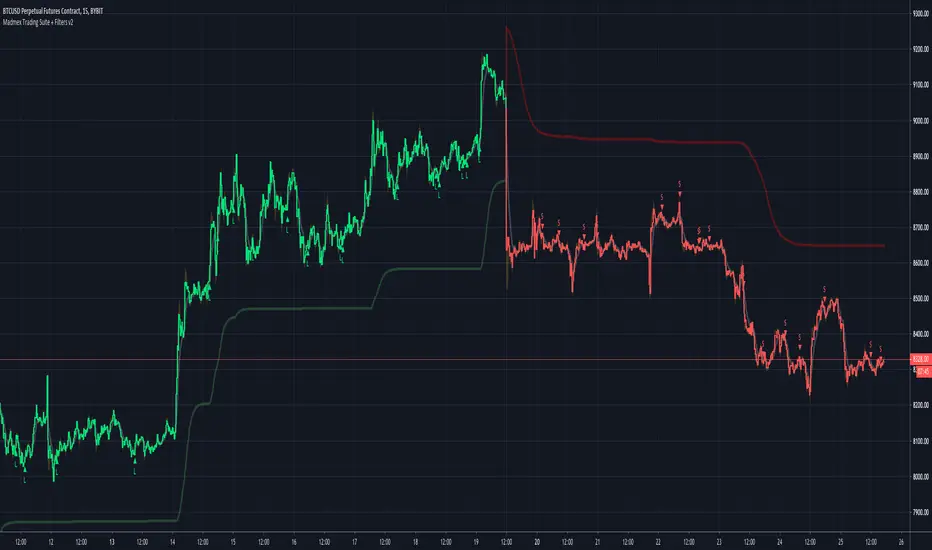
Madmex Trading Suite + FiltersA goodie for my trading groups and friends. A suite of different MAs with Filters with multiple Long/Short Alerts, works as well for pyramiding.
Using fixed TP/SL is advised. I might add TP/SL Alerts later on...
Good luck!
Feedback is appreciated!
Intraday S/RPlots yesterday's low and high, and the current day's open, as intraday support/resistance levels.

Trend Scalper (Expo)Trend Scalper (Expo)
DESCRIPTION
Trend Scalper (Expo) is a Scalping strategy based on RSI, Stochastic and moving averages techniques. The idea is to visualize scalping opportunities in trends.
The trend is determined by the color of the moving average called ‘TrendHolder’ The ‘Trendholer’ consists of 3 colors, green, red and orange. Green is a positive trend, red is a negative trend and orange is a neutral or no trend.
Scalping opportunities are visualized by the circles and the triangles. The circles are based on RSI calculation. The triangles are based on Stochastic calculation.
- If there is a green circle and a green triangle and ‘Trendholder’ is orange or green, Enter Long!
- If there is a red circle and a red triangle and ‘Trendholder’ is orange or red, Enter Short!
Combine the indicator with HEIKIN ASHI candlesticks.
HOW TO USE
1. Use the indicator to find scalping opportunities in trends.
I NDICATOR IN ACTION
BTCUSD
EURUSD
GOLD
The indicator works with RENKO, HEIKIN ASHI and with KAGI charts as well.
I hope you find this indicator useful, and please comment or contact me if you like the script or have any questions/suggestions for future improvements. Thanks!
I will continue to work on this indicator, so please share your experience and feedback with me so that I can continuously improve it. Thanks to everyone that have contacted me regarding my scripts. Y our feedback is valuable for future developments!
ACCESS THE INDICATOR
• Contact me on TradingView or use the links below
-----------------
Disclaimer
Copyright by Zeiierman.
The information contained in my scripts/indicators/ideas does not constitute financial advice or a solicitation to buy or sell any securities of any type. I will not accept liability for any loss or damage, including without limitation any loss of profit, which may arise directly or indirectly from use of or reliance on such information.
All investments involve risk, and the past performance of a security, industry, sector, market, financial product, trading strategy, or individual’s trading does not guarantee future results or returns. Investors are fully responsible for any investment decisions they make. Such decisions should be based solely on an evaluation of their financial circumstances, investment objectives, risk tolerance, and liquidity needs.
My scripts/indicators/ideas are only for educational purposes!

Master ScalpA unique scalpel indicator with high accuracy analyzes the market and determines the points for entering a position. Allows you to trade inside the channel. The algorithm underlying it is protected by copyright.

DB-X + DSMAJust a quick hack to combine both studies. Could be used for scalping or whatever you find it useful for... ;)
Alerts should work but no backtesting done on it.

UltraScalperUses a modified ATR to find entries, take profits, and stop losses. Optimized for the 3m chart, but can be used on higher time frames with some tinkering of the settings.

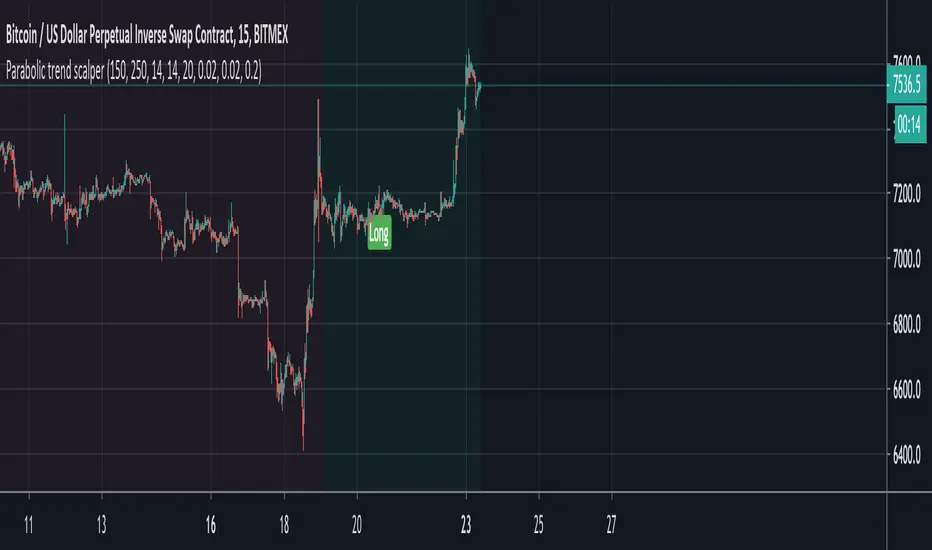
Parabolic trend scalperThis is based on a well known 5 min forex scalping strategy that analyses the general trend and goes long/short in that direction. Trades are filtered against a number of fundamentals to minimise the chances of weak signals.
Dark green = Upward trend
Light green = Long signal
Dark red = Downward trend
Light red = Short signal
Alerts are built in and should be set to 'once per candle' if trading with a bot. Ensure that your setup ignores alerts for positions already open in the same direction.